Voltage Flicker Severity Indices Framework
By Roger Frank, P.Eng, BC Hydro
By Roger Frank, P.Eng, BC Hydro
Our customized live online or in‑person group training can be delivered to your staff at your location.
Voltage flicker becomes enforceable when Pst and Plt severity indices cross perceptibility thresholds under weak three phase grid conditions.
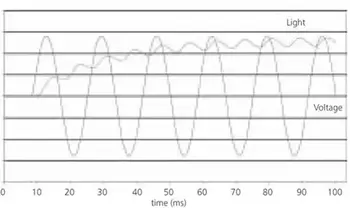
Voltage flicker severity is quantified through standardized perceptibility curves and IEC measurement windows that translate repetitive voltage modulation into compliance relevant indices. Under variable three phase load cycling, threshold discipline determines whether the disturbance remains operationally acceptable or escalates into regulatory exposure.
In industrial systems, flicker is not evaluated by visual observation but by statistically processed severity indices that reflect repetition rate, modulation depth, and persistence over defined aggregation intervals. The engineering decision is whether the measured disturbance exceeds structured compliance limits when system strength, short circuit capacity, and reactive power swing are taken into account.
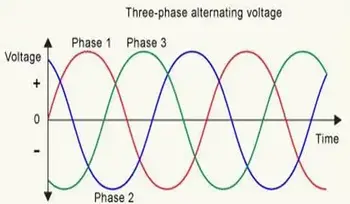
In three phase networks serving arc furnaces, rolling mills, or large motor groups, flicker behavior is shaped by load step magnitude and feeder impedance at the point of common coupling. Interpretation must therefore consider grid strength and duty cycle rather than isolated voltage deviation.
Voltage flicker severity interpretation exists within the broader Power Quality compliance framework, where voltage variation, distortion, and threshold governance define operational acceptability. Flicker indices are structured components of system quality evaluation rather than isolated nuisance indicators.
Short term severity Pst represents perceptibility over a standardized 10 minute interval. Long term severity Plt aggregates twelve consecutive Pst values over two hours using cubic averaging that weights persistence more heavily than isolated events. This creates a threshold discipline issue. A facility may maintain Pst below 1.0 in most intervals yet exceed Plt limits when moderate disturbances accumulate across the aggregation window.
Download our FREE Electrical Training Catalog and explore a full range of expert-led electrical training courses.

That aggregation structure introduces compliance risk that is not visible in single event review. Utilities commonly reference Pst of 1.0 and Plt of 0.8 as boundary conditions, but those values are defensible only when measurements conform to IEC 61000-4-15 filtering and weighting curves. Measurement governance must therefore align with a structured Power Quality Monitoring architecture and a validated Power Quality Analyzer configuration. If instrument response deviates from IEC weighting, reported severity can understate modulation depth, weakening regulatory defensibility.
Perceptibility curves define the relationship between modulation frequency and the sensitivity to visible disturbances. Industrial flicker performance, however, is strongly dependent on short circuit ratio and feeder impedance. A weak bus with reduced fault level will experience greater voltage modulation for identical load variation than a stiff source.
This interaction produces cascading operational consequences. As the production duty cycle increases in a weak feeder environment, reactive power steps deepen voltage fluctuations, elevating Pst at the point of common coupling. Customer complaints cluster. Severity indices are reviewed. If Plt exceeds threshold values across multiple billing cycles, regulatory review may compel reinforcement or reactive compensation investment.
When customer service indices and compliance metrics are tracked at the executive level, sustained flicker becomes an enterprise risk variable rather than a localized disturbance.
Variable industrial loading introduces interpretation ambiguity. Commissioning sequences, motor acceleration, or batch processing cycles may elevate Pst during defined operational windows. The engineering question is whether those intervals represent acceptable duty cycle behavior or structural non compliance.
Threshold discipline requires correlation between severity indices and three phase loading magnitude. Calculations using Three Phase Power Calculation and the Apparent Power Formula clarify the relationship between step load kVA swing and resulting voltage deviation. Without this correlation, Pst and Plt values lack diagnostic context.
A deployment tradeoff emerges between upstream reinforcement and reactive compensation. Reinforcement reduces impedance sensitivity but demands capital allocation. Compensation reduces modulation amplitude but can interact with existing distortion, governed by Power Quality and Harmonics constraints, and with existing Power Factor Correction strategies. Mitigation decisions must therefore consider both flicker reduction and harmonic stability.
An operational edge case arises in feeders with distributed generation operating near unity power factor. Rapid irradiance variations in photovoltaic systems can introduce a reactive imbalance, masking true flicker source attribution. Severity measured at the substation may underrepresent downstream modulation if monitoring is not deployed at the appropriate node.
Telemetry governance also constrains interpretation. If Pst intervals are incomplete due to data gaps, or if Plt aggregation windows are interrupted by logging resets, persistence effects may be mischaracterized. Structured Power Quality Troubleshooting workflows must integrate severity indices with load and event records to avoid false conclusions.
Quantified authority signals matter. Where short circuit capacity falls below roughly 20 times the largest repetitive step load, the probability of flicker amplification increases materially. In such conditions, even a 2% voltage modulation at frequencies near 8-10 Hz can drive Pst toward unity, depending on the repetition rate. These boundaries define the line between acceptable variation and enforceable exposure.
Voltage flicker assessment is therefore a structured statistical inference problem embedded within system strength and duty-cycle analysis. The decision is not whether modulation exists. It is whether severity indices, interpreted under variable three phase conditions and validated measurement discipline, justify operational adjustment, capital reinforcement, or documented acceptance within defined thresholds.
Think you know Power Quality? Take our quick, interactive quiz and test your knowledge in minutes.
Advantages To Instructor-Led Training – Instructor-Led Course, Customized Training, Multiple Locations, Economical, CEU Credits, Course Discounts.
Request For QuotationWhether you would prefer Live Online or In-Person instruction, our electrical training courses can be tailored to meet your company's specific requirements and delivered to your employees in one location or at various locations.