Bangladesh Rooppur Nuclear Power Plant advances nuclear energy with IAEA support and ROSATOM construction, boosting energy security, baseload capacity, and grid reliability; 2400 MW units aid development, regulatory compliance, and newcomer infrastructure milestones.
Key Points
A 2400 MW nuclear project in Rooppur, built with IAEA guidance and ROSATOM, to boost Bangladesh's reliable power.
✅ Two units totaling 2400 MW for stable baseload supply
✅ IAEA Milestones and INIR reviews guide safe deployment
✅ ROSATOM builds; national regulator strengthens oversight
The beginning of construction at Bangladesh’s first nuclear power reactor on 30 November 2017 marked a significant milestone in the decade-long process to bring the benefits of nuclear energy to the world’s eighth most populous country. The IAEA has been supporting Bangladesh on its way to becoming the third ‘newcomer’ country to nuclear power in 30 years, following the United Arab Emirates in 2012 and Belarus in 2013.
Bangladesh is in the process of implementing an ambitious, multifaceted development programme to become a middle-income country by 2021 and a developed country by 2041. Vastly increased electricity production, with the goal of connecting 2.7 million more homes to the grid by 2021, is a cornerstone of this push for development, and nuclear energy will play a key role in this area, said Mohammad Shawkat Akbar, Managing Director of Nuclear Power Plant Company Bangladesh Limited. Bangladesh is also working to diversify its energy supply to enhance energy security, reduce its dependence on imports and on its limited domestic resources, he added.
#google# In the region, India's nuclear program is taking steps to get back on track, underscoring broader momentum.
“Bangladesh is introducing nuclear energy as a safe, environmentally friendly and economically viable source of electricity generation,” said Akbar. The plant in Rooppur, 160 kilometres north-west of Dhaka, will consist of two units, with a combined power capacity of 2400 MW(e). It is being built by a subsidiary of Russia’s State Atomic Energy Corporation ROSATOM. The first unit is scheduled to come online in 2023 and the second in 2024, reflecting progress similar to the UK's latest nuclear power station developments. “This project will enhance the development of the social, economic, scientific and technological potential of the country,” Akbar said.
The country’s goal of increased electricity production via nuclear energy will soon be a reality, Akbar said. “For 60 years, Bangladesh has had a dream of building its own nuclear power plant. The Rooppur Nuclear Power Plant will provide not only a stable baseload of electricity, but it will enhance our knowledge and allow us to increase our economic efficiency.
Milestones for nuclear
Bangladesh is among around 30 countries that are considering, planning or starting the introduction of nuclear power, with milestones at nuclear projects worldwide offering context for this progress. The IAEA assists them in developing their programmes through the Milestones Approach — a methodology that provides guidance on working towards the establishment of nuclear power in a newcomer country, including the associated infrastructure. It focuses on pointing out gaps, if any, in countries’ progress towards the introduction of nuclear power.
The IAEA has been supporting Bangladesh in developing its nuclear power infrastructure, including in establishing a regulatory framework and developing a radioactive waste-management system. This support has been delivered under the IAEA technical cooperation programme and is partially funded through the Peaceful Uses Initiative.
Nuclear infrastructure is multifaceted, containing governmental, legal, regulatory and managerial components, in addition to the physical infrastructure. The Milestones Approach consists of three phases, with a milestone to be reached at the end of each.
The first phase involves considerations before a decision is taken to start a nuclear power programme and concludes with the official commitment to the programme. The second phase entails preparatory work for the contracting and construction of a nuclear power plant, as seen in Bulgaria's nuclear project planning, ending with the commencement of bids or contract negotiations for the construction. The final phase includes activities to implement the nuclear power plant, such as the final investment decision, contracting and construction. The duration of these phases varies by country, but they typically take between 10 and 15 years.
“The IAEA Milestones Approach is a guiding document and the Integrated Work Plan (IWP) is the important means of bringing all of the stakeholders in Bangladesh together to ensure the fulfilment of all safety, security, and safeguards requirements of the Rooppur NPP project,” said Akbar. “This IWP enabled Bangladesh to develop a holistic approach to implementing IAEA guidance as well as cooperating with national stakeholders and other bilateral partners towards the development of a national nuclear power programme.”
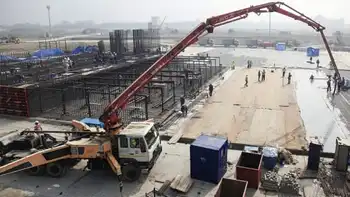
When completed, the two units of the Rooppur Nuclear Power Plant will have a combined power capacity of 2400 MW(e). (Photo: Arkady Sukhonin/Rosatom)
INIR Mission
The Integrated Nuclear Infrastructure Review (INIR) is a holistic peer review to assist Member States in assessing the status of their national infrastructure for introducing nuclear power. The IAEA completed its first INIR mission to Bangladesh in November 2011, making recommendations on how to develop a plan to establish the nuclear infrastructure. Nearly five years later, in May 2016, a follow-up mission was conducted, which noted the progress made — Bangladesh had established a nuclear regulatory body, had chosen a site for the power plant and had completed site characterization and environmental impact assessment.
“The IAEA and other bodies, including those from experienced countries, can and do provide support, but the responsibility for safety and security will lie with the Government,” said Dohee Hahn, Director of the IAEA’s Division of Nuclear Power, at the ceremony for the pouring of the first nuclear safety-related concrete at Rooppur on 30 November 2017. “The IAEA stands ready to continue supporting Bangladesh in developing a safe, secure, peaceful and sustainable nuclear power programme.”
Supporting Infrastructure for Introducing a Nuclear Power Plant in Bangladesh: the IAEA Assists with the Review of Regulatory Guidance on Site Evaluation
How the IAEA Assists Newcomer Countries in Building Their Way to Sustainable Energy
"Exciting times for nuclear power," IAEA Director General Says
Related News