Japan Electricity Crunch exposes vulnerabilities in a liberalised power market as LNG shortages, JEPX price spikes, snow-hit solar, and weak hedging strain energy security and retail providers amid cold snap demand and limited reserve capacity.
Key Points
A winter demand shock and LNG shortfalls sent JEPX to records, exposing gaps in hedging, data, and energy security.
✅ JEPX wholesale prices spiked to an all-time high
✅ LNG inventories and procurement proved insufficient
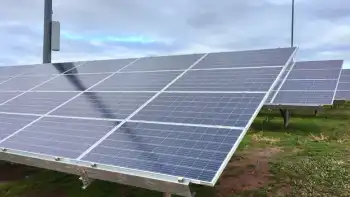
✅ Snow disabled solar; new entrants lacked hedging
Japan's worst electricity crunch since the aftermath of the Fukushima crisis has exposed vulnerabilities in the country's recently liberalised power market, although some of the problems appear self-inflicted.
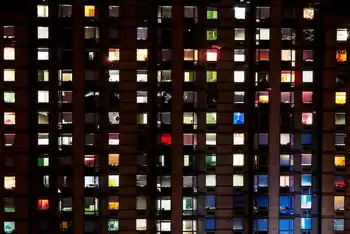
Power prices in Japan hit record highs last month, mirroring UK peak power prices during tight conditions, as a cold snap across northeast Asia prompted a scramble for supplies of liquefied natural gas (LNG), a major fuel for the country's power plants. Power companies urged customers to ration electricity to prevent blackouts, although no outages occurred.
The crisis highlighted how many providers were unprepared for such high demand. Experts say LNG stocks were not topped up ahead of winter and snow disabled solar power farms, while China's power woes strained solar supply chains.
The hundreds of small power companies that sprang up after the market was opened in 2016 have struggled the most, saying the government does not disclose the market data they need to operate. The companies do not have their own generators, instead buying electricity on the wholesale market.
Prices on the Japan Electric Power Exchange (JEPX) hit a record high of 251 yen ($2.39) per kilowatt hour in January, equating to $2,390 per megawatt hour of electricity, above record European price surges seen recently and the highest on record anywhere in the world. One megawatt hour is roughly what an average home in the U.S. would consume over 35 days.
But the vast majority of the new, smaller companies are locked into low, fixed rates they set to lure customers from bigger players, crushing them financially during a price spike like the one in January.
More than 50 small power providers wrote on Jan. 18 to Japan's industry minister, Hiroshi Kajiyama, who oversees the power sector, asking for more accessible data on supply and demand, reserve capacity and fuel inventories.
"By organising and disclosing this information, retail electricity providers will be able to bid at more appropriate prices," said the companies, led by Looop Co.
They also called on Kajiyama to require transmission and distribution companies to pass on some of the unexpected profits from price spikes to smaller operators.
The industry ministry said it had started releasing more timely market data, and is reviewing the cause of the crunch and considering changes, echoing calls by Fatih Birol to keep electricity options open amid uncertainty.
Japan reworked its power markets after the Fukushima nuclear disaster in 2011, liberalizing the sector in 2016 while pushing for more renewables.
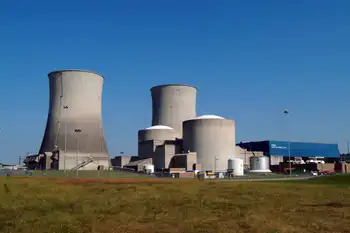
But Japan is still heavily reliant on LNG and coal, and only four of 33 nuclear reactors are operating. The power crisis has led to growing calls to restart more reactors.
Kazuno Power, a small retail provider controlled by a municipality of the same name in northern Japan, where abundant renewable energy is locally produced, buys electricity from hydropower stations and JEPX.
During the crunch, the company had to pay nearly 10 times the usual price, Kazuno Power president Takao Takeda said in an interview. Like most other new providers, it could not pass on the costs, lost money, and folded. The local utility has taken over its customers.
"There is a contradiction in the current system," Takeda said. "We are encouraged to locally produce power for local consumption as well as use more renewable energy, but prices for these power supplies are linked to wholesale prices, which depend on the overall power supply."
The big utilities, which receive most of their LNG on long-term contracts, blamed the power shortfall on a tight spot market and glitches at generation units.
"We were not able to buy as much supply as we wanted from the spot market because of higher demand from South Korea and China, where power cuts have tightened supply," Kazuhiro Ikebe, the head of the country's electricity federation, said recently.
Ikebe is also president of Kyushu Electric Power, which supplies the southern island of Kyushu.
Utilities took extreme measures - from burning polluting fuel oil in coal plants to scavenging the dregs from empty LNG tankers - to keep the grid from breaking down.
"There is too much dependence on JEPX for procurement," said Bob Takai, the local head of European Energy Exchange, where electricity pricing reforms are being discussed, and which started offering Japan power futures last year. He added that new entrants were not hedging against sharp price moves.
Three people, who requested anonymity because of the sensitivity of the matter, were more blunt. One called the utilities arrogant in assuming they could find LNG cargoes in a pinch. Prices were already rising as China snapped up supplies, the sources noted.
"You had volatility caused by people saying 'Oh, well, demand is going to be weak because of coronavirus impacts' and then saying 'we can rely more on solar than in the past,' but solar got snowed out," said a senior executive from one generator. "We have a problem of who is charge of energy security in Japan."
Inventories of LNG, generally about two weeks worth of supplies, were also not topped up enough to prepare for winter, a market analyst said.
The fallout from the crunch has become more apparent in recent days, with new power companies like Rakuten Inc suspending new sales and Tokyo Gas, along with traditional electricity utilities, issuing profit downgrades or withdrawing their forecasts.
Although prices have fallen sharply as temperatures warmed up slightly and more generation units have come back online, the power generator executive said, "we are not out of the woods yet."
Related News