Canada slow to turn to offshore wind

By Globe and Mail


Protective Relay Training - Basic

Our customized live online or in‑person group training can be delivered to your staff at your location.

  • Live Online
  • 12 hours Instructor-led
  • Group Training Available
Regular Price:
$699
Coupon Price:
$599
Reserve Your Seat Today
Canada has been slow to develop its great potential for offshore wind power, and is probably at least four years away from having any large scale projects up and running, a new report says.

The study, from Cambridge, Mass.-based Emerging Energy Research (EER), says Canada is far behind Europe, and slower than the United States, in building offshore wind farms.

"The birth of the Canadian offshore wind industry is years away, despite vast resource potential off the coast of British Columbia and in the Great Lakes off Ontario," the report said.

There are just two Canadian offshore projects likely to come to completion in the next few years.

One is NaiKun Wind Development Inc.'s huge wind farm in Hecate Straight, off Haida Gwaii in British Columbia. But the first phase of that project won't likely be completed until 2012, and only if the company secures a contract in B.C. Hydro's upcoming clean energy call.

The other is Trillium Power Wind Corp.'s offshore wind farm planned for the eastern end of Lake Ontario, which is at least three years away from the start of construction.

By contrast, several European countries - Denmark, Britain, the Netherlands and Sweden - have been actively building large offshore wind projects since the late 1990s, and many more are on the drawing board across Europe.

The United States is also ahead of Canada, although no offshore projects have been built there yet. The Cape Wind project off New England will likely be the first, but there will likely be a surge in development starting around 2011, EER projects.

The key difference between Canada and Europe is that there is still lots of potential for land-based wind projects here, said EER analyst Matt Kaplan.

Denmark and Britain, by contrast, "don't have that many onshore sites [left]," he said. "There aren't many options available for them ... so they've had to adopt the offshore technology much more quickly than the U.S. or Canada, where there is currently a huge potential for onshore sites."

Offshore wind farms also tend to be more expensive - partly because of the cost of linking them up to the power grid - so, given a choice, many developers will choose onshore sites if available.

In addition, some European governments pay more for wind power generated offshore, creating an additional incentive.

Finally, Europe has also had very stable and consistent government policies supporting wind power of all kinds, something that has not been the case in Canada or the United States, Mr. Kaplan said.

Indeed, Ontario had a moratorium on any offshore wind projects for more than a year, until it was lifted in January. The province wanted to study the potential environmental effects before letting any projects move ahead.

The biggest planned offshore project in Ontario is Trillium's, which would involve placing 140 large turbines about 17 to 20 kilometres offshore in Lake Ontario, to generate about 700 megawatts of power.

Trillium chief executive officer John Kourtoff said in an interview that offshore wind should expand sharply in Canada when people become familiar with the concept.

But the industry has to get out the message that projects a considerable distance from shore will have little impact on visual vistas, he said.

Offshore wind turbines tend to be more efficient than those on shore, he said, because the winds are more powerful and blow when electricity is needed during the daytime hours.

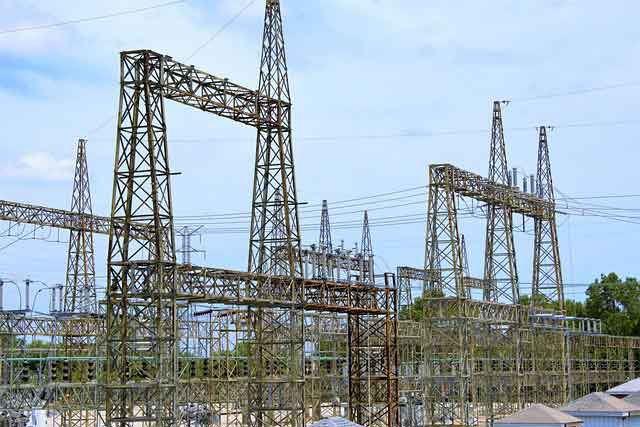
The biggest issue will be the cost of transmitting the power by cable to the power grid, he conceded.

NaiKun's West Coast wind farm could eventually generate as much as 1,750 MW of power. The first phase, with about 60 to 100 turbines producing about 320 MW, could be under construction by 2011 if the company wins a power contract with the B.C. government.

NaiKun chairman Michael Burns said one other reason Canada is behind Europe in its offshore wind development is that there are fewer good places to site large offshore turbines along the coast in Canada. North America tends to have steep coastlines, making construction more difficult than in the shallows off Europe.

Hecate Straight in B.C. is an exception, Mr. Burns said, and it is a potentially huge resource. The entire area has enough wind energy to replace all the hydro power in British Columbia, he said.

Related News

Attacks on power substations are growing. Why is the electric grid so hard to protect?

Power Grid Attacks surge across substations and transmission lines, straining critical infrastructure as DHS and FBI cite vandalism, domestic extremists, and cybersecurity risks impacting resilience, outages, and grid reliability nationwide.


Key Points

Power Grid Attacks are deliberate strikes on substations and lines to disrupt power and weaken grid reliability.

✅ Physical attacks rose across multiple states and utilities.

✅ DHS and FBI warn of threats to critical infrastructure.

✅ Substation security and grid resilience upgrades urged.


Even before Christmas Day attacks on power substations in five states in the Pacific Northwest and Southeast, similar incidents of attacks, vandalism and suspicious activity were on the rise.

Federal energy reports through August – the most recent available – show an increase in physical attacks at electrical facilities across the nation this year, continuing a trend seen since 2017.

At least 108 human-related events were reported during the first eight months of 2022, compared with 99 in all of 2021 and 97 in 2020. More than a dozen cases of vandalism have been reported since September.

The attacks have prompted a flurry of calls to better protect the nation's power grid, with a renewed focus on protecting the U.S. power grid across sectors, but experts have warned for more than three decades that stepped-up protection was needed.

Attacks on power stations on the rise 
Twice this year, the Department of Homeland Security warned "a heightened threat environment" remains for the nation, including its critical infrastructure amid reports of suspected Russian breaches of power plant systems. 

At least 20 actual physical attacks were reported, compared with six in all of 2021. 
Suspicious-activity reports jumped three years ago, nearly doubling in 2020 to 32 events. In the first eight months of this year, 34 suspicious incidents were reported.
Total human-related incidents – including vandalism, suspicious activity and cyber events such as Russian hackers and U.S. utilities in recent years – are on track to be the highest since the reports started showing such activity in 2011.


Attacks reported in at least 5 states
Since September, attacks or potential attacks have been reported on at least 18 additional substations and one power plant in Florida, Oregon, Washington and the Carolinas. Several involved firearms.

  • In Florida: Six "intrusion events" occurred at Duke Energy substations in September, resulting in at least one brief power outage, according to the News Nation television network, which cited a report the utility sent to the Energy Department. Duke Energy spokesperson Ana Gibbs confirmed a related arrest, but the company declined to comment further.
  • In Oregon and Washington state: Substations were attacked at least six times in November and December, with firearms used in some cases, local news outlets reported. On Christmas Day, four additional substations were vandalized in Washington State, cutting power to more than 14,000 customers.
  • In North Carolina: A substation in Maysville was vandalized on Nov. 11. On Dec. 3, shootings that authorities called a "targeted attack" damaged two power substations in Moore County, leaving tens of thousands without power amid freezing temperatures.
  • In South Carolina: Days later, gunfire was reported near a hydropower plant, but police said the shooting was a "random act."

It's not yet clear whether any of the attacks were coordinated. After the North Carolina attacks, a coordinating council between the electric power industry and the federal government ordered a security evaluation.


FBI mum on its investigations
The FBI is looking into some of the attacks, including cyber intrusions where hackers accessed control rooms in past cases, but it hasn't said how many it's investigating or where. 

Shelley Lynch, a spokesperson for the FBI's Charlotte field office, confirmed the bureau was investigating the North Carolina attack. The Kershaw County Sheriff's Office reported the FBI was looking into the South Carolina incident.

Utilities in Oregon and Washington told news outlets they were cooperating with the FBI, but spokespeople for the agency's Seattle and Portland field offices said they couldn't confirm or deny an investigation.

Could domestic extremists be involved?
In January, the Department of Homeland Security said domestic extremists had been developing "credible, specific plans" since at least 2020, including a Neo-Nazi plot against power stations detailed in a federal complaint, and would continue to "encourage physical attacks against electrical infrastructure."

In February, three men who ascribed to white supremacy and Neo-Nazism pleaded guilty to federal crimes related to a scheme to attack the grid with rifles.

In a news release, Timothy Langan, assistant director of the FBI’s Counterterrorism Division, said the defendants "wanted to attack regional power substations and expected the damage would lead to economic distress and civil unrest."


Why is the power grid so hard to protect?
Industry experts, federal officials and others have warned in one report after another since at least 1990 that the power grid was at risk, and a recent grid vulnerability report card highlights dangerous weak points, said Granger Morgan, an engineering professor at Carnegie Mellon University who chaired three National Academies of Sciences reports.

The reports urged state and federal agencies to collaborate to make the system more resilient to attacks and natural disasters such as hurricanes and storms. 

"The system is inherently vulnerable, with the U.S. grid experiencing more blackouts than other developed nations in one study. It's spread all across the countryside," which makes the lines and substations easy targets, Morgan said. The grid includes more than 7,300 power plants, 160,000 miles of high-voltage power lines and 55,000 transmission substations.

One challenge is that there's no single entity whose responsibilities span the entire system, Morgan said. And the risks are only increasing as the grid expands to include renewable energy sources such as solar and wind, he said. 


Related News

View more

The Netherlands Outpaces Canada in Solar Power Generation

Netherlands vs Canada Solar Power compares per capita capacity, renewable energy policies, photovoltaics adoption, rooftop installations, grid integration, and incentives like feed-in tariffs and BIPV, highlighting efficiency, costs, and public engagement.


Key Points

Concise comparison of per capita capacity, policies, technology, and engagement in Dutch and Canadian solar adoption.

✅ Dutch per capita PV capacity exceeds Canada's by wide margin.

✅ Strong incentives: net metering, feed-in tariffs, rooftop focus.

✅ Climate, grid density, and awareness drive higher yields.


When it comes to harnessing solar power, the Netherlands stands as a shining example of efficient and widespread adoption, far surpassing Canada in solar energy generation per capita. Despite Canada's vast landmass and abundance of sunlight, the Netherlands has managed to outpace its North American counterpart, which some experts call a solar power laggard in solar energy production. This article explores the factors behind the Netherlands' success in solar power generation and compares it to Canada's approach.

Solar Power Capacity and Policy Support

The Netherlands has rapidly expanded its solar power capacity in recent years, driven by a combination of favorable policies, technological advancements, and public support. According to recent data, the Netherlands boasts a significantly higher per capita solar power capacity compared to Canada, where demand for solar electricity lags relative to deployment in many regions, leveraging its smaller geographical size and dense population centers to maximize solar panel installations on rooftops and in urban areas.

In contrast, Canada's solar energy development has been slower, despite having vast areas of suitable land for solar farms. Challenges such as regulatory hurdles, varying provincial policies, and the high initial costs of solar installations have contributed to a more gradual adoption of solar power across the country. However, provinces like Ontario have seen significant growth in solar installations due to supportive government incentives and favorable feed-in tariff programs, though growth projections were scaled back after Ontario scrapped a key program.

Innovation and Technological Advancements

The Netherlands has also benefited from ongoing innovations in solar technology and efficiency improvements. Dutch companies and research institutions have been at the forefront of developing new solar panel technologies, improving efficiency rates, and exploring innovative applications such as building-integrated photovoltaics (BIPV). These advancements have helped drive down the cost of solar energy and increase its competitiveness with traditional fossil fuels.

In contrast, while Canada has made strides in solar technology research and development, commercialization and widespread adoption have been more restrained due to factors like market fragmentation and the country's reliance on other energy sources such as hydroelectricity.

Public Awareness and Community Engagement

Public awareness and community engagement play a crucial role in the Netherlands' success in solar power adoption. The Dutch government has actively promoted renewable energy through public campaigns, educational programs, and financial incentives for homeowners and businesses to install solar panels. This proactive approach has fostered a culture of energy conservation and sustainability among the Dutch population.

In Canada, while there is growing public support for renewable energy, varying levels of awareness and engagement across different provinces have impacted the pace of solar energy adoption. Provinces like British Columbia and Alberta have seen increasing interest in solar power, driven by environmental concerns, technological advancements, and economic benefits, as the country is set to hit 5 GW of installed capacity in the near term.

Climate and Geographic Considerations

Climate and geographic considerations also influence the disparity in solar power generation between the Netherlands and Canada. The Netherlands, despite its northern latitude, benefits from relatively mild winters and a higher average annual sunlight exposure compared to most regions of Canada. This favorable climate has facilitated higher solar energy yields and made solar power a more viable option for electricity generation.

In contrast, Canada's diverse climate and geography present unique challenges for solar energy deployment. Northern regions experience extended periods of darkness during winter months, limiting the effectiveness of solar panels in those areas. Despite these challenges, advancements in energy storage technologies and hybrid solar-diesel systems are making solar power increasingly feasible in remote and off-grid communities across Canada, even as Alberta faces expansion challenges related to grid integration and policy.

Future Prospects and Challenges

Looking ahead, both the Netherlands and Canada face opportunities and challenges in expanding their respective solar power capacities. In the Netherlands, continued investments in solar technology, grid infrastructure upgrades, and policy support will be crucial for maintaining momentum in renewable energy development.

In Canada, enhancing regulatory consistency, scaling up solar installations in urban and rural areas, and leveraging emerging technologies will be essential for narrowing the gap with global leaders in solar energy generation and for seizing opportunities in the global electricity market as the energy transition accelerates.

In conclusion, while the Netherlands currently generates more solar power per capita than Canada, with the Prairie Provinces poised to lead growth in the Canadian market, both countries have unique strengths and challenges in their pursuit of a sustainable energy future. By learning from each other's successes and leveraging technological advancements, both nations can further accelerate the adoption of solar power and contribute to global efforts to combat climate change.


Related News

View more

OpenAI Expands Washington Effort to Shape AI Policy

OpenAI Washington Policy Expansion spotlights AI policy, energy infrastructure, data centers, and national security, advocating AI economic zones and a national transmission grid to advance U.S. competitiveness and align with pro-tech administration priorities.


Key Points

OpenAI's D.C. push to scale policy outreach and AI infrastructure across energy, data centers, and national security.

✅ Triples D.C. policy team to expand bipartisan engagement

✅ Advocates AI economic zones and transmission grid build-out

✅ Aligns with pro-tech leadership, prioritizing national security


OpenAI, the creator of ChatGPT, is significantly expanding its presence in Washington, D.C., aiming to influence policy decisions that will shape the future of artificial intelligence (AI) and its integration into critical sectors like energy and national security. This strategic move comes as the company seeks to position itself as a key player in the U.S. economic and security landscape, particularly in the context of global competition with China in strategic industries.

Expansion of Policy Team

To enhance its influence, OpenAI is tripling the size of its Washington policy team. While the 12-person team is still smaller compared to tech giants like Amazon and Meta, it reflects OpenAI's commitment to engaging more actively with policymakers, as debates over Biden's climate law shape the regulatory landscape. The company has recruited individuals from across the political spectrum, including former aides to President Bill Clinton and Vice President Al Gore, to ensure a diverse and comprehensive approach to policy advocacy.

Strategic Initiatives

OpenAI is promoting an ambitious plan to develop tech and energy infrastructure tailored for AI development. This initiative aims to deliver more affordable energy to data centers and reduce corporate electricity bills, which are essential for AI operations. The company is advocating for the establishment of AI economic zones and a national transmission highway to support the growing energy demands of AI technologies. By aligning these proposals with the incoming Trump administration's pro-tech stance, OpenAI seeks to secure federal support for its projects.

Engagement with the Trump Administration

The transition from the Biden administration to the incoming Trump administration presents new opportunities for OpenAI, even as state legal challenges shape early energy policy moves. The Trump administration is perceived as more favorable toward the tech industry, with appointments of Silicon Valley figures like Elon Musk and David Sacks to key positions. OpenAI is leveraging this environment to advocate for policies that support AI development and infrastructure expansion, positioning itself as a strategic asset in the U.S.-China economic and security competition.

The AI industry is increasingly viewed as a critical component of national security and economic competitiveness. OpenAI's efforts to engage with policymakers reflect a broader industry push to be recognized as a vital player in the U.S. economic and security landscape. By promoting AI as a strategic asset, OpenAI aims to secure support for its initiatives, including clean-energy projects in coal communities, and ensure that the U.S. remains at the forefront of AI innovation.

OpenAI's strategic expansion in Washington, D.C., underscores its commitment to influencing policy decisions that will shape the future of AI and its integration into critical sectors. By enhancing its policy team, advocating for infrastructure development, where Alberta's data center boom illustrates rising demand, and aligning with the incoming administration's priorities, even as energy dominance goals face real-world constraints, OpenAI aims to position itself as a key player in the evolving landscape of artificial intelligence. This proactive approach reflects the company's recognition of the importance of policy engagement in driving innovation and securing a competitive edge in the global AI arena.


Related News

View more

Power Demand Seen Holding Firm In Europe’s Latest Lockdown

European Power Demand During Second Lockdowns remains resilient as winter heating offsets commercial losses; electricity consumption tracks seasonal norms, with weather sensitivity, industrial activity, natural gas shielding, and coal decline shaping dynamics under COVID-19 restrictions.


Key Points

It is expected to remain near seasonal norms, driven by heating, industry activity, and weather sensitive consumption.

✅ Winter heating offsets retail and hospitality closures

✅ Demand sensitivity rises with colder weather in France

✅ Gas generation shielded; coal likely to curtail first


European power demand is likely to hold up in the second round of national lockdown restrictions, with fluctuations most likely driven by changes in the weather.

Traders and analysts expect normal consumption this time around as home heating during the chilly season replaces commercial demand.

Last week electricity consumption in France, Germany and the U.K. was close to business-as-usual levels for the time of year, according to BloombergNEF data. By contrast, power demand had dropped 16% in the first seven days of the springtime lockdown, as reflected by the U.K.’s 10% daily decline reported then.

How power demand performs has significance outside the sector. It’s often seen as a proxy for economic growth and during lockdowns earlier this year, electricity use slumped along with GDP, and stunted hydro and nuclear output could further hobble recovery. For Western Europe, annual demand is expected to be 5% lower than the previous year, a bigger decline than after the global financial crisis in 2008, according to S&P Global Platts.

The Covid-19 limits are lighter than those from earlier in the year “with an explicit drive to preserve economic activity, particularly at the more energy-intensive industrial end of the spectrum,” said Glenn Rickson, head of European power analysis at S&P Global Platts.

Higher levels of working from home will offset some of the losses from shop and hospitality closures, “but also increase the temperature sensitivity of overall gas and power demand, as heat-driven demand records have shown in recent summers,” he said.

The latest wave of national lockdowns began in France, Germany, Spain, Italy and Britain, with Spain having seen April demand plummet earlier in the year, as coronavirus cases surged and officials struggled to keep the spread of the virus under control.

Much of the manufacturing industry remains working for now despite additional restrictions to contain the coronavirus. With the peak of the second wave yet to be reached, “it seems almost inevitable that the fourth quarter will prove economically challenging,” analysts at Alfa Energy said.

There will initially be significantly less of an impact on demand compared with this spring when global daily demand dipped about 15% and electricity consumption in Europe was down 30%, Johan Sigvardsson, power price analyst at Swedish utility Bixia AB said.

The prevalence of electric heating systems in France means that power demand is particularly sensitive to cold weather. A cold spell would significantly boost demand and drive record electricity prices in tight markets.

Similar to the last round of shutdowns, it’s use of coal that will probably be hit first if power demand sags, as transition-focused responses gather pace, leaving natural gas mostly shielded from fluctuations in the market.

“We expect that another drop in power demand would again impact coal-fired generation and shield gas power to some extent,” said Carlos Torres Diaz, an analyst at Rystad Energy.


Related News

View more

Emissions rise 2% in Australia amid increased pollution from electricity and transport

Australia's greenhouse gas emissions rose in Q2 as electricity and transport pollution increased, despite renewable energy growth. Net zero targets, carbon dioxide equivalent metrics, and land use changes underscore mixed trends in decarbonisation.


Key Points

About 499-500 Mt CO2-e annually, with a 2% quarterly rise led by electricity and transport.

✅ Q2 emissions rose to 127 Mt from 124.4 Mt seasonally adjusted

✅ Electricity sector up to 41.6 Mt; transport added nearly 1 Mt

✅ Land use remains a net sink; renewables expanded capacity


Australia’s greenhouse gas emissions rose in the June quarter by about 2% as pollution from the electricity sector and transport increased.

Figures released on Tuesday by the Morrison government showed that on a year to year basis, emissions for the 12 months to last June totalled 498.9m tonnes of carbon dioxide equivalent. That tally was down 2.1%, or 10.8m tonnes compared with the same period a year earlier.

However, on a seasonally adjusted quarterly basis, emissions increased to 127m tonnes, or just over 2%, from the 124.4m tonnes reported in the March quarter. For the year to March, emissions totalled 494.2m tonnes, underscoring the pickup in pollution in the more recent quarter even as global coal power declines worldwide.

A stable pollution rate, if not a rising one, is also implied by the government’s release of preliminary figures for the September quarter. They point to 125m tonnes of emissions in trend terms for the July-September months, bringing the year to September total to about 500m tonnes, the latest report said.

The government has made much of Australia “meeting and beating” climate targets. However, the latest statistics show mostly emissions are not in decline despite its pledge ahead of the Glasgow climate summit that the country would hit net zero by 2050, and AEMO says supply can remain uninterrupted as coal phases out over the next three decades.

“Nothing’s happening except for the electricity sector,” said Hugh Saddler, an honorary associate professor at the Australian National University. Once Covid curbs on the economy eased, such as during the current quarter, emission sources such as from transport will show a rise, he predicted.

Falling costs for new wind and solar farms, with the IEA naming solar the cheapest in history worldwide, are pushing coal and gas out of electricity generation, as well as pushing down power prices. In seasonally adjusted terms, though, emissions for that sector rose from 39.7m tonnes the March quarter to 41.6m in the June one.

Most other sectors were steady, with pollution from transport adding almost 1m tonnes in the June quarter.

On an annual basis, a 500m tonnes tally is the lowest since records began in the 1990s, and IEA reported global emissions flatlined in 2019 for context. That lower trajectory, though, is lower due much to the land sector remaining a net sink even as some experts raise questions about the true trends when it comes to land clearing.

According to the government, this sector – known as land use, land-use change and forestry – amounted to a net reduction of emissions of 24.4m tonnes, or almost negative 5% of the national total, in the year to June.

Sign up to receive an email with the top stories from Guardian Australia every morning

“The magnitude of this net sink has decreased by 0.6% (0.2 Mt CO2-e) on the previous 12 months due to an increase in emissions from agricultural soils, partially offset by a continuing decline in land clearing emissions,” the latest report said.

For its part, the government also touted the increase of renewable energy, as seen in Canada's electricity progress too, as central to driving emissions lower.

“Since 2017, Australia’s consumption of renewable energy has grown at a compound annual rate of 4.6%, with more than $40bn invested in Australia’s renewable energy sector,” Angus Taylor, the federal energy minister said, while UK net zero policy changes show a different approach. “Last year, Australia deployed new solar and wind at eight times the global per capita average.”

ANU’s Saddler said the main driver had been the 2020 Renewable Energy Target that the Coalition government had cut, and had anyway been implemented “a very considerable time ago”.

Tim Baxter, the Climate Council’s senior researcher, said “the time for leaning on the achievements of others is long since past”.

“We need a federal government willing to step up on emissions reductions and take charge with real policy, not wishlists,” he said, referring to the government’s net zero plan to rely on technologies to cut pollution in pursuit of a sustainable electric planet in practice, some of which don’t exist now.


Related News

View more

Most Energy Will Come From Fossil Fuels, Even In 2040

2040 Energy Outlook projects a shifting energy mix as renewables scale, EV adoption accelerates, and IEA forecasts plateauing oil demand alongside rising natural gas, highlighting policy, efficiency, and decarbonization trends that shape global consumption.


Key Points

A data-driven view of future energy mix, covering renewables, fossil fuels, EVs, oil demand, and policy impacts.

✅ Renewables reach 16-30% by 2040, higher with strong policy support.

✅ Fossil fuels remain dominant, with oil flat and natural gas rising.

✅ EV share surges, cutting oil use; efficiency curbs demand growth.


Which is more plausible: flying taxis, wind turbine arrays stretching miles into the ocean, and a solar roof on every house--or a scorched-earth, flooded post-Apocalyptic world? 

We have no way of peeking into the future, but we can certainly imagine it. There is plenty of information about where the world is headed and regardless of how reliable this information is—or isn’t—we never stop wondering. Will the energy world of 20 years from now be better or worse than the world we live in now? 

The answer may very well lie in the observable trends.


A Growing Population

The global population is growing, and it will continue to grow in the next two decades. This will drive a steady growth in energy demand, at about 1 percent per year, according to the International Energy Agency.

This modest rate of growth is good news for all who are concerned about the future of the planet. Parts of the world are trying to reduce their energy consumption, and this should have a positive effect on the carbon footprint of humanity. The energy thirst of most parts of the world will continue growing, however, hence the overall growth.

The world’s population is currently growing at a rate of a little over 1 percent annually. This rate of growth has been slowing since its peak in the 1960s and forecasts suggest that it will continue to slow. Growth in energy demand, on the other hand, may at some point stop moving in tune with population growth trends as affluence in some parts of the world grows. The richer people get, the more energy they need. So, to the big question: where will this energy come from?


The Rise of Renewables

For all the headline space they have been claiming, it may come as a disappointing surprise to many that renewable energy, excluding hydropower, to date accounts for just 14 percent of the global primary energy mix. 

Certainly, adoption of solar and wind energy has been growing in leaps and bounds, with their global share doubling in five years in many markets, but unless governments around the world commit a lot more money and effort to renewable energy, by 2040, solar and wind’s share in the energy mix will still only rise to about 16 to 17 percent. That’s according to the only comprehensive report on the future of energy that collates data from all the leading energy authorities in the world, by non-profit Resources for the Future.

The growth in renewables adoption, however, would be a lot more impressive if governments do make serious commitments. Under that scenario, the share of renewables will double to over 30 percent by 2040, echoing milestones like over 30% of global electricity reached recently: that’s the median rate of all authoritative forecasts. Amongst them, the adoption rates of renewables vary between 15 percent and 61 percent by 2040.

Even the most bullish of the forecasts on renewables is still far below the 100-percent renewable future many would like to fantasize about, although BNEF’s 50% by 2050 outlook points to what could be possible in the power sector. 

But in 2040, most of the world’s energy will still come from fossil fuels.


EV Energy

Here, forecasters are more optimistic. Again, there is a wide variation between forecasts, but in each and every one of them the share of electric vehicles on the world’s roads in 2040 is a lot higher than the meagre 1 percent of the global car fleet EVs constitute today.
Related: Gas Prices Languish As Storage Falls To Near-Record Lows

Government policy will be the key, as U.S. progress toward 30% wind and solar shows how policy steers the power mix that EVs ultimately depend on. Bans of internal combustion engines will go a long way toward boosting EV adoption, which is why some forecasters expect electric cars to come to account for more than 50 percent of cars on the road in 2040. Others, however, are more guarded in their forecasts, seeing their share of the global fleet at between 16 percent and a little over 40 percent.

Many pin their hopes for a less emission-intensive future on electric cars. Indeed, as the number of EVs rises, they displace ICE vehicles and, respectively, the emission-causing oil that fuels for ICE cars are made from.  It should be a no brainer that the more EVs we drive, the less emissions we produce. Unfortunately, this is not necessarily the case: China is the world’s biggest EV market, and its solar PV expansion has been rapid, it has the most EVs—including passenger cars and buses—but it is also one of the biggest emitters.

Still, by 2040, if the more optimistic forecasts come true, the world will be consuming less oil than it is consuming now: anywhere from 1.2 million bpd to 20 million bpd less, the latter case envisaging an all-electric global fleet in 2040. 


This Ain’t Your Daddy’s Oil

No, it ain’t. It’s your grandchildren’s oil, for good or for bad. The vision of an oil-free world where renewable power is both abundant and cheap enough to replace all the ways in which crude oil and natural gas are used will in 2040 still be just that--a vision, with practical U.S. grid constraints underscoring the challenges. Even the most optimistic energy scenarios for two decades from now see them as the dominant source of energy, with forecasts ranging between 60 percent and 79 percent. While these extremes are both below the over-80 percent share fossil fuels have in the world’s energy mix, they are well above 50 percent, and in the U.S. renewables are projected to reach about one-fourth of electricity soon, even as fossil fuels remain foundational.

Still, there is good news. Fuel efficiency alone will reduce oil demand significantly by 2040. In fact, according to the IEA, demand will plateau at a little over 100 million bpd by the mid-2030s. Combined with the influx of EVs many expect, the world of 20 years from now may indeed be consuming a lot less oil than the world of today. It will, however, likely consume a lot more natural gas. There is simply no way around fossil fuels, not yet. Unless a miracle of politics happens (complete with a ripple effect that will cost millions of people their jobs) in 2040 we will be as dependent on oil and gas as we are but we will hopefully breathe cleaner air.

By Irina Slav for Oilprice.com


Related News

View more

Sign Up for Electricity Forum’s Newsletter

Stay informed with our FREE Newsletter — get the latest news, breakthrough technologies, and expert insights, delivered straight to your inbox.

Electricity Today T&D Magazine Subscribe for FREE

Stay informed with the latest T&D policies and technologies.
  • Timely insights from industry experts
  • Practical solutions T&D engineers
  • Free access to every issue

Live Online & In-person Group Training

Advantages To Instructor-Led Training – Instructor-Led Course, Customized Training, Multiple Locations, Economical, CEU Credits, Course Discounts.

Request For Quotation

Whether you would prefer Live Online or In-Person instruction, our electrical training courses can be tailored to meet your company's specific requirements and delivered to your employees in one location or at various locations.