WWF blasts windfalls for EU coal-burners

By Reuters


Electrical Testing & Commissioning of Power Systems

Our customized live online or in‑person group training can be delivered to your staff at your location.

  • Live Online
  • 12 hours Instructor-led
  • Group Training Available
Regular Price:
$599
Coupon Price:
$499
Reserve Your Seat Today
EU plans for curbing emissions will hand utilities windfall profits of up to 71 billion euros ($111.5 billion) between 2008 and 2012 even as they burn highly polluting coal, environmental group WWF said.

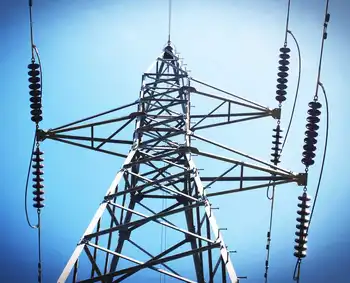
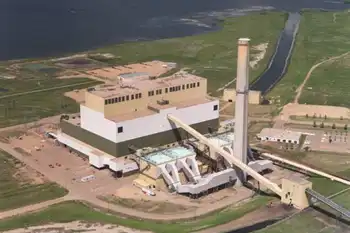
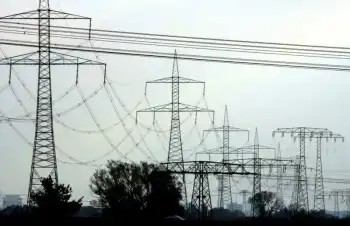
Power companies in five European Union countries - Britain, Germany, Spain, Italy and Poland, which are among the biggest coal burners - stand to earn windfalls totaling between 23 and 71 billion euros during the second phase of the bloc's Emissions Trading Scheme, WWF said.

WWF said it was vital, in the subsequent phase of the ETS starting in 2013, that the EU stick to plans to sell emission permits, rather than continue to give them out free, eliminating such profits.

"We are shocked that we still have power generators claiming they are cleaning up their act but are still building nonsensical, coal-fired plants," said Sanjeev Kumar, the WWF's ETS coordinator.

"Cheap profits for doing nothing is scandalous," Kumar said. "The question now is how are these windfall profits going to be used? Are they going to give them straight to shareholders or are they going to invest them in carbon capture and storage or renewable technologies?"

About one fifth of the EU's greenhouse gas emissions comes from burning coal to generate electricity and that proportion is set to rise as new coal-fired power stations are built, WWF said in a report.

Under the ETS - the cornerstone of the EU's plans to fight climate change - European governments currently give allowances to many companies that emit greenhouse gases.

Auctioning is set to become more common for power firms in some EU countries in 2008-2012, Kumar said.

The EU's executive Commission has proposed that from 2013, all permits for the power sector should be auctioned, meaning no more windfall profits for the industry.

But Brussels is under pressure from some EU states not to penalize European industry from 2013 if other countries around the world do not sign up to comparable emissions curbs.

The WWF commissioned Point Carbon, a provider of information and analysis on carbon markets, to draw up its report.

The range for windfall profits was based on allowances priced at between 21 and 32 euros per tonne of carbon dioxide and a range of other assumptions, the report said.

Related News

TCA Electric Leads Hydrogen Crane Project at Vancouver Port

Hydrogen Fuel Cell Crane Port of Vancouver showcases zero-emission RTG technology by DP World, TCA Electric, and partners, using hydrogen-electric fuel cells, battery energy storage, and regenerative capture to decarbonize container handling operations.


Key Points

A retrofitted RTG crane powered by hydrogen fuel cells, batteries, and regeneration to cut diesel use and CO2 emissions.

✅ Dual fuel cell system charges high-voltage battery

✅ Regenerative capture reduces energy demand and cost

✅ Pilot targets zero-emission RTG fleets by 2040


In a groundbreaking move toward sustainable logistics, TCA Electric, a Chilliwack-based industrial electrical contractor, is at the forefront of a pioneering hydrogen fuel cell crane project at the Port of Vancouver. This initiative, led by DP World in collaboration with TCA Electric and other partners, marks a significant step in decarbonizing port operations and showcases the potential of hydrogen technology in heavy-duty industrial applications.

A Vision for Zero-Emission Ports

The Port of Vancouver, Canada's largest port, has long been a hub for international trade. However, its operations have also contributed to substantial greenhouse gas emissions, even as DP World advances an all-electric berth in the U.K., primarily from diesel-powered Rubber-Tired Gantry (RTG) cranes. These cranes are essential for container handling but are significant sources of CO₂ emissions. At DP World’s Vancouver terminal, 19 RTG cranes account for 50% of diesel consumption and generate over 4,200 tonnes of CO₂ annually. 

To address this, the Vancouver Fraser Port Authority and the Province of British Columbia have committed to transforming the port into a zero-emission facility by 2050, supported by provincial hydrogen investments that accelerate clean energy infrastructure across B.C. This ambitious goal has spurred several innovative projects, including the hydrogen fuel cell crane pilot. 

TCA Electric’s Role in the Hydrogen Revolution

TCA Electric's involvement in this project underscores its expertise in industrial electrification and commitment to sustainable energy solutions. The company has been instrumental in designing and implementing the electrical systems that power the hydrogen fuel cell crane. This includes integrating the Hydrogen-Electric Generator (HEG), battery energy storage system, and regenerative energy capture technologies. The crane operates using compressed gaseous hydrogen stored in 15 pressurized tanks, which feed a dual fuel cell system developed by TYCROP Manufacturing and H2 Portable. This system charges a high-voltage battery that powers the crane's electric drive, significantly reducing its carbon footprint. 

The collaboration between TCA Electric, TYCROP, H2 Portable, and HTEC represents a convergence of local expertise and innovation. These companies, all based in British Columbia, have leveraged their collective knowledge to develop a world-first solution in the industrial sector, while regional pioneers like Harbour Air's electric aircraft illustrate parallel progress in aviation. TCA Electric's leadership in this project highlights its role as a key enabler of the province's clean energy transition. 

Demonstrating Real-World Impact

The pilot project began in October 2023 with the retrofitting of a diesel-powered RTG crane. The first phase included integrating the hydrogen-electric system, followed by a one-year field trial to assess performance metrics such as hydrogen consumption, energy generation, and regenerative energy capture rates. Early results have been promising, with the crane operating efficiently and emitting only steam, compared to the 400 kilograms of CO₂ produced by a comparable diesel unit. 

If successful, this project could serve as a model for decarbonizing port operations worldwide, mirroring investments in electric trucks at California ports that target landside emissions. DP World plans to consider converting its fleet of RTG cranes in Vancouver and Prince Rupert to hydrogen power, aligning with its global commitment to achieve carbon neutrality by 2040.

Broader Implications for the Industry

The success of the hydrogen fuel cell crane pilot at the Port of Vancouver has broader implications for the shipping and logistics industry. It demonstrates the feasibility of transitioning from diesel to hydrogen-powered equipment in challenging environments, and aligns with advances in electric ships on the B.C. coast. The project's success could accelerate the adoption of hydrogen technology in other ports and industries, contributing to global efforts to reduce carbon emissions and combat climate change.

Moreover, the collaboration between public and private sectors in this initiative sets a precedent for future partnerships aimed at advancing clean energy solutions. The support from the Province of British Columbia, coupled with the expertise of companies like TCA Electric and utility initiatives such as BC Hydro's vehicle-to-grid pilot underscore the importance of coordinated efforts in achieving sustainability goals.

Looking Ahead

As the field trial progresses, stakeholders are closely monitoring the performance of the hydrogen fuel cell crane. The data collected will inform decisions on scaling the technology and integrating it into broader port operations. The success of this project could pave the way for similar initiatives in other regions, complementing the province's move to electric ferries with CIB support, promoting the widespread adoption of hydrogen as a clean energy source in industrial applications.

TCA Electric's leadership in this project exemplifies the critical role of skilled industrial electricians in driving the transition to sustainable energy solutions. Their expertise ensures the safe and efficient implementation of complex systems, making them indispensable partners in the journey toward a zero-emission future.

The hydrogen fuel cell crane pilot at the Port of Vancouver represents a significant milestone in the decarbonization of port operations. Through innovative partnerships and local expertise, this project is setting the stage for a cleaner, more sustainable future in global trade and logistics.


Related News

View more

India is now the world’s third-largest electricity producer

India Electricity Production 2017 surged to 1,160 BU, ranking third globally; rising TWh output with 334 GW capacity, strong renewables and thermal mix, 7% CAGR in generation, and growing demand, investments, and FDI inflows.


Key Points

India's 2017 power output reached 1,160 BU, third globally, supported by 334 GW capacity, rising renewables, and 7% CAGR.

✅ 1,160 BU generated; third after China and the US

✅ Installed capacity 334 GW; 65% thermal, rising renewables

✅ Generation CAGR ~7%; demand, FDI, investments rising


India now generates around 1,160.1 billion units of electricity in financial year 2017, up 4.72% from the previous year, and amid surging global electricity demand that is straining power systems. The country is behind only China which produced 6,015 terrawatt hours (TWh. 1 TW = 1,000,000 megawatts) and the US (4,327 TWh), and is ahead of Russia, Japan, Germany, and Canada.


India’s electricity production grew 34% over seven years to 2017, and the country now produces more energy than Japan and Russia, which had 27% and 8.77% more electricity generation capacity installed, respectively, than India seven years ago.

India produced 1,160.10 billion units (BU) of electricity–one BU is enough to power 10 million households (one household using average of about 3 units per day) for a month–in financial year (FY) 2017. Electricity production stood at 1,003.525 BU between April 2017-January 2018, according to a February 2018 report by India Brand Equity Foundation (IBEF), a trust established by the commerce ministry.

#google#

With a production of 1,423 BU in FY 2016, India was the third largest producer and the third largest consumer of electricity in the world, behind China (6,015 BU) and the United States (4,327 BU).

With an annual growth rate of 22.6% capacity addition over a decade to FY 2017, renewables beat other power sources–thermal, hydro and nuclear. Renewables, however, made up only 18.79% of India’s energy, up 68.65% since 2007, and globally, low-emissions sources are expected to cover most demand growth in the coming years. About 65% of installed capacity continues to be thermal.

As of January 2018, India has installed power capacity of 334.4 gigawatt (GW), making it the fifth largest installed capacity in the world after European Union, China, United States and Japan, and with much of the fleet coal-based, imported coal volumes have risen at times amid domestic supply constraints.

The government is targeting capacity addition of around 100 GW–the current power production of United Kingdom–by 2022, as per the IBEF report.


Electricity generation grew at 7% annually

India achieved a 34.48% growth in electricity production by producing 1,160.10 BU in 2017 compared to 771.60 BU in 2010–meaning that in these seven years, electricity production in India grew at a compound annual growth rate (CAGR) of 7.03%, while thermal power plants' PLF has risen recently amid higher demand and lower hydro.


Generation capacity grew at 10% annually

Of 334.5 GW installed capacity as of January 2018–up 60% from 132.30 GW in 2007–thermal installed capacity was 219.81 GW. Hydro and renewable energy installed capacity totaled 44.96 GW and 62.85 GW, respectively, said the report.

The CAGR in installed capacity over a decade to 2017 was 10.57% for thermal power, 22.06% for renewable energy–the fastest among all sources of power–2.51% for hydro power and 5.68% for nuclear power.


Growing demand, higher investments will drive future growth

Growing population and increasing penetration of electricity connections, along with increasing per-capita usage would provide further impetus to the power sector, said the report.

Power consumption is estimated to increase from 1,160.1 BU in 2016 to 1,894.7 BU in 2022, as per the report, though electricity demand fell sharply in one recent period.

Increasing investment remained one of the driving factors of power sector growth in the country.

Power sector has a 100% foreign direct investment (FDI) permit, which boosted FDI inflows in the sector.

Total FDI inflows in the power sector reached $12.97 billion (Rs 83,713 crore) during April 2000 to December 2017, accounting for 3.52% of FDI inflows in India, the report said.


Related News

View more

Why the Texas Power Grid Is Facing Another Crisis

Texas Power Grid Reliability faces record peak demand as ERCOT balances renewable energy, wind and solar variability, gas-fired generation, demand response, and transmission limits to prevent blackouts during heat waves and extreme weather.


Key Points

Texas Power Grid Reliability is ERCOT's capacity to meet peak demand with diverse resources while limiting outages.

✅ Record heat drives peak demand across ERCOT.

✅ Variable wind/solar need firm, flexible capacity.

✅ Demand response and reserves reduce blackout risk.


The electric power grid in Texas, which collapsed dramatically during the 2021 winter storm across the state, is being tested again as the state suffers unusually hot summer weather. Demand for electricity has reached new records at a time of rapid change in the mix of power sources as wind and solar ramp up. That’s feeding a debate about the dependability of the state’s power. 

1. Why is the Texas grid under threat again? 

Already the biggest power user in the nation, electricity use in the second most-populous state surged to record levels during heat waves this summer. The jump in demand comes as the state becomes more dependent on intermittent renewable power sources, raising concerns among some critics that more reliance on wind and solar will leave the grid more vulnerable to disruption. Green sources will produce almost 40% of the power in Texas this year, US Energy Information Administration data show. While that trails California’s 52%, Texas is a bigger market. It’s already No. 1 in wind, making it the largest clean energy market in the US. 

2. How is Texas unique? 

The spirit of defiance of the Lone Star State extends to its power grid as well. The Electric Reliability Council of Texas, or Ercot as the grid operator is known, serves about 90% of the state’s electricity needs and has very few high-voltage transmission lines connecting to nearby grids. It’s a deliberate move to avoid federal oversight of the power market. That means Texas has to be mainly self-reliant and cannot depend on neighbors during extreme conditions. That vulnerability is a dramatic twist for a state that’s also the energy capital of the US, thanks to vast oil and natural gas producing fields. Favorable regulations are also driving a wind and solar boom in Texas. 

3. Why the worry? 

The summer of 2023 will mark the first time all of the state’s needs cannot be met by traditional power plants, like nuclear, coal and gas. A sign of potential trouble came on June 20 when state officials urged residents to conserve power because of low supplies from wind farms and unexpected closures of fossil-fuel generators amid supply-chain constraints that limited availability. As of late July, the grid was holding up, thanks to the help of renewable sources. Solar generation has been coming in close to expected summer capacity, or exceeding it on most days. This has helped offset the hours in the middle of the day when wind speeds died down in West Texas. 

4. Why didn’t the grid’s problems get fixed? 

There is no easy fix. The Texas system allows the price of electricity to swing to match supply and demand. That means high prices — and high profits — drive the development of new power plants. At times spot power prices have been as low as $20-$50 a megawatt-hour versus more than $4,000 during periods of stress. The limitation of this pricing structure was laid bare by the 2021 winter blackouts. Since then, state lawmakers have passed market reforms that require weatherization of critical infrastructure and changed rules to put more money in the pockets of the owners of power generation.  

5. What’s the big challenge? 

There’s a real clash going on over what the grid of the future should look like in Texas and across the country, especially as severe heat raises blackout risks nationally. The challenge is to make sure nuclear and fossil fuel plants that are needed right now don’t retire too early and still allow newer, cleaner technologies to flourish. Some conservative Republicans have blamed renewable energy for destabilizing the grid and have pushed for more fossil-fuel powered generators. Lawmakers passed a controversial $10 billion program providing low-interest loans and grants to build new gas-fired plants using taxpayer money, but Texans ultimately have to vote on the subsidy. 


6. Why do improvements take so long? 

Figuring out how to keep the lights on without overburdening consumers is becoming a greater challenge amid more extreme weather fueled by climate change. As such, changing the rules is often a hotly contested process pitting utilities, generators, manufacturers, electricity retailers and other groups against one another. The process became more politicized after the storm in 2021 with Republican Gov. Greg Abbott and lawmakers ordering Ercot to make changes. Building more transmission lines and connecting to other states can help, but such projects are typically tied up for years in red tape.

7. What can be done? 

The price cap for electricity was cut from $9,000/MWh to $5,000 to help avoid the punitive costs seen in the 2021 storm, though prices are allowed to spike more easily. Ercot is also contracting for more reserves to be online to help avoid supply shortfalls and improve reliability for customers, which added $1.7 billion in consumer costs alone last year. Another rule helps some gas generators pay for their fuel costs, while a more recent reform put in price floors when reserves fall to certain levels. Many power experts say that the easiest solution is to pay people to reduce their energy consumption during times of grid stress through so-called demand response programs. Factories, Bitcoin miners and other large users are already compensated to conserve during tight grid conditions.


Related News

View more

Wind Power Surges in U.S. Electricity Mix

U.S. Wind Power 2025 drives record capacity additions, with FERC data showing robust renewable energy growth, IRA incentives, onshore and offshore projects, utility-scale generation, grid integration, and manufacturing investment boosting clean electricity across key states.


Key Points

Overview of record wind additions, IRA incentives, and grid expansion defining the U.S. clean electricity mix in 2025.

✅ FERC: 30.1% of new U.S. capacity in Jan 2025 from wind

✅ Major projects: Cedar Springs IV, Boswell, Prosperity, Golden Hills

✅ IRA incentives drive onshore, offshore builds and manufacturing


In early 2025, wind power has significantly strengthened its position in the United States' electricity generation portfolio. According to data from the Federal Energy Regulatory Commission (FERC), wind energy accounted for 30.1% of the new electricity capacity added in January 2025, and as the most-used renewable source in the U.S., it also surpassed the previous record set in 2024. This growth is attributed to substantial projects such as the 390.4 MW Cedar Springs Wind IV and the 330.0 MW Boswell Wind Farm in Wyoming, along with the 300.0 MW Prosperity Wind Farm in Illinois and the 201.0 MW Golden Hills Wind Farm Expansion in Oregon. 

The expansion of wind energy capacity is part of a broader trend where solar and wind together accounted for over 98% of the new electricity generation capacity added in the U.S. in January 2025. This surge is further supported by the federal government's Inflation Reduction Act (IRA) and broader policy support for renewables, which has bolstered incentives for renewable energy projects, leading to increased investments and the establishment of new manufacturing facilities. 

By April 2025, clean electricity sources, including wind and solar, were projected to surpass 51% of total utility-scale electricity generation in the U.S., building on a 25.5% renewable share seen in recent data, marking a significant milestone in the nation's energy transition. This achievement is attributed to a combination of factors: a seasonal drop in electricity demand during the spring shoulder season, increased wind speeds in key areas like Texas, and higher solar production due to longer daylight hours and expanded capacity in states such as California, Arizona, and Nevada, supported by record installations across the solar and storage industry. 

Despite a 7% decline in wind power production in early April compared to the same period in 2024—primarily due to weaker wind speeds in regions like Texas—the overall contribution of wind energy remained robust, supported by an 82% clean-energy pipeline that includes wind, solar, and batteries. This resilience underscores the growing reliability of wind power as a cornerstone of the U.S. electricity mix. 

Looking ahead, the U.S. Department of Energy projects that wind energy capacity will continue to grow, with expectations of adding between 7.3 GW and 9.9 GW in 2024, and potentially increasing to 14.5 GW to 24.8 GW by 2028. This growth is anticipated to be driven by both onshore and offshore wind projects, with onshore wind representing the majority of new additions, continuing a trajectory since surpassing hydro capacity in 2016 in the U.S.

Early 2025 has witnessed a notable increase in wind power's share of the U.S. electricity generation mix. This trend reflects the nation's ongoing commitment to expanding renewable energy sources, especially after renewables surpassed coal in 2022, supported by favorable policies and technological advancements. As the U.S. continues to invest in and develop wind energy infrastructure, the role of wind power in achieving a cleaner and more sustainable energy future becomes increasingly pivotal.


Related News

View more

NT Power Penalized $75,000 for Delayed Disconnection Notices

NT Power OEB Compliance Penalty highlights a $75,000 fine for improper disconnection notices, 14-day rule violations, process oversight failures, refunds, LEAP support, and corrective training to strengthen consumer protection and regulatory adherence in Ontario areas.


Key Points

A $75,000 OEB fine to NT Power for improper disconnection notices; refunds, LEAP support, and improved compliance.

✅ $75k administrative monetary penalty; $25k LEAP donation; refunds

✅ 870 notices misdated; 14-day rule training implemented

✅ 10 disconnects reconnected; $100 goodwill credits


The Ontario Energy Board recently ruled against Newmarket-Tay Power Distribution Ltd. (NT Power), fining them $75,000 for failing to issue timely disconnection notices to 870 customers between April and August 2022. These notices did not comply with the Ontario Energy Board's distribution system code, similar to standards reaffirmed in the OEB decision on Hydro One rates earlier this year, which mandates a minimum 14-day notice period before disconnection.

Out of the affected customers, ten had their electricity services disconnected, and six were additionally charged reconnection fees. However, NT Power has since reconnected all disconnected customers and refunded the reconnection fees, as confirmed by the Ontario Energy Board.

In response to these issues, NT Power has voluntarily accepted an assurance of compliance. This agreement stipulates that NT Power will pay a $75,000 administrative monetary penalty. Furthermore, they will make an additional payment of $25,000 to the Salvation Army's Northridge Community Church, which administers the Low-income Energy Assistance Program (LEAP) within NT Power's service area, aligning with broader efforts to reduce costs for industry highlighted by Canadian Manufacturers & Exporters recently, according to the association.

This is not the first time NT Power has faced compliance issues in this regard. The utility company admitted that this incident marks the second instance in three years where they failed to adhere to their disconnection-related obligations as outlined in the code, and sector governance debates, including the Manitoba Hydro board debate, underscore how oversight remains a national focus.

In a statement to NewmarketToday, NT Power acknowledged a similar issue three years ago when they were alerted to problems with their disconnection process. They promptly made adjustments to align their in-house procedures with the requirements of the Ontario Energy Board. Unfortunately, they neglected to implement a secondary check, leading to disconnect notices being dated a few days too early.

Alex Braletic, NT Power's Vice President of Engineering and Operation, clarified that no customers were actually disconnected prematurely, and debates over paying for electricity in India illustrate how enforcement challenges differ globally, but the issued letters contained inaccuracies. He added that NT Power has since instituted additional verification procedures to prevent such errors from occurring again.

The Ontario Energy Board emphasized that NT Power has assured them that corrective measures have been taken to ensure that their staff involved in the disconnection process receive proper training and management oversight, and recent market reactions such as Hydro One shares falling after leadership changes underscore the importance of strong governance to guarantee compliance with regulatory requirements.

Brian Hewson, Vice President of Consumer Protection and Industry Performance at the Ontario Energy Board, stated, referencing earlier Ontario rate reductions for businesses that complemented consumer protections, "As a result of the actions we have taken and NT Power’s assurance that it is aware of its obligations and has taken steps to improve its processes, consumers will be better protected."

Braletic encouraged NT Power's customers who are facing difficulties paying their electricity bills to reach out to their customer service department or visit their website. He emphasized that various programs and services are available to provide relief for bills, and amid ongoing Toronto Hydro impersonation scams customers should contact NT Power directly. NT Power is committed to collaborating with customers proactively and connecting them with assistance to avoid serving them with disconnection notices.

Furthermore, NT Power plans to send a letter to the ten affected customers and provide each of them with a $100 bill credit as a goodwill gesture.


Related News

View more

Altmaier's new electricity forecast: the main driver is e-mobility

Germany 2030 Electricity Demand Forecast projects 658 TWh, driven by e-mobility, heat pumps, and green hydrogen. BMWi and BDEW see higher renewables, onshore wind, photovoltaics, and faster grid expansion to meet climate targets.


Key Points

A BMWi outlook to 658 TWh by 2030, led by e-mobility, plus demand from heat pumps, green hydrogen, and industry.

✅ Transport adds ~70 TWh; cars take 44 TWh by 2030

✅ Heat pumps add 35 TWh; green hydrogen needs ~20 TWh

✅ BDEW urges 70% renewables and faster grid expansion


Gross electricity consumption in Germany will increase from 595 terawatt hours (TWh) in 2018 to 658 TWh in 2030. That is an increase of eleven percent. This emerges from the detailed analysis of the development of electricity demand that the Federal Ministry of Economics (BMWi) published on Tuesday. The main driver of the increase is therefore the transport sector. According to the paper, increased electric mobility in particular contributes 68 TWh to the increase, in line with rising EV power demand trends across markets. Around 44 TWh of this should be for cars, 7 TWh for light commercial vehicles and 17 TWh for heavy trucks. If the electricity consumption for buses and two-wheelers is added, this results in electricity consumption for e-mobility of around 70 TWh.

The number of purely battery-powered vehicles is increasing according to the investigation by the BMWi to 16 million by 2030, reflecting the global electric car market momentum, plus 2.2 million plug-in hybrids. In 2018 there were only around 100,000 electric cars, the associated electricity consumption was an estimated 0.3 TWh, and plug-in mileage in 2021 highlighted the rapid uptake elsewhere. For heat pumps, the researchers predict an increase in demand by 35 TWh to around 42 TWh. They estimate the electricity consumption for the production of around 12.5 TWh of green hydrogen in 2030 to be just under 20 TWh. The demand at battery factories and data centers will increase by 13 TWh compared to 2018 by this point in time. In the data centers, there is no higher consumption due to more efficient hardware despite advancing digitization.

The updated figures are based on ongoing scenario calculations by Prognos, in which the market researchers took into account the goals of the Climate Protection Act for 2030 and the wider European electrification push for decarbonization. In the preliminary estimate presented by Federal Economics Minister Peter Altmaier (CDU) in July, a range of 645 to 665 TWh was determined for gross electricity consumption in 2030. Previously, Altmaier officially said that electricity demand in this country would remain constant for the next ten years. In June, Chancellor Angela Merkel (CDU) called for an expanded forecast that would have to include trends in e-mobility adoption within a decade and the Internet of Things, for example.

Higher electricity demand
The Federal Association of Energy and Water Management (BDEW) is assuming an even higher electricity demand of around 700 TWh in nine years. In any case, a higher share of renewable energies in electricity generation of 70 percent by 2030 is necessary in order to be able to achieve the climate targets and to address electricity price volatility risks. The expansion paths urgently need to be increased and obstacles removed. This could mean around 100 gigawatts (GW) for onshore wind turbines, 11 GW for biomass and at least 150 GW for photovoltaics by 2030. Faster network expansion and renovation will also become even more urgent, as electric cars challenge grids in many regions.


Related News

View more

Sign Up for Electricity Forum’s Newsletter

Stay informed with our FREE Newsletter — get the latest news, breakthrough technologies, and expert insights, delivered straight to your inbox.

Electricity Today T&D Magazine Subscribe for FREE

Stay informed with the latest T&D policies and technologies.
  • Timely insights from industry experts
  • Practical solutions T&D engineers
  • Free access to every issue

Download the 2025 Electrical Training Catalog

Explore 50+ live, expert-led electrical training courses –

  • Interactive
  • Flexible
  • CEU-cerified