Constellation NewEnergy announces demand response offerings for Ontario

By PR Newswire


Substation Relay Protection Training

Our customized live online or in‑person group training can be delivered to your staff at your location.

  • Live Online
  • 12 hours Instructor-led
  • Group Training Available
Regular Price:
$699
Coupon Price:
$599
Reserve Your Seat Today
Constellation Energy announced that its subsidiary, Constellation NewEnergy, is offering its NewResponse demand response program to commercial, industrial and governmental electricity customers in Ontario, Canada.

As a member of the Ontario Power Authority's (OPA) DR3 Program, Constellation NewEnergy has agreed to provide 25 MW of demand response capacity, to reduce energy use during times of peak demand.

The OPA will compensate Constellation NewEnergy's customers who curtail energy use by shedding load or turning to on-site generation for a specific period of time when called upon. Once enrolled, participants earn a recurring availability payment for committing to the program, as well as an energy utilization payment for actually reducing load.

"Enrolling in a demand response program is a smart business decision that delivers an immediate return on investment," said Peter Kelly-Detwiler, senior vice president for Constellation NewEnergy. "The benefits of participating in the OPA DR3 program are twofold: alleviating pressure on the grid and providing revenue that customers may choose to invest in additional energy efficiency and environmental programs."

Ontario is the first Province in Canada to begin implementation of a demand response program designed to reduce stress on the electricity grid and to help prevent blackouts. Already offering demand response products to customers in the United States, Constellation NewEnergy is well-positioned to provide both seasoned expertise and comprehensive demand response products to Ontario's emerging market.

"We are pleased to see Constellation NewEnergy, a provider of energy services to wholesale, commercial and industrial customers, offering new products and services to the Ontario electric market," said Paul Shervill, vice president Conservation and Sector Development of the OPA. "We look forward to working with Constellation NewEnergy to provide Ontario-based customers additional opportunities to manage their energy costs while helping to reduce electricity demand when supplies are tight."

Related News

Electricity Prices Surge to Record as Europe Struggles to Keep Lights on

France Electricity Crisis drives record power prices as nuclear outages squeeze supply, forcing energy imports, fuel oil and coal generation, amid gas market shocks, weak wind output, and freezing weather straining the grid.


Key Points

A French power shortfall from nuclear outages, record prices, heavy imports, and oil-fired backup amid cold weather.

✅ EDF halted reactors; 10% capacity offline, 30% by January

✅ Imports surge; fuel oil and coal units dispatched

✅ Prices spike as gas reverses flow and wind output drops


Electricity prices surged to a fresh record as France scrambled to keep its lights on, sucking up supplies from the rest of Europe.

France, usually an exporter of power, is boosting electricity imports and even burning fuel oil, and has at times limited nuclear output due to high river temperatures during heatwaves. The crunch comes after Electricite de France SA said it would halt four reactors accounting for 10% of the nation’s nuclear capacity, straining power grids already facing cold weather. Six oil-fired units were turned on in France on Tuesday morning, according to a filing with Entsoe.

“It’s illustrating how severe it is when they’re actually starting to burn fuel oil and importing from all these countries,” said Fabian Ronningen, an analyst at Rystad Energy. The unexpected plant maintenance “is reflected in the market prices,” he said

Europe is facing an energy crisis, with utilities relying on coal and oil. Almost 30% of France’s nuclear capacity will be offline at the beginning of January, leaving the energy market at the mercy of the weather. To make matters worse, Germany is closing almost half of its nuclear capacity before the end of the year, as Europe loses nuclear power just when it really needs energy.

German power for delivery next year surged 10% to 278.50 euros a megawatt-hour, while the French contract for January added 9.5% to a record 700.60 euros. Prices also gained, under Europe’s marginal pricing system, as gas jumped after shipments from Russia via a key pipeline reversed direction, flowing eastward toward Poland instead.

Neighboring countries are boosting their exports to France this week to cover for lost nuclear output, with imports from Germany rising to highest level in at least four years. In the U.K., four coal power units were operating on Tuesday with as much as 1.5 gigawatts of hourly output being sent across the channel. 

The power crisis is so severe that the French government has asked EDF to restart some nuclear reactors earlier than planned amid outage risks for nuclear-powered France. Ecology Minister Barbara Pompili said last weekend that, in addition to the early reactor restarts and past river-temperature limits, the country had contracts with some companies in which they agreed to cut production during peak demand hours in exchange for payments from the government.

Higher energy prices threaten to derail Europe’s economic recovery just as the coronavirus omicron variety is spreading. Trafigura Group’s Nyrstar will pause production at its zinc smelter in France in the first week of January because of rising electricity prices. Norwegian fertilizer producer Yara International, which curbed output earlier this year, said it would continue to monitor the situation closely and curtail production where necessary.

Freezing weather this week is also sending short-term power prices surging as renewables can’t keep up, even though wind and solar overtook gas in the EU last year. German wind output plunged to a five-week low on Tuesday.


Related News

View more

Energy-insecure households in the U.S. pay 27% more for electricity than others

Community Solar for Low-Income Homes expands energy equity by delivering renewable energy access, predictable bill savings, and tax credit benefits to renters and energy-insecure households, accelerating distributed generation and storage adoption nationwide.


Key Points

A program model enabling renters and LMI households to subscribe to off-site solar and save on utility bills.

✅ Earn bill credits from shared solar generation.

✅ Expands access for renters and LMI subscribers.

✅ Often paired with storage and IRA tax credit adders.


On a square-foot basis, the issue of inequality is made worse by higher costs for energy usage in the nation. Efforts like community solar programs such as Maryland community solar are underway to boost low-income participation in the cost benefits of renewable energy.

The Energy Information Administration (EIA) shows that households that are considered energy insecure, or those that have the inability to adequately meet basic household energy costs, are paying more for electricity than their wealthier counterparts. 

On average in the United States in 2020, households were billed about $1.04 per square foot for all energy sources. For homes that did not report energy insecurity, that average was $0.98 per square foot, while homes with energy insecurity issues paid an average of $1.24 per square foot for energy. This means that U.S. residents that need the most support on their energy bills are stuck with costs 27% higher than their neighbors on square-foot-basis.

EIA said energy-insecure households have reduced or forgone basic necessities to pay energy bills, kept their houses at unsafe temperatures because of energy cost concerns, or been unable to repair heating or cooling equipment because of cost.

In 2020, households with income less than $10,000 a year were billed an average of $1.31 per square foot for energy, while households making $100,000 or more were billed an average of $0.96 per square foot, said EIA. Renters paid considerably more ($1.28 per square foot) than owners ($0.98 per square foot). There were also considerable differences between regions, with New England solar growth sparking grid upgrade debates, ethnic groups and races, and insulation levels, as seen below.

The energy transition toward renewables like solar has offered price stability, amid record solar and storage growth nationwide, but thus far energy-insecure communities have relatively been left behind. A recent Berkeley Lab report, Residential Solar-Adopter Income and Demographic Trends, indicates that even though the rate of solar adoption among low-income residents is increasing (from 5% in 2010 to 11% in 2021), that segment of energy consumers remains under-represented among solar adopters, relative to its share of the population.


Community solar efforts

As such, the United States is targeting communities most impacted by energy costs that have not benefitted from the transition, highlighting “Energy Communities” that are eligible for an additional 10% tax credit through funds made possible by the Inflation Reduction Act.

Additionally, a push for community solar development is taking place nationwide to extend access to affordable solar energy to renters and other residents that aren’t able to leverage finances to invest in predictable, low-cost residential solar systems. The Biden Administration set a goal this year to sign up 5 million community solar households, achieving $1 billion in bill savings by 2025. The community solar model only represents about 8% of the total distributed solar capacity in the nation. This target would entail a jump from 3 GW installed capacity to 20 GW by the target year. The Department of Energy estimates community solar subscribers save an average of 20% on their bills.

California this year passed AB 2316, the Community Renewable Energy Act takes aim at four acute problems in the state’s power market: reliability amid rising outage risks, rates, climate and equity. The law creates a community renewable energy program, including community solar-plus-storage, supported by cheaper batteries, to overcome access barriers for nearly half of Californians who rent or have low incomes. Community solar typically involves customers subscribing to an off-site solar facility, receiving a utility bill credit for the power it generates.

“Community renewable energy is a proven powerful tool to help close California’s clean energy gap, bringing much needed relief to millions struggling with high housing costs and utility debt,” said Alexis Sutterman, energy equity program manager at the California Environmental Justice Alliance.

The program has energy equity baked into its structure, working to make sure Californians of all income levels participate in the benefits of the energy transition. Not only does it open solar access to renters, the law ensures that at least 51% of subscribers are low-income customers, which is expected to make projects eligible for a 10% tax credit adder under the IRA.

“The money’s on the table now,” said Jeff Cramer, president and chief executive of the Coalition for Community Solar Access. “While there are groups pushing for solar access for all, and states with strong legislation, there are other pockets of interest in surprising places in the United States. For example, Louisiana has no policy for community solar or support for low-income residents going solar but the city of New Orleans has its own utility commission with a community solar program. In Nebraska, forward-looking co-operatives have created community solar projects.

Community solar markets are active in 22 states, with more expected to come online in the future as states pursue 100% clean energy targets across the country. However, the market is expected to require strong community outreach efforts to foster trust and gain subscribers.

“There is a distrust of community solar initially in LMI communities as many have been burned before by retail energy false promises,” said Eric LaMora, executive director, community solar, Nautilus Solar on a panel at the Solar Energy Industries Association Finance, Tax, and Buyers seminar. “People are suspicious but there really are no hooks with community solar.”

LMI residents are leery to provide tax records or much documents at all in order to sign up for community solar, LaMora said. “We were surprised to see less of a default rate with LMI residents. We attribute this to the fact that they see significant savings on their electric bill, making it easier to pay each month,” he said.


Related News

View more

South Australia rides renewables boom to become electricity exporter

Australia electricity grid transition is accelerating as renewables, wind, solar, and storage drive decentralised generation, emissions cuts, and NEM trade shifts, with South Australia becoming a net exporter post-Hazelwood closure and rooftop solar surging.


Key Points

Australia electricity shift to renewables, distributed generation and storage, cutting emissions, reshaping NEM flows.

✅ South Australia now exports power post-Hazelwood closure

✅ Rooftop solar is the fastest-growing NEM generation source

✅ Gas peaking and storage investments balance variable renewables


The politics may not change much, but Australia’s electricity grid is changing before our very eyes – slowly and inevitably becoming more renewable, more decentralised, and in step with Australia's energy transition that is challenging the pre-conceptions of many in the industry.

The latest national emissions audit from The Australia Institute, which includes an update on key electricity trends in the national electricity market, notes some interesting developments over the last three months.

The most surprising of those developments may be the South Australia achievement, which shows that since the closure of the Hazelwood brown coal generator in Victoria in March 2017, and as renewables outpacing brown coal in other markets, South Australia has become a net exporter of electricity, in net annualised terms.

Hugh Saddler, lead author of the study, notes that this is a big change for South Australia, which in 1999 and 2000, when it had only gas and local coal, used to import 30% of its electricity demand.

#google#

The fact that wholesale prices in South Australia were higher in other states – then, as they are now – has nothing to with wind and solar, but the fact that it has no low-cost conventional source and a peaky demand profile (then and now).

“The difference today is that the state is now taking advantage of its abundant resources of wind and solar radiation, and the new technologies which have made them the lowest cost sources of new generation, to supply much of its electricity requirements,” Saddler writes.

Other things to note about the flows between states is that Victoria was about equal on imports and exports with its three neighbouring states, despite the closure of Hazelwood. NSW continues to import around 10% of its needs from cheaper providers in Queensland.

Gas-fired generation had increased in the last year or two in South Australia as a result of the Northern closure, but is still below the levels of a decade ago.

But because it is expensive, this is likely to spur more investment in storage.

As for rooftop solar, Saddler notes that the share of residential solar in the grid is still relatively small but, despite excess solar risks flagged by distributors, it is the most steadily growing generation source in the NEM.

That line is expected to grow steadily. By 2040, or perhaps 2050, the share of distributed generation, which includes rooftop solar, battery storage and demand management, is expected to reach nearly half of all Australia’s grid demand.

Saddler, says, however, that the increase in large-scale solar over the last few months is a significant milestone in Australia’s transition towards clean electricity generation, mirroring trends in India's on-grid solar development seen in recent years. (See very top graph).

“Firstly, they are a concrete demonstration that the construction cost advantage, which wind enjoyed over solar until a year or two ago, is gone.

“From now on we can expect new capacity to be a mix of both technologies. Indeed, the Clean Energy Regulator states that it expects solar to account for half of all (new renewable) capacity by 2020, and the US is moving toward 30% from wind and solar as well.”


Related News

View more

No time to be silent on NZ's electricity future

New Zealand Renewable Energy Strategy examines decarbonisation, GHG emissions, and net energy as electrification accelerates, expanding hydro, geothermal, wind, and solar PV while weighing intermittency, storage, materials, and energy security for a resilient power system.


Key Points

A plan to expand electricity generation, balancing decarbonisation, net energy limits, and energy security.

✅ Distinguishes decarbonisation targets from renewable capacity growth

✅ Highlights net energy limits, intermittency, and storage needs

✅ Addresses materials, GHG build-out costs, and energy security


The Electricity Authority has released a document outlining a plan to achieve the Government’s goal of more than doubling the amount of electricity generated in New Zealand over the next few decades.

This goal is seen as a way of both reducing our greenhouse gas (GHG) emissions overall, as everything becomes electrified, and ensuring we have a 100 percent renewable energy system at our disposal. Often these two goals are seen as being the same – to decarbonise we must transition to more renewable energy to power our society.

But they are quite different goals and should be clearly differentiated. GHG emissions could be controlled very effectively by rationing the use of a fossil fuel lockdown approach, with declining rations being available over a few years. Such a direct method of controlling emissions would ensure we do our bit to remain within a safe carbon budget.

If we took this dramatic step we could stop fretting about how to reduce emissions (that would be guaranteed by the rationing), and instead focus on how to adapt our lives to the absence of fossil fuels.

Again, these may seem like the same task, but they are not. Decarbonising is generally thought of in terms of replacing fossil fuels with some other energy source, signalling that a green recovery must address more than just wind capacity. Adapting our lives to the absence of fossil fuels pushes us to ask more fundamental questions about how much energy we actually need, what we need energy for, and the impact of that energy on our environment.

MBIE data indicate that between 1990 and 2020, New Zealand almost doubled the total amount of energy it produced from renewable energy sources - hydro, geothermal and some solar PV and wind turbines.

Over this same time period our GHG emissions increased by about 25 percent. The increase in renewables didn’t result in less GHG emissions because we increased our total energy use by almost 50 percent, mostly by using fossil fuels. The largest fossil fuel increases were used in transport, agriculture, forestry and fisheries (approximately 60 percent increases for each).

These data clearly demonstrate that increasing renewable energy sources do not necessarily result in reduced GHG emissions.

The same MBIE data indicate that over this same time period, the amount of Losses and Own Use category for energy use more than doubled. As of 2020 almost 30 percent of all energy consumed in New Zealand fell into this category.

These data indicate that more renewable energy sources are historically associated with less energy actually being available to do work in society.

While the category Losses and Own Use is not a net energy analysis, the large increase in this category makes the call for a system-wide net energy analysis all the more urgent.

Net energy is the amount of energy available after the energy inputs to produce and deliver the energy is subtracted. There is considerable data available indicating that solar PV and wind turbines have a much lower net energy surplus than fossil fuels.

And there is further evidence that when the intermittency and storage requirements are engineered into a total renewable energy system, the net energy of the entire system declines sharply. Could the Losses and Other Uses increase over this 30-year period be an indication of things to come?

Despite the importance of net energy analysis in designing a national energy system which is intended to provide energy security and resilience, there is not a single mention of net energy surplus in the EA reference document.

So over the last 30 years, New Zealand has doubled its renewable energy capacity, and at the same time increased its GHG emissions and reduced the overall efficiency of the national energy system.

And we are now planning to more than double our renewable energy system yet again over the next 30 years, even as zero-emissions electricity by 2035 is being debated elsewhere. We need to ask if this is a good idea.

How can we expand New Zealand’s solar PV and wind turbines without using fossil fuels? We can’t.

How could we expand our solar PV and wind turbines without mining rare minerals and the hidden costs of clean energy they entail, further contributing to ecological destruction and often increasing social injustices? We can't.

Even if we could construct, deliver, install and maintain solar PV and wind turbines without generating more GHG emissions and destroying ecosystems and poor communities, this “renewable” infrastructure would have to be replaced in a few decades. But there are at least two major problems with this assumed scenario.

The rare earth minerals required for this replacement will already be exhausted by the initial build out. Recycling will only provide a limited amount of replacements.

The other challenge is that a mostly “renewable” energy system will likely have a considerably lower net energy surplus. So where, in 2060, will the energy come from to either mine or recycle the raw materials, and to rebuild, reinstall and maintain the next iteration of a renewable energy system?

There is currently no plan for this replacement. It is a serious misnomer to call these energy technologies “renewable”. They are not as they rely on considerable raw material inputs and fossil energy for their production and never ending replacement.

New Zealand is, of course, blessed with an unusually high level of hydro electric and geothermal power. New Zealand currently uses over 170 GJ of total energy per capita, 40 percent of which is “renewable”. This provides approximately 70 GJ of “renewable” energy per capita with our current population.

This is the average global per capita energy level from all sources across all nations, as calls for 100% renewable energy globally emphasize. Several nations operate with roughly this amount of total energy per capita that New Zealand can generate just from “renewables”.

It is worth reflecting on the 170 GJ of total energy use we currently consume. Different studies give very different results regarding what levels are necessary for a good life.

For a complex industrial society such as ours, 100 GJ pc is said to be necessary for a high levels of wellbeing, determined both subjectively (life satisfaction/ happiness measures), and objectively (e.g. infant mortality levels, female morbidity as an index of population health, access to nutritious food and educational and health resources, etc). These studies do not take into account the large amount of energy that is wasted either through inefficient technologies, or frivolous use, which effective decarbonization strategies seek to reduce.

Other studies that consider the minimal energy needed for wellbeing suggest a much lower level of per capita energy consumption is required. These studies take a different approach and focus on ensuring basic wellbeing is maintained, but not necessarily with all the trappings of a complex industrial society. Their results indicate a level of approximately 20 GJ per capita is adequate.

In either case, we in New Zealand are wasting a lot of energy, both in terms of the efficiency of our technologies (see the Losses and Own Use info above), and also in our uses which do not contribute to wellbeing (think of the private vehicle travel that could be done by active or public transport – if we had good infrastructure in place).

We in New Zealand need a national dialogue about our future. And energy availability is only one aspect. We need to discuss what our carrying capacity is, what level of consumption is sustainable for our population, and whether we wish to make adjustments in either our per capita consumption or our population. Both together determine whether we are on the sustainable side of carrying capacity. Currently we are on the unsustainable side, meaning our way of life cannot endure. Not a good look for being a good ancestor.

The current trajectory of the Government and Electricity Authority appears to be grossly unsustainable. At the very least they should be able to answer the questions posed here about the GHG emissions from implementing a totally renewable energy system, the net energy of such a system, and the related environmental and social consequences.

Public dialogue is critical to collectively working out our future. Allowing the current profit-driven trajectory to unfold is a recipe for disasters for our children and grandchildren.

Being silent on these issues amounts to complicity in allowing short-term financial interests and an addiction to convenience jeopardise a genuinely secure and resilient future. Let’s get some answers from the Government and Electricity Authority to critical questions about energy security.


Related News

View more

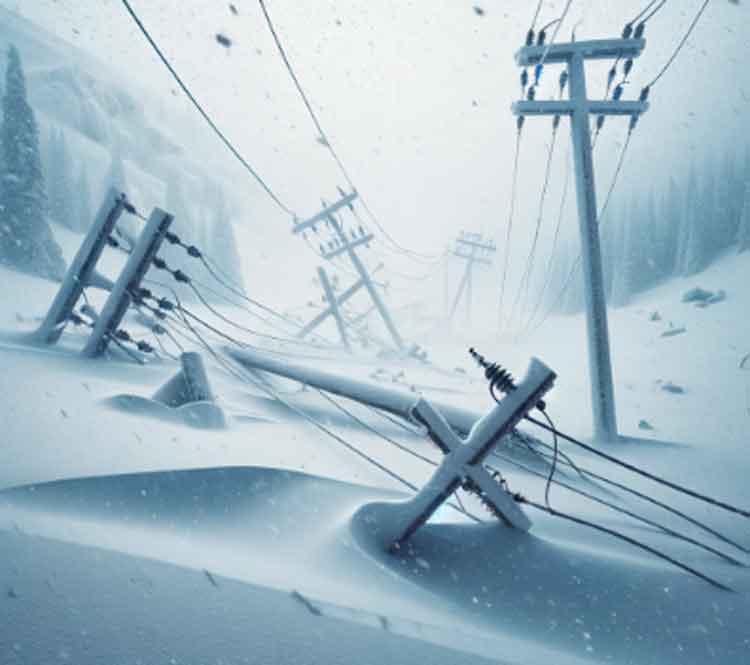
Tens of Thousands Left Without Power as 'Bomb Cyclone' Strikes B.C. Coast

British Columbia Bomb Cyclone disrupts coastal travel with severe wind gusts, heavy rainfall, widespread power outages, ferry cancellations, flooding, and landslides across Vancouver Island, straining emergency services and transport networks during the early holiday season.


Key Points

A rapidly intensifying storm hitting B.C.'s coast, causing damaging winds, heavy rain, power outages, and ferry delays.

✅ Wind gusts over 100 km/h and well above normal rainfall

✅ Power outages, flooded roads, and downed trees across the coast

✅ Ferry cancellations isolating communities and delaying supplies


A powerful storm, dubbed a "bomb cyclone," recently struck the British Columbia coast, wreaking havoc across the region. This intense weather system led to widespread disruptions, including power outages affecting tens of thousands of residents and the cancellation of ferry services, crucial for travel between coastal communities. The bomb cyclone is characterized by a rapid drop in pressure, resulting in extremely strong winds and heavy rainfall. These conditions caused significant damage, particularly along the coast and on Vancouver Island, where flooding and landslides led to fallen trees blocking roads, further complicating recovery efforts.

The storm's ferocity was especially felt in coastal areas, where wind gusts reached over 100 km/h, and rainfall totals were well above normal. The Vancouver region, already susceptible to storms during the winter months, faced dangerous conditions as power lines were downed, and transportation networks struggled to stay operational. Emergency services were stretched thin, responding to multiple weather-related incidents, including fallen trees, damaged infrastructure, and local flooding.

The ferry cancellations further isolated communities, especially those dependent on these services for essential supplies and travel. With many ferry routes out of service, residents had to rely on alternative transportation methods, which were often limited. The storm's timing, close to the start of the holiday season, also created additional challenges for those trying to make travel arrangements for family visits and other festive activities.

As cleanup efforts got underway, authorities warned that recovery would take time, particularly due to the volume of downed trees and debris. Crews worked to restore power and clear roads, while local governments urged people to stay indoors and avoid unnecessary travel, and BC Hydro's winter payment plan provided billing relief during outages. For those without power, the storm brought cold temperatures, and record electricity demand in 2021 showed how cold snaps strain the grid, making it crucial for families to find warmth and supplies.

In the aftermath of the bomb cyclone, experts highlighted the increasing frequency of such extreme weather events, driven in part by climate change and prolonged drought across the province. With the potential for more intense storms in the future, the region must be better prepared for these rapid weather shifts. Authorities are now focused on bolstering infrastructure to withstand such events, as all-time high demand has strained the grid recently, and improving early warning systems to give communities more time to prepare.

In the coming weeks, as British Columbia continues to recover, lessons learned from this storm will inform future responses to similar weather systems. For now, residents are advised to remain vigilant and prepared for any additional weather challenges, with recent blizzard and extreme cold in Alberta illustrating how conditions can deteriorate quickly.


Related News

View more

When will the US get 1 GW of offshore wind on the grid?

U.S. Offshore Wind Capacity is set to exceed 1 GW by 2024, driven by BOEM approvals, federal leases, and resilient supply chains, with eastern states scaling renewable energy, turbines, and content despite COVID-19 disruptions.


Key Points

Projected gigawatt-scale offshore wind growth enabled by BOEM approvals, federal leases, and East Coast state demand.

✅ 17+ GW leased; only 1,870 MW in announced first phases.

✅ BOEM approvals are critical to reach >1 GW by 2024.

✅ Local supply chains mitigate COVID-19 impacts and lower costs.


Offshore wind in the U.S. will exceed 1 GW of capacity by 2024 and add more than 1 GW annually by 2027, a trajectory consistent with U.S. offshore wind power trends, according to a report released last week by Navigant Research.

The report calculated over 17 GW of offshore state and federal leases for wind production, reflecting forecasts that $1 trillion offshore wind market growth is possible. However, the owners of those leases have only announced first phase plans for 1,870 MW of capacity, leaving much of the projects in early stages with significant room to grow, according to senior research analyst Jesse Broehl.

The Business Network for Offshore Wind (BNOW) believes it is possible to hit 1 GW by 2023-24, according to CEO Liz Burdock. While the economy has taken a hit from the coronavirus pandemic, she said the offshore wind industry can continue growing as "the supply chain from Asia and Europe regains speed this summer, and the administration starts clearing" plans of construction.

BNOW is concerned with the economic hardship imposed on secondary and tertiary U.S. suppliers due to the global spread of COVID-19.

Offshore wind has been touted by many eastern states and governors as an opportunity to create jobs, with U.S. wind employment expected to expand, according to industry forecasts. Analysts see the growing momentum of projects as a way to further lower costs by creating a local supply chain, which could be jeopardized by a long-term shutdown and recession.

"The federal government must act now — today, not in December — and approve project construction and operation plans," a recent BNOW report said. Approving any of the seven projects before BOEM, which has recently received new lease requests, currently would allow small businesses to get to work "following the containment of the coronavirus," but approval of the projects next year "may be too late to keep them solvent."

The prospects for maintaining momentum in the industry falls largely to the Department of the Interior's Bureau of Ocean Energy Management (BOEM). The industry cannot hit the 1 GW milestone without project approvals by BOEM, which is revising processes to analyze federal permit applications in the context of "greater build out of offshore wind capacity," according to its website.

"It is heavily dependent on the project approval success," Burdock told Utility Dive.

Currently, seven projects are awaiting determinations from BOEM on their construction operation plans in Massachusetts, New York, where a major offshore wind farm was recently approved, New Jersey and Maryland, with more to be added soon, a BNOW spokesperson told Utility Dive.

To date, only one project has received BOEM approval for development in federal waters, a 12 MW pilot by Dominion Energy and Ørsted in Virginia. The two-turbine project is a stepping stone to a commercial-scale 2.6 GW project the companies say could begin installation as soon as 2024, and gave the developers experience with the permitting process.

In the U.S., developers have the capacity to develop 16.9 GW of offshore wind in federal U.S. lease areas, even as wind power's share of the electricity mix surges nationwide, Broehl told Utility Dive, but much of that is in early stages. The Navigant report did not address any impacts of coronavirus on offshore wind, he said.

Although Massachusetts has legislation in place to require utilities to purchase 1.6 GW of wind power by 2026, and several other projects are in early development stages, Navigant expects the first large offshore wind projects in the U.S. (exceeding 200 MW) will come online in 2022 or later, and the first projects with 400 MW or more capacity are likely to be built by 2024-2025, and lessons from the U.K.'s experience could help accelerate timelines. The U.S. would add about 1.2 GW in 2027, Broehl said.

The federal leasing activities along with the involvement from Eastern states and utilities "virtually guarantees that a large offshore wind market is going to take off in the U.S.," Broehl said.


Related News

View more

Sign Up for Electricity Forum’s Newsletter

Stay informed with our FREE Newsletter — get the latest news, breakthrough technologies, and expert insights, delivered straight to your inbox.

Electricity Today T&D Magazine Subscribe for FREE

Stay informed with the latest T&D policies and technologies.
  • Timely insights from industry experts
  • Practical solutions T&D engineers
  • Free access to every issue

Live Online & In-person Group Training

Advantages To Instructor-Led Training – Instructor-Led Course, Customized Training, Multiple Locations, Economical, CEU Credits, Course Discounts.

Request For Quotation

Whether you would prefer Live Online or In-Person instruction, our electrical training courses can be tailored to meet your company's specific requirements and delivered to your employees in one location or at various locations.