Wind power is not a panacea

By Vancouver Sun


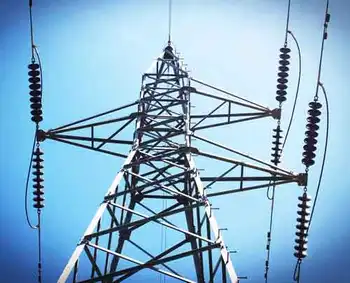
Substation Relay Protection Training

Our customized live online or in‑person group training can be delivered to your staff at your location.

  • Live Online
  • 12 hours Instructor-led
  • Group Training Available
Regular Price:
$699
Coupon Price:
$599
Reserve Your Seat Today
Wind turbines are sprouting up everywhere, and I must confess I like the slenderness of the soaring towers and find the slowly turning blades sensual and hypnotic.

But what I really like is that the fuel for these sleek machines is the wind itself, so there are no emissions to pollute and warm the atmosphere. And the land below can be used for farming, golf courses and parks. Those white turbines are very green.

From 2003 to 2007, world installed wind-turbine capacity grew by an eye-popping 25 per cent each year, and growth is projected to continue at a vigorous annual rate of 20 per cent for the next five years. Today, wind power has a total capacity of 155,000 megawatts (MWs). This is a lot of turbines, for each one is rated at about 0.5 to two MW.

Even Canada is soaring on the air currents with 1,856 MWs of capacity, almost all of which (93 per cent) has been installed since 2000. The provincial leaders are Alberta (524 MW), Ontario (501 MW) and Quebec (422 MW).

One place you won't see any slowly turning blades, however, is in British Columbia, for the so-called "green" province is a wind laggard. Pity, for B.C. desperately needs clean electrical power. Since 2001, B.C. has not generated enough electricity to meet demand, and has imported electricity from Alberta and Washington, much of it from dirty coal stations. The shortfall is 15 per cent and growing.

Before looking at B.C.'s situation, I need to digress and release a little air from the wind balloon. Yes, wind power is great and I fully support its vigorous growth, but we should not set our hopes too high. Environmental groups are doing a dangerous disservice by claiming wind (along with solar and conservation) will provide limitless clean energy and will power the hydrogen economy of the future. It is the answer to global warming and the world's energy problems, so they state. This is totally wrong, instills false optimism and diverts us from tackling the real problems: the ever-growing population and economy.

Wind, sadly, can deliver only a small fraction of the gargantuan amounts of energy that we humans crave. Here's why.

First, it is not generally recognized that the capacity of wind farms is, in practice, much smaller than quoted. Because winds don't blow all the time, a 200-MW wind farm, for example, only generates about one-third of the electricity as a 200-MW hydro or fossil-fuel plant, which runs virtually full-time.

Another serious complication: Electricity must still be supplied to consumers when the wind stops. Thus, wind farms require a backup energy source in the form of a hydro or fossil-fuel plant, or its energy must be stored in batteries or by making hydrogen. Either way, big bucks are needed for capital investment.

Because wind is diffuse, wind farms are large. For example, to replace a 1,000-MW coal station would require about 1,500 turbines of the latest design (two MW each). Not surprisingly, the NIMBY (Not In My Back Yard) syndrome is proving to be a major obstacle to such enormous facilities.

Clearly, wind power is good but it's not a cure-all for our energy ills.

So, what's happening in B.C.? Although the province is endowed with good wind-power potential, progress has been snail-like. The government has decided that private interests will build - and own - all of B.C.'s future wind farms, but the process is controlled by BC Hydro, which will purchase the power. BC Hydro has not promoted wind power, perhaps because wind costs more than imported electricity. Instead, Hydro insists that wind must bid competitively with other "clean" sources such as run-of-river hydro and biomass.

Recent provincial policies may change this position. B.C.'s Energy Plan of 2007 stipulates at least 90 per cent of all electricity generated in the province must come from clean or renewable sources. The recently announced carbon tax will also help wind power's financial outlook.

Now the good news. BC Hydro has approved three projects to date. The Dokie Wind Energy project is a 180-MW wind farm in the Peace region, planned and owned by Earth First Energy Inc. of Victoria. Its first electricity will enter the grid later this year and the entire project - one of the largest in Canada - will be completed by end of 2009. Also coming on line in the next few years is the Bear Mountain Partnership 120-MW farm near Dawson Creek and the Mount Hays Wind Project (27 MW) just south of Prince Rupert.

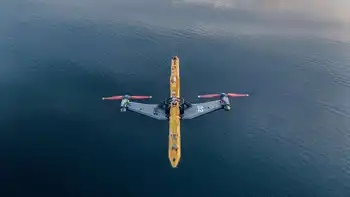
Once BC Hydro loosens its bureaucratic grip, wind power could expand quickly, for there is no shortage of wind and wind entrepreneurs in B.C. For example, more than 50 companies hold investigative wind-use permits. An ambitious project currently on the drawing table is by NaiKun Wind Development Inc., which is planning a mammoth wind farm to be situated in the ocean east of Haida Gwaii. A total of 1,750 MW would be built in five phases. The first phase of 320 MW could start in 2010, BC Hydro willing.

Hydro needs to give wind power priority, recognizing that the alternative - purchased power - bears a large hidden environmental penalty. Instead of forcing wind to go through a competitive process, it should offer to purchase unlimited quantities at prescribed prices, as is done in other jurisdictions.

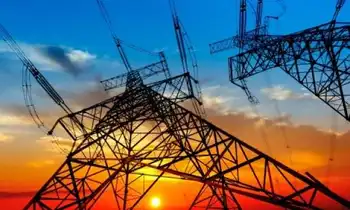
Electricity is the lifeblood of this growing province. We need more, and it needs to be green.

Related News

Britons could save on soaring bills as ministers plan to end link between gas and electricity prices

UK Electricity-Gas Price Decoupling aims to reform wholesale electricity pricing under the Energy Security Bill, shielding households from gas price spikes, supporting renewables, and easing the cost-of-living crisis through market redesign and transparent tariffs.


Key Points

Policy to decouple power prices from gas via the Energy Security Bill, stabilizing bills and reflecting renewables

✅ Breaks gas-to-power pricing link to cut electricity costs

✅ Reduces volatility; shields households from global gas shocks

✅ Highlights benefits of renewables and market transparency


Britons could be handed relief on rocketing household bills under Government plans to sever the link between the prices of gas and electricity, including proposals to restrict energy prices in the market, it has emerged.

Ministers are set to bring forward new laws under the Energy Security Bill to overhaul the UK's energy market in the face of the current cost-of-living crisis.

They have promised to provide greater protection for Britons against global fluctuations in energy prices, through a price cap on bills among other measures.

The current worldwide crisis has been exacerbated by the Ukraine war, which has sent gas prices spiralling higher.

Under the current make-up of Britain's energy market, soaring natural gas prices have had a knock-on effect on electricity costs.

But it has now been reported the new legislation will seek to prevent future shocks in the global gas market having a similar impact on electricity prices.

Yet the overhaul might not come in time to ease high winter energy costs for households ahead of this winter.

According to The Times, Business Secretary Kwasi Kwarteng will outline proposals for reforms in the coming weeks.

These will then form part of the Energy Security Bill to be introduced in the autumn, with officials anticipating a decrease in energy bills by April.

The newspaper said the plans will end the current system under which the wholesale cost of gas effectively determines the price of electricity for households.

Although more than a quarter of Britain's electricity comes from renewable sources, under current market rules it is the most expensive megawatt needed to meet demand that determines the price for all electricity generation.

This means that soaring gas prices have driven up all electricity costs in recent months, even though only around 40% of UK electricity comes from gas power stations.

Energy experts have compared the current market to train passengers having to pay the peak-period price for every journey they make.

One Government source told The Times: 'In the past it didn’t really matter because the price of gas was reasonably stable.

'Now it seems completely crazy that the price of electricity is based on the price of gas when a large amount of our generation is from renewables.'

It was also claimed ministers hope the reforms will make the market more transparent and emphasise to consumers the benefits of decarbonisation, amid an ongoing industry debate over free electricity for consumers.

A Government spokesperson said: 'The high global gas prices and linked high electricity prices that we are currently facing have given added urgency to the need to consider electricity market reform.


Related News

View more

Covid-19 is reshaping the electric rhythms of New York City

COVID-19 Electricity Demand Shift flattens New York's load curve, lowers peak demand, and reduces wholesale prices as NYISO operators balance the grid amid stay-at-home orders, rising residential usage, cheap natural gas, and constrained renewables.


Key Points

An industry-wide change in load patterns: flatter peaks, lower prices, and altered grid operations during lockdowns.

✅ NYISO operators sequestered to maintain reliable grid control

✅ Morning and evening peaks flatten; residential use rises mid-day

✅ Wholesale prices drop amid cheap natural gas and reduced demand


At his post 150 miles up the Hudson, Jon Sawyer watches as a stay-at-home New York City stirs itself with each new dawn in this era of covid-19.

He’s a manager in the system that dispatches electricity throughout New York state, keeping homes lit and hospitals functioning, work that is so essential that he, along with 36 colleagues, has been sequestered away from home and family for going on four weeks now, to avoid the disease, a step also considered for Ontario power staff during COVID-19 measures.

The hour between 7 a.m. and 8 a.m. once saw the city bounding to life. A sharp spike would erupt on the system’s computer screens. Not now. The disease is changing the rhythms of the city, and, as this U.S. grid explainer notes, you can see it in the flows of electricity.

Kids are not going to school, restaurants are not making breakfast for commuters, offices are not turning on the lights, and thousands if not millions of people are staying in bed later, putting off the morning cup of coffee and a warm shower.

Electricity demand in a city that has been shut down is running 18 percent lower at this weekday morning hour than on a typical spring morning, according to the New York Independent System Operator, Sawyer’s employer. As the sun rises in the sky, usage picks up, but it’s a slower, flatter curve.

Though the picture is starkest in New York, it’s happening across the country. Daytime electricity demand is falling, even accounting for the mild spring weather, and early-morning spikes are deflating, with similar patterns in Ontario electricity demand as people stay home. The wholesale price of electricity is falling, too, driven by both reduced demand and the historically low cost of natural gas.

Sign up for our Coronavirus Updates newsletter to track the outbreak. All stories linked in the newsletter are free to access.

As covid-19 hits, coal companies aim to cut the tax they pay to support black-lung miners

Falling demand will hit the companies that run the “merchant generators” hardest. These are the privately owned power plants that sell electricity to the utilities and account for about 57 percent of electricity generation nationwide.

Closed businesses have resulted in falling demand. Residential usage is up — about 15 percent among customers of Con Edison, which serves New York City and Westchester County — as workers and schoolchildren stay home, while in Canada Hydro One peak rates remain unchanged for self-isolating customers, but it’s spread out through the day. Home use does not compensate for locked-up restaurants, offices and factories. Or for the subway system, which on a pre-covid-19 day used as much electricity as Buffalo.

Hospitals are a different story: They consume twice as much energy per square foot as hotels, and lead schools and office buildings by an even greater margin. And their work couldn’t be more vital as they confront the novel coronavirus.

Knowing that, Sawyer said, puts the ordinary routines of his job, which rely on utility disaster planning, the things about it he usually takes for granted, into perspective.

“Keeping the lights on: It comes to the forefront a little more when you understand, ‘I’m going to be sequestered on site to do this job, it’s so critical,’” he said, speaking by phone from his office in East Greenbush, N.Y., where he has been living in a trailer, away from his family, since March 23.

As coronavirus hospitalizations in New York began to peak in April, emergency medicine physician Howard Greller recorded his reflections. (Whitney Leaming/The Washington Post)
Sawyer, 53, is a former submariner in the U.S. Navy, so he has experience when it comes to being isolated from friends and family for long periods. Many of his colleagues in isolation, who all volunteered for the duty, also are military veterans, and they’re familiar with the drill. Life in East Greenbush has advantages over a submarine — you can go outside and throw a football or Frisbee or walk or run the trail on the company campus reserved for the operators, and every day you can use FaceTime or Skype to talk with your family.

His wife understood, he said, though “of course it’s a sacrifice.” But she grasped the obligation he felt to be there with his colleagues and keep the power on.

“It’s a new world, it’s definitely an adjustment,” said Rich Dewey, the system’s CEO, noting that America’s electricity is safe for now. “But we’re not letting a little virus slow us down.”

There are 31 operators, two managers and four cooks and cleaners all divided between East Greenbush, which handles daytime traffic, and another installation just west of Albany in Guilderland, which works at night. The operators work 12-hour shifts every other day.

Computers recalibrate generation, statewide, to equal demand, digesting tens of thousands of data points, every six seconds. Other computers forecast the needs looking ahead 2½ hours. The operators monitor the computers and handle the “contingencies” that inevitably arise.

They dispatch the electricity along transmission lines ranging from 115,000 volts to 765,000 volts, much of it going from plants and dams in western and northern New York downstate toward the city and Long Island.

They always focus on: “What is the next worse thing that can happen, and how can we respond to that?” Sawyer said.

It’s the same shift and the same work they’ve always done, and that gives this moment an oddly normal feeling, he said. “There’s a routine to it that some of the people working at home now don’t have.”

Medical workers check in with them daily to monitor their physical health and mental condition. So far, there have been no dropouts.

Cheap oil doesn’t mean much when no one’s going anywhere

Statewide, the daily demand for electricity has fallen nearly 9 percent.

The distribution system in New England is looking at a 3 to 5 percent decline; the Mid-Atlantic states at 5 to 7 percent; Washington state at 10 percent; and California by nearly as much. In Texas, demand is down 2 percent, “but even there you’re still seeing drops in the early-morning hours,” said Travis Whalen, a utility analyst with S&P Global Platts.

In the huge operating system that embraces much of the middle of the country, usage has fallen more than 8 percent — and the slow morning surge doesn’t peak until noon.

In New York, there used to be a smaller evening spike, too (though starting from a higher load level than the one in the morning). But that’s almost impossible to see anymore because everyone isn’t coming home and turning on the lights and TV and maybe throwing a load in the laundry all at once. No one goes out, either, and the lights aren’t so bright on Broadway.

California, in contrast, had a bigger spike in the evening than in the morning before covid-19 hit; maybe some of that had to do with the large number of early risers spreading out the morning demand and highlighting electricity inequality that shapes access. Both spikes have flattened but are still detectable, and the evening rise is still the larger.

Only at midnight, in New York and elsewhere, does the load resemble what it used to look like.

The wholesale price of electricity has fallen about 40 percent in the past month, according to a study by S&P Global Platts. In California it’s down about 30 percent. In a section covered by the Southwest Power Pool, the price is down 40 percent from a year ago, and in Indiana, electricity sold to utilities is cheaper than it has been in six years.

Some of the merchant generators “are going to be facing some rather large losses,” said Manan Ahuja, also an analyst with S&P Global Platts. With gas so cheap, coal has built up until stockpiles average a 90-day supply, which is unusually large. Ahuja said he believes renewable generators of electricity will be especially vulnerable because as demand slackens it’s easier for operators to fine-tune the output from traditional power plants.

Bravado, dread and denial as oil-price collapse hits the American fracking heartland

As Dewey put it, speaking of solar and wind generators, “You can dispatch them down but you can’t dispatch them up. You can’t make the wind blow or the sun shine.”

Jason Tundermann, a vice president at Level 10 Energy, which promotes renewables, argued that before the morning and evening spikes flattened they were particularly profitable for fossil fuel plants. He suggested electricity demand will certainly pick up again. But an issue for renewable projects under development is that supply chain disruptions could cause them to miss tax credit deadlines.

With demand “on pause,” as Sawyer put it, and consumption more evenly spread through the day, the control room operators in East Greenbush have a somewhat different set of challenges. The main one, he said, is to be sure not to let those high-voltage transmission lines overload. Nuclear power shows up as a steady constant on the real-time dashboard; hydropower is much more up and down, depending on the capacity of transmission lines from the far northern and western parts of the state.

Some human habits are more reliably fixed. The wastewater that moves through New York City’s sewers — at a considerably slower pace than the electricity in the nearby wires — hasn’t shown any change in rhythm since the coronavirus struck, according to Edward Timbers, a spokesman for the city’s Department of Environmental Protection. People may be sleeping a little later, but the “big flush” still arrives at the wastewater treatment plants, about three hours or so downstream from the typical home or apartment, every day in the late morning, just as it always has.


Related News

View more

BOE Says UK Energy Price Guarantee is Key for Next Rates Call

UK Market Stability Outlook remains febrile as the Bank of England, Treasury, and OBR forecasts shape fiscal policy, interest rates, gilt yields, inflation, energy bills, and pound sterling, with Oct. 31 guidance to reassure investors.


Key Points

A view of investor confidence as BOE policy, fiscal plans, and energy aid shape inflation and interest rates.

✅ Markets await Oct. 31 fiscal statement and OBR projections

✅ Energy support design drives inflation and disposable income

✅ Pound weakness adds imported inflation; rates seen up 75 bps


Bank of England Deputy Governor Dave Ramsden said financial markets are still unsettled about the outlook for the UK and that a Treasury statement due on Oct. 31 may provide some reassurance.

Speaking to the Treasury Committee in Parliament, Ramsden said officials in government and the central bank are dealing with huge economic shocks, notably the surge in energy prices that came with Russia’s attack on Ukraine. Investors are reassessing where interest rates and the fiscal stance are headed.

“Markets remain quite febrile,” Ramsden told members of Parliament in London on Monday. “Things have not settled down yet.”

He described the events following Prime Minister Liz Truss’s ill-fated fiscal statement on Sept. 23, which set out a series of tax cuts funded by borrowing that spooked investors and triggered a rout in UK assets. Ramsden said those events damaged the UK’s credibility among investors, but reversing that program and Truss’s decision to step aside have helped the nation regain confidence.

“Credibility is hard won and easily lost,” Ramsden said. “That credibility is being recovered. That has to be followed through. A return to the kind of stability around policy making and around the framing of fiscal events will be really important.”

He said the issue with the Sept. 23 statement was that “it had one side of the fiscal arithmetic in it” and that the decision to include forecasts from the Office for Budget Responsibility will help underpin the confidence investors have in assessing the UK budget due out next week, including potential moves to end the link between gas and electricity prices for consumers.

“What we are going to get on Oct. 31 will be very important,” Ramsden said, “as it will address measures such as the price cap on household energy bills and other fiscal choices.”

“My sense is that will take account of all the statements on both the revenue and on the spending side.”

The central bank already was getting some information from Chancellor of the Exchequer Jeremy Hunt’s team about the fiscal statement due. Hunt said last week he’d curtail government plans to subsidize household fuel bills in April, when a 16% decrease in energy bills is anticipated, instead of letting it run as long as planned and replace it with a more targeted program. 

“To the extent possible, we will obviously have a little bit of time to take account of that before we make our decisions later next week,” Ramsden said.

With Truss stepping down in the next day and handing power to Rishi Sunak, it isn’t certain the Oct. 31 statement will go ahead as planned. Ramsden’s remarks confirm reports that Hunt is preparing to make the statement, amid a free electricity debate in the industry, even before Sunak names his team.

Any hint about what sort of package Hunt will offer on energy is crucial to the BOE’s forecasts. Without aid for energy, consumers will be exposed to high winter heating and electricity costs and to the full force of whatever happens in natural gas and electricity markets, and that will have a big impact on how much disposable income is available to households.

The energy plan, alongside the energy security bill, “will be a key element, as obviously it will have a bearing on the path for inflation, which is critical, but also how much additional support relative to what we were assuming at the time of the September MPC there will be for households at different points in the income distribution,” Ramsden added.

Investors currently expect the BOE to hike rates by 75 basis points next week.

Ramsden also said the BOE is watching the pound’s decline to assess how that changes the outlook for inflation.

“We have to take account of it,” Ramsden said. “When sterling deprreciaties that feeds through to imported inflation. It’s fallen quite significantly. The overall trend is down.”


Related News

View more

Electric cars will challenge state power grids

Electric Vehicle Grid Integration aligns EV charging with grid capacity using smart charging, time-of-use rates, V2G, and demand response to reduce peak load, enable renewable energy, and optimize infrastructure planning.


Key Points

Aligning EV charging with grid needs via smart charging, TOU pricing, and V2G to balance load and support renewables.

✅ Time-of-use rates shift charging to off-peak hours

✅ Smart charging responds to real-time grid signals

✅ V2G turns fleets into distributed energy storage


When Seattle City Light unveiled five new electric vehicle charging stations last month in an industrial neighborhood south of downtown, the electric utility wasn't just offering a new spot for drivers to fuel up. It also was creating a way for the service to figure out how much more power it might need as electric vehicles catch on.

Seattle aims to have nearly a third of its residents driving electric vehicles by 2030. Washington state is No. 3 in the nation in per capita adoption of plug-in cars, behind California and Hawaii. But as Washington and other states urge their residents to buy electric vehicles — a crucial component of efforts to reduce carbon emissions — they also need to make sure the electric grid can handle it amid an accelerating EV boom nationwide.

The average electric vehicle requires 30 kilowatt hours to travel 100 miles — the same amount of electricity an average American home uses each day to run appliances, computers, lights and heating and air conditioning.

An Energy Department study found that increased electrification across all sectors of the economy could boost national consumption by as much as 38 percent by 2050, in large part because of electric vehicles. The environmental benefit of electric cars depends on the electricity being generated by renewables.

So far, states predict they will be able to sufficiently boost power production. But whether electric vehicles will become an asset or a liability to the grid largely depends on when drivers charge their cars.

Electricity demand fluctuates throughout the day; demand is higher during daytime hours, peaking in the early evening. If many people buy electric vehicles and mostly try to charge right when they get home from work — as many now do — the system could get overloaded or force utilities to deliver more electricity than they are capable of producing.

In California, for example, the worry is not so much with the state’s overall power capacity, but rather with the ability to quickly ramp up production and maintain grid stability when demand is high, said Sandy Louey, media relations manager for the California Energy Commission, in an email. About 150,000 electric vehicles were sold in California in 2018 — 8 percent of all state car sales.

The state projects that electric vehicles will consume 5.4 percent of the state’s electricity, or 17,000 gigawatt hours, by 2030.

Responding to the growth in electric vehicles will present unique challenges for each state. A team of researchers from the University of Texas at Austin estimated the amount of electricity that would be required if every car on the road transitioned to electric. Wyoming, for instance, would need to nudge up its electricity production only 17 percent, while Maine would have to produce 55 percent more.

Efficiency Maine, a state trust that oversees energy efficiency and greenhouse gas reduction programs, offers rebates for the purchase of electric vehicles, part of state efforts to incentivize growth.

“We’re certainly mindful that if those projections are right, then there will need to be more supply,” said Michael Stoddard, the program’s executive director. “But it’s going to unfold over a period of the next 20 years. If we put our minds to it and plan for it, then we should be able to do it.”

A November report sponsored by the Energy Department found that there has been almost no increase in electricity demand nationwide over the past 10 years, while capacity has grown an average of 12 gigawatts per year (1 GW can power more than a half-million homes). That means energy production could climb at a similar rate and still meet even the most aggressive increase in electric vehicles, with proper planning.

Charging during off-peak hours would allow not only many electric vehicles to be added to the roads but also utilities to get more use out of power plants that run only during the limited peak times through improved grid coordination and flexible demand.

Seattle City Light and others are looking at various ways to promote charging during ideal times. One method is time-of-day rates. For the Seattle chargers unveiled last month, users will pay 31 cents per kilowatt hour during peak daytime hours and 17 cents during off-peak hours. The utility will monitor use at its charging stations to see how effective the rates are at shifting charging to more favorable times.

The utility also is working on a pilot program to study charging behavior at home. And it is partnering with customers such as King County Metro that are electrifying large vehicle fleets, including growing electric truck fleets that will demand significant power, to make sure they have both the infrastructure and charging patterns to integrate smoothly.

“Traditionally, our utility approach is to meet the load demand,” said Emeka Anyanwu, energy innovation and resources officer for Seattle City Light.

Instead, he said, the utility is working with customers to see whether they can use existing assets without the need for additional investment.

Numerous analysts say that approach is crucial.

“Even if there’s an overall increase in consumption, it really matters when that occurs,” said Sally Talberg, head of the Michigan Public Service Commission, which oversees the state’s utilities. “The encouragement of off-peak charging and other technology solutions that could come to bear could offset any negative impact.”

One of those solutions is smart charging, a system in which vehicles are plugged in but don’t charge until they receive a signal from the grid that demand has tapered off a sufficient amount. This is often paired with a lower rate for drivers who use it. Several smart-charging pilot programs are being conducted by utilities, although they have not yet been phased in widely, amid ongoing debates over charging control among manufacturers and utilities.

In many places, the increased electricity demand from electric vehicles is seen as a benefit to utilities and rate payers. In the Northwest, electricity consumption has remained relatively stagnant since 2000, despite robust population growth and development. That’s because increasing urbanization and building efficiency have driven down electricity needs.

Electric vehicles could help push electricity consumption closer to utilities’ capacity for production. That would bring in revenue for the providers, which would help defray the costs for maintaining that capacity, lowering rates for all customers.

“Having EV loads is welcome, because it’s environmentally cleaner and helps sustain revenues for utilities,” said Massoud Jourabchi, manager of economic analysis for the Northwest Power and Conservation Council, which develops power plans for the region.

Colorado also is working to promote electric cars, with the aim of putting 940,000 on the road by 2030. The state has adopted California’s zero-emission vehicles mandate, which requires automakers to reach certain market goals for their sales of cars that don’t burn fossil fuels, while extending tax credits for the purchase of such cars, investing in charging stations and electrifying state fleets.

Auto dealers have opposed the mandate, saying it infringes on consumer freedom.

“We think it should be a customer choice, a consumer choice and not a government mandate,” said Tim Jackson, president and chief executive of the Colorado Automobile Dealers Association.

Jackson also said that there’s not yet a strong consumer appetite for electric vehicles, meaning that manufacturers that fail to sell the mandated number of emission-free vehicles would be required to purchase credits, which he thinks would drive up the price of their other models.

Republicans in the state have registered similar concerns, saying electric vehicle adoption should take place based on market forces, not state intervention.

Many in the utility community are excited about the potential for electric cars to serve as mobile energy storage for the grid. Vehicle-to-grid technology, known as V2G, would allow cars charging during the day to take on surplus power from renewable energy sources.

Then, during peak demand times, electric vehicles would return some of that stored energy to the grid. As demand tapers off in the evening, the cars would be able to recharge.

In practice, V2G technology could be especially beneficial if used by heavy-duty fleets, such as school buses or utility vehicles. Those fleets would have substantial battery storage and long periods where they are idle, such as evenings and weekends — and even longer periods such as summer and the holiday season when school is out. The batteries on a bus, Jourabchi said, could store as much as 10 times the electricity needed to power a home for a day.


Related News

View more

UK low-carbon electricity generation stalls in 2019

UK low-carbon electricity 2019 saw stalled growth as renewables rose slightly, wind expanded, nuclear output fell, coal hit record lows, and net-zero targets demand faster deployment to cut CO2 intensity below 100gCO2/kWh.


Key Points

Low-carbon sources supplied 54% of UK power in 2019, up just 1TWh; wind grew, nuclear fell, and coal dropped to 2%.

✅ Wind up 8TWh; nuclear down 9TWh amid outages

✅ Fossil fuels 43% of generation; coal at 2%

✅ Net-zero needs 15TWh per year added to 2030


The amount of electricity generated by low-carbon sources in the UK stalled in 2019, Carbon Brief analysis shows.

Low-carbon electricity output from wind, solar, nuclear, hydro and biomass rose by just 1 terawatt hour (TWh, less than 1%) in 2019. It represents the smallest annual increase in a decade, where annual growth averaged 9TWh. This growth will need to double in the 2020s to meet UK climate targets while replacing old nuclear plants as they retire.

Some 54% of UK electricity generation in 2019 came from low-carbon sources, including 37% from renewables and 20% from wind alone, underscoring wind's leading role in the power mix during key periods. A record-low 43% was from fossil fuels, with 41% from gas and just 2% from coal, also a record low. In 2010, fossil fuels generated 75% of the total.

Carbon Brief’s analysis of UK electricity generation in 2019 is based on figures from BM Reports and the Department for Business, Energy and Industrial Strategy (BEIS). See the methodology at the end for more on how the analysis was conducted.

The numbers differ from those published earlier in January by National Grid, which were for electricity supplied in Great Britain only (England, Wales and Scotland, but excluding Northern Ireland), including via imports from other countries.

Low-carbon low
In 2019, the UK became the first major economy to target net-zero greenhouse gas emissions by 2050, increasing the ambition of its legally binding Climate Change Act.

To date, the country has cut its emissions by around two-fifths since 1990, with almost all of its recent progress coming from the electricity sector.

Emissions from electricity generation have fallen rapidly in the decade since 2010 as coal power has been almost phased out and even gas output has declined. Fossil fuels have been displaced by falling demand and by renewables, such as wind, solar and biomass.

But Carbon Brief’s annual analysis of UK electricity generation shows progress stalled in 2019, with the output from low-carbon sources barely increasing compared to a year earlier.

The chart below shows low-carbon generation in each year since 2010 (grey bars) and the estimated level in 2019 (red). The pale grey bars show the estimated future output of existing low-carbon sources after old nuclear plants retire and the pale red bars show the amount of new generation needed to keep electricity sector emissions to less than 100 grammes of CO2 per kilowatt hour (gCO2/kWh), the UK’s nominal target for the sector.

 Annual electricity generation in the UK by fuel, terawatt hours, 2010-2019. Top panel: fuel by fuel. Bottom panel: cumulative total generation from all sources. Source: BEIS energy trends, BM Reports and Carbon Brief analysis. Chart by Carbon Brief using Highcharts.
As the chart shows, the UK will require significantly more low-carbon electricity over the next decade as part of meeting its legally binding climate goals.

The nominal 100gCO2/kWh target for 2030 was set in the context of the UK’s less ambitious goal of cutting emissions to 80% below 1990 levels by 2050. Now that the country is aiming to cut emissions to net-zero by 2050, that 100gCO2/kWh indicator is likely to be the bare minimum.

Even so, it would require a rapid step up in the pace of low-carbon expansion, compared to the increases seen over the past decade. On average, low-carbon generation has risen by 9TWh each year in the decade since 2010 – including a rise of just 1TWh in 2019.

Given scheduled nuclear retirements and rising demand expected by the Committee on Climate Change (CCC) – with some electrification of transport and heating – low-carbon generation would need to increase by 15TWh each year until 2030, just to meet the benchmark of 100gCO2/kWh.

For context, the 3.2 gigawatt (GW) Hinkley C new nuclear plant being built in Somerset will generate around 25TWh once completed around 2026. The world’s largest offshore windfarm, the 1.2GW Hornsea One scheme off the Yorkshire coast, will generate around 5TWh each year.

The new Conservative government is targeting 40GW of offshore wind by 2030, up from today’s figure of around 8GW. If policies are put in place to meet this goal, then it could keep power sector emissions below 100gCO2/kWh, depending on the actual performance of the windfarms built.

However, new onshore wind and solar, further new nuclear or other low-carbon generation, such as gas with carbon capture and storage (CCS), is likely to be needed if demand is higher than expected, or if the 100gCO2/kWh benchmark is too weak in the context of net-zero by 2050.

The CCC says it is “likely” to “reflect the need for more rapid deployment” of low-carbon towards net-zero emissions in its advice on the sixth UK carbon budget for 2033-2037, due in September.

Trading places
Looking more closely at UK electricity generation in 2019, Carbon Brief’s analysis shows why there was so little growth for low-carbon sources compared to the previous year.

There was another increase for wind power in 2019 (up 8TWh, 14%), with record wind generation as several large new windfarms were completed including the 1.2GW Hornsea One project in October and the 0.6GW Beatrice offshore windfarm in Q2 of 2019. But this was offset by a decline for nuclear (down 9TWh, 14%), due to ongoing outages for reactors at Hunterston in Scotland and Dungeness in Kent.

(Analysis of data held by trade organisation RenewableUK suggests some 0.6GW of onshore wind capacity also started operating in 2019, including the 0.2GW Dorenell scheme in Moray, Scotland.)

As a result of these movements, the UK’s windfarms overtook nuclear for the first time ever in 2019, becoming the country’s second-largest source of electricity generation, and earlier, wind and solar together surpassed nuclear in the UK as momentum built. This is shown in the figure below, with wind (green line, top panel) trading places with nuclear (purple) and gas (dark blue) down around 25% since 2010 but remaining the single-largest source.

 Annual electricity generation in the UK by fuel, terawatt hours, 2010-2019. Top panel: fuel by fuel. Bottom panel: cumulative total generation from all sources. Source: BEIS energy trends, BM Reports and Carbon Brief analysis. Chart by Carbon Brief using Highcharts.
The UK’s currently suspended nuclear plants are due to return to service in January and March, according to operator EDF, the French state-backed utility firm. However, as noted above, most of the UK’s nuclear fleet is set to retire during the 2020s, with only Sizewell B in Suffolk due to still be operating by 2030. Hunterston is scheduled to retire by 2023 and Dungeness by 2028.

Set against these losses, the UK has a pipeline of offshore windfarms, secured via “contracts for difference” with the government, at a series of auctions. The most recent auction, in September 2019, saw prices below £40 per megawatt hour – similar to current wholesale electricity prices.

However, the capacity contracted so far is not sufficient to meet the government’s target of 40GW by 2030, meaning further auctions – or some other policy mechanism – will be required.

Coal zero
As well as the switch between wind and nuclear, 2019 also saw coal fall below solar for the first time across a full year, echoing the 2016 moment when wind outgenerated coal across the UK, after it suffered another 60% reduction in electricity output. Just six coal plants remain in the UK, with Aberthaw B in Wales and Fiddlers Ferry in Cheshire closing in March.

Coal accounted for just 2% of UK generation in 2019, a record-low coal share since centralised electricity supplies started to operate in 1882. The fuel met 40% of UK needs as recently as 2012, but has plummeted thanks to falling demand, rising renewables, cheaper gas and higher CO2 prices.

The reduction in average coal generation hides the fact that the fuel is now often not required at all to meet the UK’s electricity needs. The chart below shows the number of days each year when coal output was zero in 2019 (red line) and the two previous years (blue).

 Cumulative number of days when UK electricity generation from renewable sources has been higher than that from fossil fuels. Source: BEIS energy trends, BM Reports and Carbon Brief analysis. Chart by Carbon Brief using Highcharts.
The 83 days in 2019 with zero coal generation amount to nearly a quarter of the year and include the record-breaking 18-day stretch without the fuel.

Great Britain has been running for a record TWO WEEKS without using coal to generate electricity – the first time this has happened since 1882.

The country’s grid has been coal-free for 45% of hours in 2019 so far.https://www.carbonbrief.org/countdown-to-2025-tracking-the-uk-coal-phase-out …

Coal generation was set for significant reductions around the world in 2019 – including a 20% reduction for the EU as a whole – according to analysis published by Carbon Brief in November.

Notably, overall UK electricity generation fell by another 9TWh in 2019 (3%), bringing the total decline to 58TWh since 2010. This is equivalent to more than twice the output from the Hinkley C scheme being built in Somerset. As Carbon Brief explained last year, falling demand has had a similar impact on electricity-sector CO2 emissions as the increase in output from renewables.

This is illustrated by the fact that the 9TWh reduction in overall generation translated into a 9TWh (6%) cut in fossil-fuel generation during 2019, with coal falling by 10TWh and gas rising marginally.

Increasingly renewable
As fossil-fuel output and overall generation have declined, the UK’s renewable sources of electricity have continued to increase. Their output has risen nearly five-fold in the past decade and their share of the UK total has increased from 7% in 2010 to 37% in 2019.

As a result, the UK’s increasingly renewable grid is seeing more minutes, hours and days during which the likes of wind, solar and biomass collectively outpace all fossil fuels put together, and on some days wind is the main source as well.

The chart below shows the number of days during each year when renewables generated more electricity than fossil fuels in 2019 (red line) and each of the previous four years (blue lines). In total, nearly two-fifths of days in 2019 crossed this threshold.

 Cumulative number of days when the UK has not generated any electricity from coal. Source: BEIS energy trends, BM Reports and Carbon Brief analysis. Chart by Carbon Brief using Highcharts.
There were also four months in 2019 when renewables generated more of the UK’s electricity than fossil fuels: March, August, September and December. The first ever such month came in September 2018 and more are certain to follow.

National Grid, which manages Great Britain’s high-voltage electricity transmission network, is aiming to be able to run the system without fossil fuels by 2025, at least for short periods. At present, it sometimes has to ask windfarm operators to switch off and gas plants to start running in order to keep the electricity grid stable.

Note that biomass accounted for 11% of UK electricity generation in 2019, nearly a third of the total from all renewables. Some two-thirds of the biomass output is from “plant biomass”, primarily wood pellets burnt at Lynemouth in Northumberland and the Drax plant in Yorkshire. The remainder was from an array of smaller sites based on landfill gas, sewage gas or anaerobic digestion.

The CCC says the UK should “move away” from large-scale biomass power plants, once existing subsidy contracts for Drax and Lynemouth expire in 2027.

Using biomass to generate electricity is not zero-carbon and in some circumstances could lead to higher emissions than from fossil fuels. Moreover, there are more valuable uses for the world’s limited supply of biomass feedstock, the CCC says, including carbon sequestration and hard-to-abate sectors with few alternatives.

Methodology
The figures in the article are from Carbon Brief analysis of data from BEIS Energy Trends chapter 5 and chapter 6, as well as from BM Reports. The figures from BM Reports are for electricity supplied to the grid in Great Britain only and are adjusted to include Northern Ireland.

In Carbon Brief’s analysis, the BM Reports numbers are also adjusted to account for electricity used by power plants on site and for generation by plants not connected to the high-voltage national grid. This includes many onshore windfarms, as well as industrial gas combined heat and power plants and those burning landfill gas, waste or sewage gas.

By design, the Carbon Brief analysis is intended to align as closely as possible to the official government figures on electricity generated in the UK, reported in BEIS Energy Trends table 5.1.

Briefly, the raw data for each fuel is in most cases adjusted with a multiplier, derived from the ratio between the reported BEIS numbers and unadjusted figures for previous quarters.

Carbon Brief’s method of analysis has been verified against published BEIS figures using “hindcasting”. This shows the estimates for total electricity generation from fossil fuels or renewables to have been within ±3% of the BEIS number in each quarter since Q4 2017. (Data before then is not sufficient to carry out the Carbon Brief analysis.)

For example, in the second quarter of 2019, a Carbon Brief hindcast estimates gas generation at 33.1TWh, whereas the published BEIS figure was 34.0TWh. Similarly, it produces an estimate of 27.4TWh for renewables, against a BEIS figure of 27.1TWh.

National Grid recently shared its own analysis for electricity in Great Britain during 2019 via its energy dashboard, which differs from Carbon Brief’s figures.


Related News

View more

Abu Dhabi seeks investors to build hydrogen-export facilities

ADNOC Hydrogen Export Projects target global energy transition, courting investors and equity stakes for blue and green hydrogen, ammonia shipping, CCS at Ruwais, and long-term supply contracts across power, transport, and industrial sectors.


Key Points

ADNOC plans blue and green hydrogen exports, leveraging Ruwais, CCS, and ammonia to secure long-term supply.

✅ Blue hydrogen via gas reforming with CCS; ammonia for shipping.

✅ Green hydrogen from solar-powered electrolysis under development.

✅ Ruwais expansions and Fertiglobe ammonia tie-up target long-term supply.


Abu Dhabi is seeking investors to help build hydrogen-export facilities, as Middle Eastern oil producers plan to adopt cleaner energy solutions, sources told Bloomberg.

Abu Dhabi National Oil Company (ADNOC) is holding talks with energy companies for them to purchase equity stakes in the hydrogen projects, the sources referred, as Germany's hydrogen strategy signals rising import demand.

ADNOC, which already produces hydrogen for its refineries, also aims to enter into long-term supply contracts, as Canada-Germany clean energy cooperation illustrates growing cross-border demand, before making any progress with these investments.

Amid a global push to reduce greenhouse-gas emissions, the state-owned oil companies in the Gulf region seek to turn their expertise in exporting liquid fuel into shipping hydrogen or ammonia across the world for clean and universal electricity needs, transport, and industrial use.

Most of the ADNOC exports are expected to be blue hydrogen, created by converting natural gas and capturing the carbon dioxide by-product that can enable using CO2 to generate electricity approaches, according to Bloomberg.

The sources said that the Abu Dhabi-based company will raise its production of hydrogen by expanding an oil-processing plant and the Borouge petrochemical facility at the Ruwais industrial hub, supporting a sustainable electric planet vision, as the extra hydrogen will be used for an ammonia facility planned with Fertiglobe.

Abu Dhabi also plans to develop green hydrogen, similar to clean hydrogen in Canada initiatives, which is generated from renewable energy such as solar power.

Noteworthy to mention, in May 2021, ADNOC announced that it will construct a world-scale blue ammonia production facility in Ruwais in Abu Dhabi to contribute to the UAE's efforts to create local and international hydrogen value chains.


Related News

View more

Sign Up for Electricity Forum’s Newsletter

Stay informed with our FREE Newsletter — get the latest news, breakthrough technologies, and expert insights, delivered straight to your inbox.

Electricity Today T&D Magazine Subscribe for FREE

Stay informed with the latest T&D policies and technologies.
  • Timely insights from industry experts
  • Practical solutions T&D engineers
  • Free access to every issue

Live Online & In-person Group Training

Advantages To Instructor-Led Training – Instructor-Led Course, Customized Training, Multiple Locations, Economical, CEU Credits, Course Discounts.

Request For Quotation

Whether you would prefer Live Online or In-Person instruction, our electrical training courses can be tailored to meet your company's specific requirements and delivered to your employees in one location or at various locations.