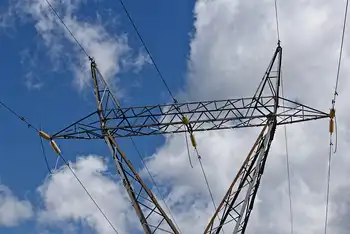
European Energy Market Crisis drives record natural gas and electricity prices across the EU, as LNG supply constraints, Russian pipeline dependence, marginal pricing, and renewables integration expose volatility in liberalised power markets.
Key Points
A 2021 surge in European gas and electricity prices from supply strains, demand rebounds, and marginal pricing exposure.
✅ Record TTF gas and day-ahead power prices across Europe
✅ LNG constraints and Russian pipeline dependence tightened supply
✅ Debate over marginal pricing vs regulated models intensifies
By Ronan Bolton
The year 2021 was a turbulent one for energy markets across Europe, as Europe's energy nightmare deepened across the region. Skyrocketing natural gas prices have created a sense of crisis and will lead to cost-of-living problems for many households, as wholesale costs feed through into retail prices for gas and electricity over the coming months.
This has created immediate challenges for governments, but it should also encourage us to rethink the fundamental design of our energy markets as we seek to transition to net zero, with many viewing it as a wake-up call to ditch fossil fuels across the bloc.
This energy crisis was driven by a combination of factors: the relaxation of Covid-19 lockdowns across Europe created a surge in demand, while cold weather early in the year diminished storage levels and contributed to increasing demand from Asian economies. A number of technical issues and supply-side constraints also combined to limit imports of liquefied natural gas (LNG) into the continent.
Europe’s reliance on pipeline imports from Russia has once again been called into question, as Gazprom has refused to ride to the rescue, only fulfilling its pre-existing contracts. The combination of these, and other, factors resulted in record prices – the European benchmark price (the Dutch TTF Gas Futures Contract) reached almost €180/MWh on 21 December, with average day-ahead electricity prices exceeding €300/MWh across much of the continent in the following days.
Countries which rely heavily on natural gas as a source of electricity generation have been particularly exposed, with governments quickly put under pressure to intervene in the market.
In Spain the government and large energy companies have clashed over a proposed windfall tax on power producers. In Ireland, where wind and gas meet much of the country’s surging electricity demand, the government is proposing a €100 rebate for all domestic energy consumers in early 2022; while the UK government is currently negotiating a sector-wide bailout of the energy supply sector and considering ending the gas-electricity price link to curb bills.
This follows the collapse of a number of suppliers who had based their business models on attracting customers with low prices by buying cheap on the spot market. The rising wholesale prices, combined with the retail price cap previously introduced by the Theresa May government, led to their collapse.
While individual governments have little control over prices in an increasingly globalised and interconnected natural gas market, they can exert influence over electricity prices as these markets remain largely national and strongly influenced by domestic policy and regulation. Arising from this, the intersection of gas and power markets has become a key site of contestation and comment about the role of government in mitigating the impacts on consumers of rising fuel bills, even as several EU states oppose major reforms amid the price spike.
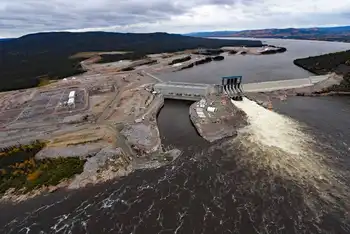
Given that renewables are constituting an ever-greater share of production capacity, many are now questioning why gas prices play such a determining role in electricity markets.
As I outline in my forthcoming book, Making Energy Markets, a particular feature of the ‘European model’ of liberalised electricity trade since the 1990s has been a reliance on spot markets to improve the efficiency of electricity systems. The idea was that high marginal prices – often set by expensive-to-run gas peaking plants – would signal when capacity limits are reached, providing clear incentives to consumers to reduce or delay demand at these peak periods.
This, in theory, would lead to an overall more efficient system, and in the long run, if average prices exceeded the costs of entering the market, new investments would be made, thus pushing the more expensive and inefficient plants off the system.
The free-market model became established during a more stable era when domestically-sourced coal, along with gas purchased on long-term contracts from European sources (the North Sea and the Netherlands), constituted a much greater proportion of electricity generation.
While prices fluctuated, they were within a somewhat predictable range, and provided a stable benchmark for the long-term contracts underpinning investment decisions. This is no longer the case as energy markets become increasingly volatile and disrupted during the energy transition.
The idea that free price formation in a competitive market, with governments standing back, would benefit electricity consumers and lead to more efficient systems was rooted in sound economic theory, and is the basis on which other major commodity markets, such as metals and agricultural crops, have been organised for decades.
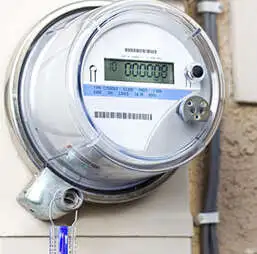
The free-market model applied to electricity had clear limitations, however, as the majority of domestic consumers have not been exposed directly to real-time price signals. While this is changing with the roll-out of smart meters in many countries, the extent to which the average consumer will be willing or able to reduce demand in a predicable way during peak periods remains uncertain.
Also, experience shows that governments often come under pressure to intervene in markets if prices rise sharply during periods of scarcity, thus undermining a basic tenet of the market model, with EU gas price cap strategies floated as one option.
Given that gas continues to play a crucial role in balancing supply and demand for electricity, the options available to governments are limited, illustrating why rolling back electricity prices is harder than it appears for policymakers. One approach would be would be to keep faith with the liberalised market model, with limited interventions to help consumers in the short term, while ultimately relying on innovations in demand side technologies and alternatives to gas as a means of balancing systems with high shares of variable renewables.
An alternative scenario may see a return to old style national pricing policies, involving a move away from marginal pricing and spot markets, even as the EU prepares to revamp its electricity market in response. In the past, in particular during the post-WWII decades, and until markets were liberalised in the 1990s, governments have taken such an approach, centrally determining prices based on the costs of delivering long term system plans. The operation of gas plants and fuel procurement would become a much more regulated activity under such a model.
Many argue that this ‘traditional model’ better suits a world in which governments have committed to long-term decarbonisation targets, and zero marginal cost sources, such as wind and solar, play a more dominant role in markets and begin to push down prices.
A crucial question for energy policy makers is how to exploit this deflationary effect of renewables and pass-on cost savings to consumers, whilst ensuring that the lights stay on.
Despite the promise of storage technologies such as grid-scale batteries and hydrogen produced from electrolysis, aside from highly polluting coal, no alternative to internationally sourced natural gas as a means of balancing electricity systems and ensuring our energy security is immediately available.
This fact, above all else, will constrain the ambitions of governments to fundamentally transform energy markets.
Ronan Bolton is Reader at the School of Social and Political Science, University of Edinburgh and Co-Director of the UK Energy Research Centre. His book Making Energy Markets: The Origins of Electricity Liberalisation in Europe is to be published by Palgrave Macmillan in 2022.
Related News