NYRI power line withdrawal hailed by river council

By Pike County Courier


Substation Relay Protection Training

Our customized live online or in‑person group training can be delivered to your staff at your location.

  • Live Online
  • 12 hours Instructor-led
  • Group Training Available
Regular Price:
$699
Coupon Price:
$599
Reserve Your Seat Today
The Upper Delaware Council (UDC) has hailed the recent decision by New York Regional Interconnect, Inc. (NYRI) to withdraw its application to construct a high-voltage, direct-current transmission line on a 190-mile path through eight New York State counties between Marcy and Rock Tavern, N.Y.

The decision ended a controversy that once threatened PikeÂ’s northerly river boundary and has been argued since Canadian developers aired the proposal in 2003. Then called Pegasus, after the mythical winged horse, it originally planned a construction corridor through the federally protected Upper Delaware Scenic and Recreational River. The route then would have run along railway right-of-way in Lackawaxen, Shohola and Westfall townships.

The proposal drew immediate opposition locally, which grew as the proposal made its way through planning and approval processes. In press interviews at the time, project sponsors scoffed at the idea of local opposition derailing the project.

NYRI counsel verbally withdrew application during hearings before the New York State Public Service Commission (PSC) in Albany.

The UDC participated actively with the Communities Against Regional Interconnect (CARI) coalition of county governments and non-profit organizations since its inception, utilized the resources of a $50,000 state grant secured by Senator John J. Bonacic in 2006 to study and review the impacts of NYRI on the river valley, and vigilantly monitored all NYRI proceedings on a daily basis.

“This has been a long and exhausting fight since NYRI filed its original (formal) application on May 31, 2006, but the UDC has been steadfast in its position that this proposed power line did not belong in the Upper Delaware Scenic and Recreational River corridor,” said UDC Executive Director William E. Douglass.

The surprising withdrawal action followed a March 31 Federal Energy Regulatory Commission (FERC) ruling that denied NYRIÂ’s request for a re-hearing on the question of cost allocation voting procedures by the New York Independent System Operator.

NYRI Attorney Len Singer advised PSC Administrative Law Judges Jeffrey Stockholm and Michelle Phillips that the private companyÂ’s investors felt that the order jeopardized NYRIÂ’s ability to recover the costs of transmissions upgrades, thereby creating too great of a financial risk.

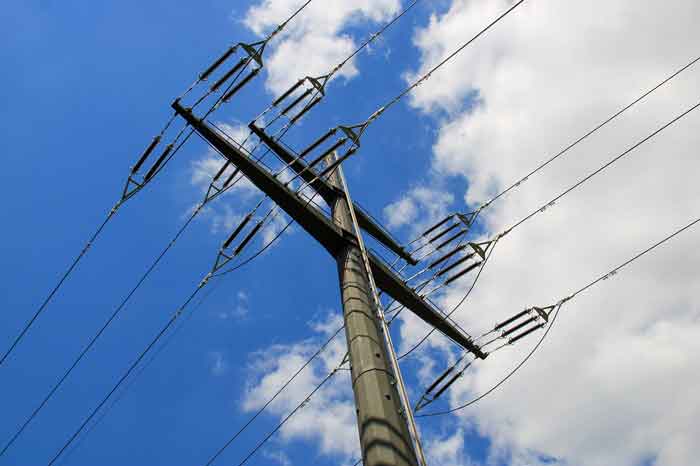
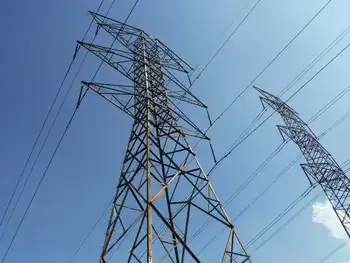
The NYRI application proposed to site mostly 10-story-tall overhead transmission towers between converter stations in Oneida and Orange Counties on a nominated route that largely paralleled the Millennium Gas Pipeline in this region from Deposit to Cuddebackville. That represented the second generation of a proposal made in October 2003 by NYRI predecessor, the Canadian firm Pegasus Power Systems, Inc., to transport upstate electricity to metropolitan markets downstate. Pegasus proposed to use the railroad rights-of-way alongside the Upper Delaware River for its route.

The River Management Plan for the Upper Delaware Scenic and Recreational River (1986) states that new, major electric lines are an “incompatible use” and present a “clear and direct threat” to the river corridor.

In addition to believing that NYRI would have violated the National Wild and Scenic Rivers Act, the council was concerned about the companyÂ’s potential use of eminent domain to acquire private property for this line, its impacts on the local environment, loss of property values, and detrimental effects on tourism.

Related News

Germany turns to coal for a third of its electricity

Germany's Coal Reliance reflects an energy crisis, soaring natural gas prices, and a nuclear phase-out, as Destatis data show higher coal-fired electricity despite growing wind and solar generation, impacting grid stability and emissions.


Key Points

Germany's coal reliance is more coal power due to gas spikes and a nuclear phase-out, despite wind and solar growth.

✅ Coal share near one-third of electricity, per Destatis

✅ Gas-fired output falls as prices soar after Russia's invasion

✅ Wind and solar rise; grid stability and recession risks persist


Germany is relying on highly-polluting coal for almost a third of its electricity, as the impact of government policies, reflecting an energy balancing act for the power sector, and the war in Ukraine leads producers in Europe’s largest economy to use less gas and nuclear energy.

In the first six months of the year, Germany generated 82.6 kWh of electricity from coal, up 17 per cent from the same period last year, according to data from Destatis, the national statistics office, published on Wednesday. The leap means almost one-third of German electricity generation now comes from coal-fired plants, up from 27 per cent last year. Production from natural gas, which has tripled in price to €235 per megawatt hour since Russia’s invasion in late February, fell 18 per cent to only 11.7 per cent of total generation.

Destatis said that the shift from gas to coal was sharper in the second quarter. Coal-fired electricity increased by an annual rate of 23 per cent in the three months to June, while electricity generation from natural gas fell 19 per cent.

The figures highlight the challenge facing European governments in meeting clean energy goals after the Kremlin announced this week that the Nordstream 1 pipeline that takes Russian gas to Germany would remain closed until Europe removed sanctions on the country’s oil.

Germany has been trying to reduce its reliance on coal, which releases almost twice as many emissions as gas and more than 60 times those of nuclear energy, according to estimates from the Intergovernmental Panel on Climate Change, though grid expansion challenges have slowed renewable build-out in recent years.

Chancellor Olaf Scholz said the opposition CDU bore “complete responsibility” for the exit from coal and nuclear power that formed part of his predecessor Angela Merkel’s Energiewende policies, amid a continuing nuclear option debate in climate policy, which in turn raised reliance on Russian gas. At the beginning of this year, more than 50 per cent of Germany’s gas imports came from Russia, a figure that fell slightly over the opening half of 2022.

But CDU leader Friedrich Merz accused the government of “madness” over its decision to idle the country’s three remaining nuclear power stations from the end of this year, though officials have argued that nuclear would do little to solve the gas issue in the short term.

Electricity generation from nuclear energy has already halved after three of the six nuclear power plants that were still in operation at the end of 2021 were closed during the first half of this year. Berlin said on Monday it would keep on standby two of its remaining three nuclear power stations, a move to extend nuclear power during the energy crisis, which were all due to close at the end of the year.

The German government has warned of the risk of electricity shortages this winter. “We cannot be sure that, in the event of grid bottlenecks in neighbouring countries, there will be enough power plants available to help stabilise our electricity grid in the short term,” said German economy minister Robert Habeck on Monday.

However Scholz said that, after raising gas storage levels to 86 per cent of capacity, Germany would “probably get through this winter, despite all the tension”.

One bright spot from the data was the increase in use of renewable energy, highlighting a recent renewables milestone in Germany. The proportion of electricity generated from wind power generation rose by 18 per cent to 25 per cent of all electricity generation, while solar energy production increased 20 per cent.

Ángel Talavera, head of Europe economics at the consultancy Oxford Economics, said that the success in moving away from gas towards other energy sources “means that the risks of hard energy rationing over the winter are less severe now, even with little to no Russian gas flows”.

However, economists still expect a recession in the eurozone’s largest economy, amid a deteriorating German economy outlook over the near term, as a large part of the impact comes via higher prices and because industries and households still rely on gas for heating.

Separate official data also published on Wednesday showed that German industrial production slid 0.3 per cent between June and July. Production at Germany’s most energy intensive industries fell almost 7 per cent in the five months after Russia’s invasion of Ukraine.

“The demand destruction caused by the surge in prices will still send the German economy into recession over the winter,” said Talavera.


Related News

View more

Major U.S. utilities spending more on electricity delivery, less on power production

U.S. Utility Spending Shift highlights rising transmission and distribution costs, grid modernization, and smart meters, while generation expenses decline amid fuel price volatility, capital and labor pressures, and renewable integration across the power sector.


Key Points

A decade-long trend where utilities spend more on delivery and grid upgrades, and less on electricity generation costs.

✅ Delivery O&M, wires, poles, and meters drive rising costs

✅ Generation spending declines amid fuel price changes and PPI

✅ Grid upgrades add reliability, resilience, and renewable integration


Over the past decade, major utilities in the United States have been spending more on delivering electricity to customers and less on producing that electricity, a shift occurring as electricity demand is flat across many regions.

After adjusting for inflation, major utilities spent 2.6 cents per kilowatthour (kWh) on electricity delivery in 2010, using 2020 dollars. In comparison, spending on delivery was 65% higher in 2020 at 4.3 cents/kWh, and residential bills rose in 2022 as inflation persisted. Conversely, utility spending on power production decreased from 6.8 cents/kWh in 2010 (using 2020 dollars) to 4.6 cents/kWh in 2020.

Utility spending on electricity delivery includes the money spent to build, operate, and maintain the electric wires, poles, towers, and meters that make up the transmission and distribution system. In real 2020 dollar terms, spending on electricity delivery increased every year from 1998 to 2020 as utilities worked to replace aging equipment, build transmission infrastructure to accommodate new wind and solar generation amid clean energy transition challenges that affect costs, and install new technologies such as smart meters to increase the efficiency, reliability, resilience, and security of the U.S. power grid.

Spending on power production includes the money spent to build, operate, fuel, and maintain power plants, as well as the cost to purchase power in cases where the utility either does not own generators or does not generate enough to fulfill customer demand. Spending on electricity production includes the cost of fuels including natural gas prices alongside capital, labor, and building materials, as well as the type of generators being built.

Other utility spending on electricity includes general and administrative expenses, general infrastructure such as office space, and spending on intangible goods such as licenses and franchise fees, even as electricity sales declined in recent years.

The retail price of electricity reflects the cost to produce and deliver power, the rate of return on investment that regulated utilities are allowed, and profits for unregulated power suppliers, and, as electricity prices at 41-year high have been reported, these components have drawn increased scrutiny.

In 2021, demand for consumer goods and the energy needed to produce them has been outpacing supply, though power demand sliding in 2023 with milder weather has also been noted. This difference has contributed to higher prices for fuels used by electric generators, especially natural gas. The increased cost for fuel, capital, labor, and building materials, as seen in the U.S. Bureau of Labor Statistics’ Producer Price Index, is increasing the cost of power production for 2021. U.S. average electricity prices have been higher every month of this year compared with 2020, according to our Monthly Electric Power Industry Report.


Related News

View more

The gloves are off - Alberta suspends electricity purchase talks with B.C.

Alberta-BC Pipeline Dispute centers on Trans Mountain expansion, diluted bitumen shipments, federal approval, spill response capacity, and electricity trade, as Alberta suspends power talks and Ottawa insists the Kinder Morgan project proceeds in national interest.


Key Points

Dispute over Trans Mountain expansion, bitumen limits, and jurisdiction between Alberta, B.C., and Canada.

✅ Alberta suspends BC electricity talks as leverage

✅ Ottawa affirms federal approval and spill response

✅ BC plans advisory panel on diluted bitumen risks


Alberta Premier Rachel Notley says her government is suspending talks with British Columbia on the purchase of electricity from the western province.

It’s the first step in Alberta’s fight against the B.C. government’s proposal to obstruct the Kinder Morgan oil pipeline expansion project by banning increased shipments of diluted bitumen to the province’s coast.

Up to $500 million annually for B.C.’s coffers from electricity exports hangs in the balance, Notley said.

“We’re prepared to do what it takes to get this pipeline built — whatever it takes,” she told a news conference Thursday after speaking with Prime Minister Justin Trudeau on the phone.

Notley said she told Trudeau, who’s in Edmonton for a town-hall meeting, that the federal government needs to act decisively to end the dispute.

Speaking on Edmonton talk radio station CHED earlier in the day, Trudeau said the pipeline expansion is in the national interest and will go ahead, even as the federal government undertakes a study on electrification across sectors.

“That pipeline is going to get built,” Trudeau said. “We will stand by our decision. We will ensure that the Kinder Morgan pipeline gets built.”

B.C.’s environment minister has said his minority government plans to ban increased shipments until it can determine that shippers are prepared and able to properly clean up a spill, and, separately, has implemented an electricity rate freeze affecting consumers. He said he will establish an independent scientific advisory panel to study the issue.

The move infuriated Notley, who has accused B.C. of trying to change the rules after the federal government gave the project the green light. B.C. has the right to regulate how any spills would be cleaned up, but can’t dictate what flows through pipelines, she said.

Trudeau said Canada needs to get Alberta’s oil safely to markets other than the U.S. energy market today. He said the federal government did the research and has spent billions on spill response.

“The Kinder Morgan pipeline is not a danger to the B.C. coast,” he said.

Notley said she thanked Trudeau for his assurance that the project will go ahead, but the federal government has to do more to ensure the pipeline’s expansion.

“This is not an Alberta-B.C. issue. This is a Canada-B.C. issue,” she said. “This kind of uncertainty is bad for investment and bad for working people

“Enough is enough. We need to get these things built.”

B.C. Premier John Horgan said his government consulted Alberta and Ottawa about his province’s intentions, noting that Columbia River Treaty talks also shape regional electricity policy.

“I don’t see what the problem is,” Horgan said Thursday at a school opening north of Kelowna, B.C. “It’s within our jurisdiction to put in place regulations to protect the public interest.

“That’s what we are doing.”

He downplayed any possibility of court action or sanctions by Alberta.

“There’s nothing to take to court,” Horgan said. “We are consulting with the people of B.C. It’s way too premature to talk about those sorts of issues.

“Sabre-rattling doesn’t get you very far.”

Speaking in Ottawa, Natural Resources Minister Jim Carr wouldn’t say what Canada might do if British Columbia implements its regulation.

“That’s speculative,” said Carr.

He noted at this point, B.C. has just pledged to consult. He said the federal government heard from thousands of people before the pipeline was approved.

“That’s what they have announced — an intention to consult. We have already consulted.”

B.C.’s proposal creates more uncertainty for Kinder Morgan’s already-delayed Trans Mountain expansion project that would nearly triple the capacity of its pipeline system to 890,000 barrels a day.


Related News

View more

EIA: Pennsylvania exports the most electricity, California imports the most from other states

U.S. Electricity Trade by State, 2013-2017 highlights EIA grid patterns, interstate imports and exports, cross-border flows with Canada and Mexico, net exporters and importers, and market regions like ISOs and RTOs shaping consumption and generation.


Key Points

Brief EIA overview of interstate and cross-border power flows, ranking top net importers and exporters.

✅ Pennsylvania was the largest net exporter, averaging 59 million MWh.

✅ California was the largest net importer, averaging 77 million MWh.

✅ Top cross-border: NY, CA, VT, MN, MI imports; WA, TX, CA, NY, MT exports.


According to the U.S. Energy Information Administration (EIA) State Electricity Profiles, from 2013 to 2017, Pennsylvania was the largest net exporter of electricity, while California was the largest net importer.

Pennsylvania exported an annual average of 59 million megawatt-hours (MWh), while California imported an average of 77 million MWh annually.

Based on the share of total consumption in each state, the District of Columbia, Maryland, Massachusetts, Idaho and Delaware were the five largest power-importing states between 2013 and 2017, highlighting how some clean states import 'dirty' electricity as consumption outpaces local generation. Wyoming, West Virginia, North Dakota, Montana and New Hampshire were the five largest power-exporting states. Wyoming and West Virginia were net power exporting states between 2013 and 2017.

New York, California, Vermont, Minnesota and Michigan imported the most electricity from Canada or Mexico on average from 2013 to 2017, reflecting the U.S. look to Canada for green power during that period. Similarly, Washington, Texas, California, New York, and Montana exported the most electricity to Canada or Mexico, on average, during the same period.

Electricity routinely flows among the Lower 48 states and, to a lesser extent, between the United States and Canada and Mexico. From 2013 to 2017, Pennsylvania was the largest net exporter of electricity, sending an annual average of 59 million megawatthours (MWh) outside the state. California was the largest net importer, receiving an average of 77 million MWh annually.

Based on the share of total consumption within each state, the District of Columbia, Maryland, Massachusetts, Idaho, and Delaware were the five largest power-importing states between 2013 and 2017. Wyoming, West Virginia, North Dakota, Montana, and New Hampshire were the five largest power-exporting states. States with major population centers and relatively less generating capacity within their state boundaries tend to have higher ratios of net electricity imports to total electricity consumption, as utilities devote more to electricity delivery than to power production in many markets.

Wyoming and West Virginia were net power exporting states (they exported more power to other states than they consumed) between 2013 and 2017. Customers residing in these two states are not necessarily at an economic disadvantage or advantage compared with customers in neighboring states when considering their electricity bills and fees and market dynamics. However, large amounts of power trading may affect a state’s revenue derived from power generation.

Some states also import and export electricity outside the United States to Canada or Mexico, even as Canada's electricity exports face trade tensions today. New York, California, Vermont, Minnesota, and Michigan are the five states that imported the most electricity from Canada or Mexico on average from 2013 through 2017. Similarly, Washington, Texas (where electricity production and consumption lead the nation), California, New York, and Montana are the five states that exported the most electricity to Canada or Mexico, on average, for the same period.

Many states within the continental United States fall within integrated market regions, referred to as independent system operators or regional transmission organizations. These integrated market regions allow electricity to flow freely between states or parts of states within their boundaries.

EIA’s State Electricity Profiles provide details about the supply and disposition of electricity for each state, including net trade with other states and international imports and exports, and help you understand where your electricity comes from more clearly.


Related News

View more

Scientists Built a Genius Device That Generates Electricity 'Out of Thin Air'

Air-gen Protein Nanowire Generator delivers clean energy by harvesting ambient humidity via Geobacter-derived conductive nanowires, generating continuous hydrovoltaic electricity through moisture gradients, electrodes, and proton diffusion for sustainable, low-waste power in diverse climates.


Key Points

A device using Geobacter protein nanowires to harvest humidity, producing continuous DC power via proton diffusion.

✅ 7 micrometer film between electrodes adsorbs water vapor.

✅ Output: ~0.5 V, 17 uA/cm2; stack units to scale power.

✅ Geobacter optimized via engineered E. coli for mass nanowires.


They found it buried in the muddy shores of the Potomac River more than three decades ago: a strange "sediment organism" that could do things nobody had ever seen before in bacteria.

This unusual microbe, belonging to the Geobacter genus, was first noted for its ability to produce magnetite in the absence of oxygen, but with time scientists found it could make other things too, like bacterial nanowires that conduct electricity.

For years, researchers have been trying to figure out ways to usefully exploit that natural gift, and they might have just hit pay-dirt with a device they're calling the Air-gen. According to the team, their device can create electricity out of… well, almost nothing, similar to power from falling snow reported elsewhere.

"We are literally making electricity out of thin air," says electrical engineer Jun Yao from the University of Massachusetts Amherst. "The Air-gen generates clean energy 24/7."

The claim may sound like an overstatement, but a new study by Yao and his team describes how the air-powered generator can indeed create electricity with nothing but the presence of air around it. It's all thanks to the electrically conductive protein nanowires produced by Geobacter (G. sulfurreducens, in this instance).

The Air-gen consists of a thin film of the protein nanowires measuring just 7 micrometres thick, positioned between two electrodes, referencing advances in near light-speed conduction in materials science, but also exposed to the air.

Because of that exposure, the nanowire film is able to adsorb water vapour that exists in the atmosphere, offering a contrast to legacy hydropower models, enabling the device to generate a continuous electrical current conducted between the two electrodes.

The team says the charge is likely created by a moisture gradient that creates a diffusion of protons in the nanowire material.

"This charge diffusion is expected to induce a counterbalancing electrical field or potential analogous to the resting membrane potential in biological systems," the authors explain in their study.

"A maintained moisture gradient, which is fundamentally different to anything seen in previous systems, explains the continuous voltage output from our nanowire device."

The discovery was made almost by accident, when Yao noticed devices he was experimenting with were conducting electricity seemingly all by themselves.

"I saw that when the nanowires were contacted with electrodes in a specific way the devices generated a current," Yao says.

"I found that exposure to atmospheric humidity was essential and that protein nanowires adsorbed water, producing a voltage gradient across the device."

Previous research has demonstrated hydrovoltaic power generation using other kinds of nanomaterials – such as graphene-based systems now under study – but those attempts have largely produced only short bursts of electricity, lasting perhaps only seconds.

By contrast, the Air-gen produces a sustained voltage of around 0.5 volts, with a current density of about 17 microamperes per square centimetre, and complementary fuel cell solutions can help keep batteries energized, with a current density of about 17 microamperes per square centimetre. That's not much energy, but the team says that connecting multiple devices could generate enough power to charge small devices like smartphones and other personal electronics – concepts akin to virtual power plants that aggregate distributed resources – all with no waste, and using nothing but ambient humidity (even in regions as dry as the Sahara Desert).

"The ultimate goal is to make large-scale systems," Yao says, explaining that future efforts could use the technology to power homes via nanowire incorporated into wall paint, supported by energy storage for microgrids to balance supply and demand.

"Once we get to an industrial scale for wire production, I fully expect that we can make large systems that will make a major contribution to sustainable energy production."

If there is a hold-up to realising this seemingly incredible potential, it's the limited amount of nanowire G. sulfurreducens produces.

Related research by one of the team – microbiologist Derek Lovley, who first identified Geobacter microbes back in the 1980s – could have a fix for that: genetically engineering other bugs, like E. coli, to perform the same trick in massive supplies.

"We turned E. coli into a protein nanowire factory," Lovley says.

"With this new scalable process, protein nanowire supply will no longer be a bottleneck to developing these applications."


Related News

View more

US January power generation jumps 9.3% on year: EIA

US January power generation climbed to 373.2 TWh, EIA data shows, with coal edging natural gas, record wind output, record nuclear generation, rising hydro, and stable utility-scale solar amid higher Henry Hub prices.


Key Points

US January power generation hit 373.2 TWh; coal led gas, wind and nuclear set records, with solar edging higher.

✅ Coal 31.8% share; gas 29.4%; coal output 118.7 TWh, gas 109.6 TWh.

✅ Wind hit record 26.8 TWh; nuclear record 74.6 TWh.

✅ Total generation 373.2 TWh, highest January since 2014.


The US generated 373.2 TWh of power in January, up 7.9% from 345.9 TWh in December and 9.3% higher than the same month in 2017, Energy Information Administration data shows.

The monthly total was the highest amount in January since 377.3 TWh was generated in January 2014.

Coal generation totaled 118.7 TWh in January, up 11.4% from 106.58 TWh in December and up 2.8% from the year-ago month, consistent with projections of a coal-fired generation increase for the first time since 2014. It was also the highest amount generated in January since 132.4 TWh in 2015.

For the second straight month, more power was generated from coal than natural gas, as 109.6 TWh came from gas, up 3.3% from 106.14 TWh in December and up 19.9% on the year.

However, the 118.7 TWh generated from coal was down 9.6% from the five-year average for the month, due to the higher usage of gas and renewables and a rising share of non-fossil generation in the overall mix.

#google#

Coal made up 31.8% of the total US power generation in January, up from 30.8% in December but down from 33.8% in January 2017.

Gas` generation share was at 29.4% in the latest month, with momentum from record gas-fired electricity earlier in the period, down from 30.7% in December but up from 26.8% in the year-ago month.

In January, the NYMEX Henry Hub gas futures price averaged $3.16/MMBtu, up 13.9% from $2.78/MMBtu averaged in December but down 4% from $3.29/MMBtu averaged in the year-ago month.


WIND, NUCLEAR GENERATION AT RECORD HIGHS

Wind generation was at a record-high 26.8 TWh in January, up 29.3% from 22.8 TWh in December and the highest amount on record, according to EIA data going back to January 2001. Wind generated 7.2% of the nation`s power in January, as an EIA summer outlook anticipates larger wind and solar contributions, up from 6.6% in December and 6.1% in the year-ago month.

Utility-scale solar generated 3.3 TWh in January, up 1.3% from 3.1 TWh in December and up 51.6% on the year. In January, utility-scale solar generation made up 0.9% of US power generation, during a period when solar and wind supplied 10% of US electricity in early 2018, flat from December but up from 0.6% in January 2017.

Nuclear generation was also at a record-high 74.6 TWh in January, up 1.3% month on month and the highest monthly total since the EIA started tracking it in January 2001, eclipsing the previous record of 74.3 TWh set in July 2008. Nuclear generation made up 20% of the US power in January, down from 21.3% in December and 21.4% in the year-ago month.

Hydro power totaled 25.4 TWh in January, making up 6.8% of US power generation during the month, up from 6.5% in December but down from 8.2% in January 2017.


Related News

View more

Sign Up for Electricity Forum’s Newsletter

Stay informed with our FREE Newsletter — get the latest news, breakthrough technologies, and expert insights, delivered straight to your inbox.

Electricity Today T&D Magazine Subscribe for FREE

Stay informed with the latest T&D policies and technologies.
  • Timely insights from industry experts
  • Practical solutions T&D engineers
  • Free access to every issue

Download the 2025 Electrical Training Catalog

Explore 50+ live, expert-led electrical training courses –

  • Interactive
  • Flexible
  • CEU-cerified