The wacky world of green power

By Globe and Mail


NFPA 70e Training - Arc Flash

Our customized live online or in‑person group training can be delivered to your staff at your location.

  • Live Online
  • 6 hours Instructor-led
  • Group Training Available
Regular Price:
$199
Coupon Price:
$149
Reserve Your Seat Today
Lots of folks are thrilled by Ontarios big new investment in clean energy. Among them is Jim Creeggan, who plays bass guitar for the Barenaked Ladies.

Thats because the government is going to pay him to put solar panels on his roof.

Its a thrill to be able to power my own lights while, at the same time, contributing to my citys electrical needs, he enthuses. Im glad solar power is getting out of the fringe and into the mainstream.

Should the rest of us be enthused? Maybe not.

In solar terms, Toronto is not exactly Southern California. Even there, nobody has figured out how to make solar power cheap. The government will pay Mr. Creeggan and other solar producers around 80 cents a kilowatt hour for the power they sell back to the grid. Thats about 15 times more than the current spot price that consumers now pay for power. The difference will eventually show up on their electricity bills.

Welcome to the wacky world of green power, where misguided governments have sparked a massive corporate feeding frenzy at taxpayers expense to achieve little or nothing of any social benefit.

Just recently, Ontario Premier Dalton McGuinty announced $8billion more in green investments, on top of the $7billion he announced a short while ago. Hes determined to outspend B.C. Premier Gordon Campbell, who also wants to be the king of green. The heart of their strategy is to pay massive subsidies to wind, solar and other renewable energy producers many of them large multinational corporations for the next 20 years.

Some people think this is a terrible idea. One of them is George Monbiot, the environmental firebrand in Britain, which has just introduced its own subsidy scheme.

The feedin tariffs [the rates paid to power generators such as Mr. Creeggan] about to be introduced here are extortionate, useless and deeply regressive, he fumed. The technologies the scheme will reward are comically inefficient.

Michael Trebilcock, a professor of law and economics at the University of Toronto, figures that the cost of renewables will average out at two to three times the cost of conventional power. Large wind producers, for example, will get 13.5 cents a kWh and small producers will get more. These costs will be fed through to industrial, commercial and residential consumers through additional charges on their electricity bills. There will be additional costs to extend the transmission grid.

And that means consumers are about to get a nasty shock. Ontarios Energy Minister said soothingly that the green scheme will add only a few dollars a year to peoples hydro bills. But energy costs were already set to spike by 25 per cent, and energy experts say households will soon be paying several hundred dollars more a year. The government is sitting on a political time bomb, says Peter Murphy, a Toronto energy lawyer.

Greenenergy advocates say the extra cost is worth it. Renewable energy will reduce our use of fossil fuels, cut down on greenhousegas emissions, and bolster the economy by kicking off a new era of green jobs.

Dont bet your solar panel on it.

Renewables simply cant produce the large volumes of reliable energy that our economy needs.

These energy sources are so intermittent and unreliable that you have to have backup power at all times, says Prof. Trebilcock. For every wind farm we build, well have to have a coal or gasfired power station waiting in the wings to take over when its 20 below. I think well get next to nothing on carbon dioxide abatement, he says.

Mr. Monbiot agrees. Germany, he says, has spent €1.2billion on solar roofs. Their total contribution to the countrys electricity supply was 0.4 per cent. Their total contribution to carbon savings is zero.

But what about green jobs? The McGuinty government confidently predicts that its green scheme will create 50,000 of them.

Dont believe it.

Some will be temporary construction jobs. Some other jobs will disappear because higher electricity costs will make Ontario less competitive. And many of the new jobs will be extremely costly to create.

In Denmark, the windpower darling of the world, subsidies per net job created have amounted to $90,000 to $149,000 a year, according to one independent study. In Germany, job subsidies have cost as much as $249,000 a year.

So who are the winners? The companies that harvest the subsidies. Theyre flocking to Ontario like fruit flies to a bowl of overripe peaches.

The government is trying to create a feelgood story by showcasing the little guys such as schools that want to install solar roofs, and nativerun wind companies with names such as Mother Earth despite the fact that little guys are the most inefficient operators of all. But its the big guys who are the biggest winners multinational corporations such as the Korean giant Samsung, with which Mr. McGuinty struck a $7billion deal, and Brookfield Renewable Power, which plans to generate more power than all the little guys put together.

The world is littered with cautionary tales about subsidized renewables and overblown promises. Spain went wild on solar, and set off a speculative boom. Inefficient, poorly designed plants popped up everywhere. The lavish subsidies inflated costs. When Spain plunged into recession, the subsidies were ratcheted back, and the industry collapsed.

Wind economics are shaky, too. In Britain, too many developments are underperforming, says Michael Jefferson, an expert on energy sustainability and economics. Wind developers, he says, have grossly exaggerated wind potential. The subsidies make it viable for developers to put turbines on sites they would not touch if the money was not available. As The Times of London notes, even environmentalists admit that some of Britains treasured landscapes may have been blighted for only small gains in green energy.

None of this has deterred Mr. McGuinty, who campaigned on the promise of shutting down Ontarios coalfired generating plants. Many in his own party now wonder how wise this was. His Green Energy Plan was rammed through by tough guy George Smitherman, who decamped to run for mayor of Toronto long before any chickens come home to roost.

Does this mean theres nothing we can do to cut down on fossil fuel emissions? Not at all.

Ontario has an abundant supply of clean energy that hasnt yet been tapped hydro.

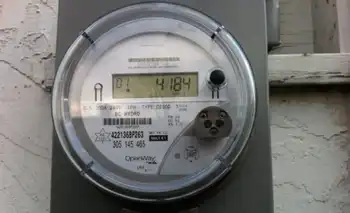
Theres enough northern Canadian hydro power to satisfy Ontarios needs for decades, says Prof. Trebilcock. Ontario could impose a carbon tax, and invest the money in research to find ways of making green power less expensive. Theres also conservation more retrofitting and smart metering.

But those are boring. Wind turbines and solar panels offer better photo ops.

The solar panel is the ideal modern status symbol, which signifies both wealth and superiority, even if its perfectly useless, writes Mr. Monbiot. Seldom has there been a bigger public ripoff.

Related News

Western Canada drought impacting hydropower production as reservoirs run low

Western Canada Hydropower Drought strains British Columbia and Manitoba as reservoirs hit historic lows, cutting hydroelectric output and prompting power imports, natural gas peaking, and grid resilience planning amid climate change risks this winter.


Key Points

Climate-driven reservoir lows cut hydro in B.C. and Manitoba, prompting imports and backup gas to maintain reliability.

✅ Reservoirs at multi-year lows cut hydro generation capacity

✅ BC Hydro and Manitoba Hydro import electricity for reliability

✅ Natural gas turbines used; climate change elevates drought risk


Severe drought conditions in Western Canada are compelling two hydroelectricity-dependent provinces, British Columbia and Manitoba, to import power from other regions. These provinces, known for their reliance on hydroelectric power, are facing reduced electricity production due to low water levels in reservoirs this autumn and winter as energy-intensive customers encounter temporary connection limits.

While there is no immediate threat of power outages in either province, experts indicate that climate change is leading to more frequent and severe droughts. This trend places increasing pressure on hydroelectric power producers in the future, spurring interest in upgrading existing dams as part of adaptation strategies.

In British Columbia, several regions are experiencing "extreme" drought conditions as classified by the federal government. BC Hydro spokesperson Kyle Donaldson referred to these conditions as "historic," and a first call for power highlights the strain, noting that the corporation's large reservoirs in the north and southeast are at their lowest levels in many years.

To mitigate this, BC Hydro has been conserving water by utilizing less affected reservoirs and importing additional power from Alberta and various western U.S. states. Donaldson confirmed that these measures would persist in the upcoming months.

Manitoba is also facing challenges with below-normal levels in reservoirs and rivers. Since October, Manitoba Hydro has occasionally relied on its natural gas turbines to supplement hydroelectric production as electrical demand could double over the next two decades, a measure usually reserved for peak winter demand.

Bruce Owen, a spokesperson for Manitoba Hydro, reassured that there is no imminent risk of a power shortage. The corporation can import electricity from other regions, similar to how it exports clean energy in high-water years.

However, the cost implications are significant. Manitoba Hydro anticipates a financial loss for the current fiscal year, with more red ink tied to emerging generation needs, the second in a decade, with the previous one in 2021. That year, drought conditions led to a significant reduction in the company's power production capabilities, resulting in a $248-million loss.

The 2021 drought also affected hydropower production in the United States. The U.S. Department of Energy reported a 16% reduction in overall generation, with notable decreases at major facilities like Nevada's Hoover Dam, where production dropped by 25%.

Drought has long been a major concern for hydroelectricity producers, and they plan their operations with this risk in mind. Manitoba's record drought in 1940-41, for example, is a benchmark for Manitoba Hydro's operational planning to ensure sufficient electricity supply even in extreme low-water conditions.

Climate change, however, is increasing the frequency of such rare events, highlighting the need for more robust backup systems such as new turbine investments to enhance reliability. Blake Shaffer, an associate professor of economics at the University of Calgary specializing in electricity markets, emphasized the importance of hydroelectric systems incorporating the worsening drought forecasts due to climate change into their energy production planning.


Related News

View more

Here are 3 ways to find out where your electricity comes from

US energy mix shows how the electric grid blends renewables, fossil fuels, nuclear, and hydro, varying by ISO/RTO markets, utilities, and state policies, affecting carbon emissions, pricing, reliability, and access.


Key Points

The US energy mix is the grid's source breakdown by region: fossil fuels, renewables, nuclear, and hydro.

✅ Check ISO or RTO dashboards for real-time generation by fuel source.

✅ Utilities may offer green power plans or RECs at modest premiums.

✅ Energy mix shifts with policy, pricing, and grid reliability needs.


There are few resources more important than energy. Sure, you may die if you don't eat for days. But your phone will die if you go too long without charging it. Energy feeds tech, the internet, city infrastructure, refrigerators, lights, and has evolved throughout U.S. history in profound ways. You get the idea. Yet unlike our other common needs, such as food, energy sources aren't exactly front of mind for most people. 

"I think a lot of people don't put a lot of bandwidth into thinking about this part of their lives," said Richard McMahon, the SVP of energy supply and finance at Edison Electric Institute, a trade group that represents investor-owned electric companies in the US. 

It makes sense. For most Americans, electricity is always there, and in many locations, there's not much of a choice involved, even as electricity demand is flat across the U.S. today. You sign up with a utility when you move into a new residence and pay your bills when they're due. 

But there's an important reality that indifference eschews: In 2018, a third of the energy-related carbon-dioxide emissions in the US came from the electric power sector, according to the US Energy Information Administration (EIA). 

A good chunk of that is from the residential sector, which consistently uses more energy than commercial customers, per EIA data.

Just as many people exercise choice when they eat, you typically also have a choice when it comes to your energy supply. That's not to say your current offering isn't what you want, or that switching will be easy or affordable, but "if you're a customer and want power with a certain attribute," McMahon said, "you can pretty much get it wherever you are." 

But first, you need to know the energy mix you have right now. As it turns out, it's not so straightforward. At all.

This brief guide may help. 

For some utility providers, you can find out if it publishes the energy mix online. Dominion Energy, which serves Idaho, North Carolina, Ohio, South Carolina, Utah, Virginia, West Virginia, and Wyoming, provides this information in a colored graphic. 

"Once you figure out who your utility is you can figure out what mix of resources they use," said Heidi Ratz, an electricity markets researcher at the World Resources Institute.

But not all utilities publish this information.

It has to do with their role in the grid and reflects utility industry trends in structure and markets. Some utility companies are vertically integrated; they generate power through nuclear plants or wind farms and distribute those electrons directly to their customers. Other utilities just distribute the power that different companies produce. 

Consider Consolidated Edison, or Con Ed, which distributes energy to parts of New York City. While reporting this story, Business Insider could not find information about the utility's energy mix online. When reached for comment, a spokesperson said, "we're indifferent to where it comes from."

That's because, in New York, distribution utilities like Con Ed often buy energy through a wholesale marketplace.

Take a look at this map. If you live in one of the colored regions, your electricity is sold on a wholesale market regulated by an organization called a regional transmission organization (RTO) or independent system operator (ISO). Distribution utilities like Con Ed often buy their energy through these markets, based on availability and cost, while raising questions about future utility revenue models as prices shift. 

Still, it's pretty easy to figure out where your energy comes from. Just look up the ISO or RTO website (such as NYISO or CAISO). Usually, these organizations will provide energy supply information in near-real time. 

That's exactly what Con Edison (which buys energy on the NYISO marketplace) suggested. As of Friday morning, roughly 40% of the energy on the market place was natural gas or other fossil fuels, 34% was nuclear, and about 22% was hydro. 

If you live in another region governed by an ISO or RTO, such as in most of California, you can do the same thing. Like NYISO, CAISO has a dashboard that shows (again, as of Friday morning) about 36% of the energy on the market comes from natural gas and more than 20% comes from renewables. 

In the map linked above, you'll notice that some of the ISOs and RTOs like MISO encompass enormous regions. That means that even if you figure out where the energy in your market comes from, it's not going to be geographically specific. But there are a couple of ways to drill down even further. 

The Environmental Protection Agency has a straightforward tool called Power Profiler. You can enter your zip code to see the fuel mix in your area. But it's not perfect. The data are from 2016 and, in some regions of the country like the upper Midwest, they aren't much more localized, and some import dirty electricity due to regional trading. 

The World Resources Institute also has a tool that allows you to see the electricity mix by state, based on 2017 data from EIA. These numbers represent power generation, not the electricity actually flowing into your sockets, but they offer a rough idea of what energy resources are operating in your state. 

One option is to check with your utility to see if it has a "green power" offering. Over 600 utilities across the country have one, according to the Climate Reality Project, though they often come at a slightly higher cost. It's typically on the scale of just a few more cents per kilowatt-hour. 

There are also independent, consumer-facing companies like Arcadia and Green Mountain Energy that allow you to source renewable energy, by virtually connecting you to community solar projects or purchasing Renewable Energy Certificates, or RECs, on your behalf, as America goes electric and more options emerge. 

"RECs measure an investment in a clean energy resource," Ratz said, in an email. "The goal of putting that resource on the grid is to push out the need for dirtier resources."

The good news: Even if you do nothing, your energy mix will get cleaner. Coal production has fallen to lows not seen since the 1980s, amid disruptions in coal and nuclear sectors that affect reliability and costs, while renewable electricity generation has doubled since 2008. So whether you like it or not, you'll be roped into the clean energy boom one way or another. 


Related News

View more

U.S. Electricity and natural gas prices explained

Energy Pricing Factors span electricity generation, transmission, and distribution costs, plus natural gas supply-demand, renewables, seasonal peaks, and wholesale pricing effects across residential, commercial, and industrial customers, usage patterns, weather, and grid constraints.


Key Points

They are the costs and market forces driving electricity and natural gas prices, from generation to delivery and demand.

✅ Generation, transmission, distribution shape electricity rates

✅ Gas prices hinge on supply, storage, imports/exports

✅ Demand shifts: weather, economy, and fuel alternatives


There are a lot of factors that affect energy prices globally. What’s included in the price to heat homes and supply them with electricity may be a lot more than some people may think.

Electricity
Generating electricity is the largest component of its price, according to the U.S. Energy Information Administration (EIA). Generation accounts for 56% of the price of electricity, while distribution and transmission account for 31% and 13% respectively.

Homeowners and businesses pay more for electricity than industrial companies, and U.S. electricity prices have recently surged, highlighting broader inflationary pressures. This is because industrial companies can take electricity at higher voltages, reducing transmission costs for energy companies.

“Industrial consumers use more electricity and can receive it at higher voltages, so supplying electricity to these customers is more efficient and less expensive. The price of electricity to industrial customers is generally close to the wholesale price of electricity,” EIA explains.

NYSEG said based on the average use of 600 kilowatt-hours per month, its customers spent the most money on delivery and transition charges in 2020, 57% or about $42, and residential electricity bills increased 5% in 2022 after inflation, according to national data. They also spent on average 35% (~$26) on supply charges and 8% (~$6) on surcharges.

Electricity prices are usually higher in the summer. Why? Because energy companies use sources of electricity that cost more money. It used to be that renewable sources, like solar and wind, were the most expensive sources of energy but increased technological advances have changed this, according to the International Energy Agency’s 2021 World Energy Outlook.

“In most markets, solar PV or wind now represents the cheapest available source of new electricity generation. Clean energy technology is becoming a major new area for investment and employment – and a dynamic arena for international collaboration and competition,” the report said.

Natural gas
The price of natural gas is driven by supply and demand. If there is more supply, prices are generally lower. If there is not as much supply, prices are generally higher the EIA explains. On the other side of the equation, more demand can also increase the price and less demand can decrease the price.

High natural gas prices mean people turn their home thermostats down a few degrees to save money, so the EIA said reduced demand can encourage companies to produce more natural gas, which would in turn help lower the cost. Lower prices will sometimes cause companies to reduce their production, therefore causing the price to rise.

The three major supply factors that affect prices: the amount of natural gas produced, how much is stored, and the volume of gas imported and exported. The three major demand factors that affect price are: changes in winter/summer weather, economic growth, and the broader energy crisis dynamics, as well as how much other fuels are available and their price, said EIA.

To think the price of natural gas is higher when the economy is thriving may sound counterintuitive but that’s exactly what happens. The EIA said this is because of increases in demand.


Related News

View more

"It's freakishly cold": Deep freeze slams American energy sector

Texas Deep Freeze Energy Crisis strains grids as polar vortex triggers rolling blackouts, record natural gas and electricity prices, refinery shutdowns, WTI gains, and scarcity pricing across Texas, Oklahoma, SPP, and Mexico.


Key Points

A polar vortex slamming Texas energy: outages, record power prices, gas spikes, and reduced oil output.

✅ Record gas trades near $500/mmBtu; power hits $6,000/MWh

✅ WTI tops $60 as Texas shuts in ~1 million bpd

✅ Rolling blackouts across SPP; ERCOT scarcity pricing


A deep freeze is roiling electricity markets in more than a dozen U.S. states, leading to record-setting prices for electricity and natural gas, knocking oil production off line and shutting down some of North America’s largest refineries.

“It’s freakishly cold,” said Eric Fell, a senior natural gas analyst with Wood Mackenzie in Houston, where record cold temperatures and snow have blanketed the city, caused rolling power outages, shut down refineries and sent both natural gas and electricity prices soaring.

'It’s freakishly cold': Deep freeze slams North American energy sector

The polar vortex has led to freezing temperatures in every county in Texas, the largest energy-producing state in the U.S., and caused massive disruptions across the North American energy complex, triggering Texas power outages as far south as Mexico.

As the plunge in temperatures forced oil companies to shut in an estimated one million barrels of oil production in Texas on Monday, the West Texas Intermediate benchmark price rose above the US$60 per barrel threshold for the first time in a year to settle up 1 per cent, or US65 cents, at US$60.12 per barrel.

President Joe Biden declared an emergency on Monday, unlocking federal assistance to Texas.

People carry groceries from a local gas station on Monday in Austin, Texas. Winter storm Uri has brought historic cold weather to Texas, causing traffic delays and power outages. 

Frozen wind farms are just a small piece of Texas’s power grid woes right now.

Fell said regional natural gas and electricity prices in Oklahoma and Texas broke U.S. records over the weekend.

On Friday, Oklahoma gas transmission prices averaged US$350 per million British thermal units and Fell said one trade went as high as US$600 per mmBtu. In parts of the Texas panhandle and elsewhere, prices jumped to US$200, “all of which individually would have been new records,” Fell said, noting the previous record was US$160.

On Monday, natural gas for physical delivery in the U.S. was trading for as much as US$500 per mmBtu as demand for the heating and power plant fuel soared.  Spot gas has been trading for hundreds of dollars across the central U.S. since Thursday with a surge in heating demand triggering widespread blackouts and sending electricity prices soaring. The fuel normally trades in the region for less than US$3 per mmBtu.

Similarly, electricity prices in Texas surged to US$6,000 per megawatt hour on Monday, as U.S. power companies grapple with supply-chain constraints, which Fell said is “100 times the normal price.”

“You’re seeing scarcity pricing in power and gas. The only thing that’s different this time is it’s staying there – it’s not just an hour or two hours, it’s the whole day,” he said.

The blast of Arctic cold, which has blanketed Canada and much of the U.S., has created a massive draw on natural gas supplies, used both for home heating and industrial uses like electricity generation.

Little Rock, Ark.-based Southwest Power Pool, which coordinates electricity distribution for parts of 14 states including Oklahoma Kansas, Nebraska and even as far north as North Dakota, announced rolling blackouts across its network on Monday as a result of the power outages.

“In our history as a grid operator, this is an unprecedented event and marks the first time SPP has ever had to call for controlled interruptions of service” SPP’s executive vice-president and chief operating officer Lanny Nickell said in a release, adding the move was “a last resort” to “prevent circumstances from getting worse.”

The frigid conditions have led to a surge in natural gas prices across the continent, including in Alberta where the AECO benchmark price jumped to a seven-year high of $6.36 per thousand cubic feet last week, a price not seen since 2014.

Energy systems in Texas and Oklahoma, which are major energy exporters to other U.S. states, are built to withstand severe heat – not extreme cold. The result is a disruption to the gas supply at exactly the time the U.S. energy system is demanding those molecules.

“Given how far south it’s gone into Texas, this is where you have a lot of gas production that isn’t properly winterized,” said Jeremy McCrea, an analyst with Raymond James covering the natural gas industry.


Related News

View more

BNEF Report: Wind and Solar Will Provide 50% of Electricity in 2050

BNEF 2019 New Energy Outlook projects surging renewable energy demand, aggressive decarbonization, wind and solar cost declines, battery storage growth, coal phase-out, and power market reform to meet Paris Agreement targets through 2050.


Key Points

Bloomberg's NEO 2019 forecasts power demand, renewables growth, and decarbonization pathways through 2050.

✅ Predicts wind/solar to ~50% of global electricity by 2050

✅ Foresees coal decline; Asia transitions slower than Europe

✅ Calls for power market reform and battery integration


In a report that examines the ways in which renewable energy demand is expected to increase, Bloomberg New Energy Finance (BNEF) finds that “aggressive decarbonization” will be required beyond 2030 to meet the temperature goals of the Paris Agreement on climate change.

Focusing on electricity, BNEF’s 2019 New Energy Outlook (NEO) predicts a 62% increase in global power demand, leading to global generating capacity tripling between now and 2050, when wind and solar are expected to make up almost 50% of world electricity, as wind and solar gains indicate, due to decreasing costs.

The report concludes that coal will collapse everywhere except Asia, and, by 2032, there will be more wind and solar electricity than coal-fired electricity. It forecasts that coal’s role in the global power mix will decrease from 37% today, as renewables surpass 30% globally, to 12% by 2050 with the virtual elimination of oil as a power-generating source.

Highlighting regional differences, the report finds that:

Western European economies are already on a strong decarbonization path due to carbon pricing and strong policy support, with offshore wind costs dropping bolstering progress;

by 2040, renewables will comprise 90% of the electricity mix in Europe, with wind and solar accounting for 80%;

the US, with low-priced natural gas, and China, with its coal-fired plants, will transition more slowly even as 30% from wind and solar becomes feasible; and

China’s power sector emissions will peak in 2026 and then fall by more than half over the next 20 years, as solar PV growth accelerates, with wind and solar increasing from 8% to 48% of total electricity generation by 2050.

Power markets must be reformed to ensure wind, solar and batteries are properly remunerated for their contributions to the grid.

The 2019 report finds that wind and solar now represent the cheapest option for adding new power-generating capacity in much of the world, amid record-setting momentum, which is expected to attract USD 13.3 trillion in new investment. While solar, wind, batteries and other renewables are expected to attract USD 10 trillion in investment by 2050, the report warns that curbing emissions will require other technologies as well.

Speaking about the report, Matthias Kimmel, NEO 2019 lead analyst, said solar photovoltaic modules, wind turbines and lithium-ion batteries are set to continue on aggressive cost reduction curves of 28%, 14% and 18%, respectively, for every doubling in global installed capacity. He explained that by 2030, energy generated or stored and dispatched by these technologies will undercut electricity generated by existing coal and gas plants.

To achieve this level of transition and decarbonization, the report stresses, power markets must be reformed to ensure wind, solar and batteries are “properly remunerated for their contributions to the grid.”

Additionally, the 2019 NEO includes a number of updates such as:

  • new scenarios on global warming of 2°C above preindustrial levels, electrified heat and road transport, and an updated coal phase-out scenario;
  • new sections on coal and gas power technology, the future grid, energy access, and costs related to decarbonization technology such as carbon capture and storage (CCS), biogas, hydrogen fuel cells, nuclear and solar thermal;
  • sub-national results for China;
  • the addition of commercial electric vehicles;
  • an expanded air-conditioning analysis; and
  • modeling of Brazil, Mexico, Chile, Turkey and Southeast Asia in greater detail.

Every year, the NEO compares the costs of competing energy technologies, informing projections like US renewables at one-fourth in the near term. The 2019 report brought together 65 market and technology experts from 12 countries to provide their views on how the market might evolve.


Related News

View more

B.C. Commercial electricity consumption plummets during COVID-19 pandemic

BC Hydro COVID-19 Relief Fund enables small businesses to waive electricity bills for commercial properties during the pandemic, offering credits, rate support, and applications for eligible customers forced to temporarily close.


Key Points

A program that lets eligible small businesses waive up to three months of BC Hydro bills during COVID-19 closures.

✅ Eligible small general service BC Hydro accounts

✅ Up to 3 months of waived electricity charges

✅ Must be temporarily closed due to the pandemic


Businesses are taking advantage of a BC Hydro relief fund that allows electricity bills for commercial properties to be waived during the COVID-19 pandemic.

More than 3,000 applications have already been filed since the program launched on Wednesday, allowing commercial properties forced to shutter during the crisis to waive the expense for up to three months, while Ontario rate reductions are taking effect for businesses under separate measures. 

“To be eligible for the COVID-19 Relief Fund, business customers must be on BC Hydro’s small general service rate and have temporarily closed or ceased operation due to the COVID-19 pandemic,” BC Hydro said in a statement. “BC Hydro estimates that around 40,000 small businesses in the province will be eligible for the program.”

The program builds off a similar initiative BC Hydro launched last week for residential customers who have lost employment or income because of COVID-19, and parallels Ontario's subsidized hydro plan introduced to support ratepayers. So far, 57,000 B.C. residents have applied for the relief fund, which amounts to an estimated $16 million in credits, amid scrutiny over deferred BC Hydro operating costs reported by the auditor general.

Electricity use across B.C. has plummeted since the outbreak began. 

According to BC Hydro, daily consumption has fallen 13% in the first two weeks of April, aligning with electricity demand down 10% reports, compared to the three-year average for the same time period.

Electricity use has fallen 30% for recreation facilities, 29% in the restaurant sector and 27% in hotels, while industry groups such as Canadian Manufacturers & Exporters have supported steps to reduce prices. 

For more information about the COVID-19 Relief Fund and advice on avoiding BC Hydro scam attempts, go to bchydro.com/covid19relief.


Related News

View more

Sign Up for Electricity Forum’s Newsletter

Stay informed with our FREE Newsletter — get the latest news, breakthrough technologies, and expert insights, delivered straight to your inbox.

Electricity Today T&D Magazine Subscribe for FREE

Stay informed with the latest T&D policies and technologies.
  • Timely insights from industry experts
  • Practical solutions T&D engineers
  • Free access to every issue

Download the 2025 Electrical Training Catalog

Explore 50+ live, expert-led electrical training courses –

  • Interactive
  • Flexible
  • CEU-cerified