Toshiba, IHI launch steam turbine company

By Industrial Info Resources


Substation Relay Protection Training

Our customized live online or in‑person group training can be delivered to your staff at your location.

  • Live Online
  • 12 hours Instructor-led
  • Group Training Available
Regular Price:
$699
Coupon Price:
$599
Reserve Your Seat Today
Electrical and electronic equipment manufacturer Toshiba Corporation and heavymachinery manufacturer IHI Corporation recently signed a memorandum of understanding, under which the two companies will form a joint venture to manufacture steam turbine parts for upcoming nuclear power plants.

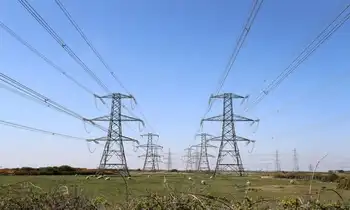
The venture will target both the domestic and overseas markets. The formation of the venture signifies the growing demand for new nuclear power plants worldwide and the ensuing requirement for maintenance services.

The asyet unnamed joint venture will be based in Yokohama, within IHIs representative office. The products of the venture will include casings and nozzles, both of which are essential components of steam turbines used in both boilingwater reactors BWR and pressurizedwater reactors PWR. The venture also will offer maintenance services on its installed equipment. The planned initial capital investment on the venture is about $3.2 million. The venture is expected to be launched in October 2010, and IHI is likely to hold a majority stake in it. At this point, the two companies have made it clear that they are not discussing joint production of any other component. The two companies had begun talks about this possible partnership in February 2008.

The partnership will benefit both companies, and it will enable Toshiba to strengthen its supply chain in the nuclear power plant business and improve its steam turbine manufacturing capacity. It also will enable IHI, which manufactures containment vessels and nuclear reactor pressure vessels, to add the manufacture of turbine parts to its portfolio. The partnership will help reduce the costs of production and enhance production capacity as competition heats up from manufacturers in Russia and South Korea, among others. The venture hopes to draw customers away from business rivals such as Areva S.A. and Hitachi Limited.

The two companies have an established relationship in the construction and maintenance of BWR plants ,and both are trying to grow their PWR business through the global PWR power plant leader, Westinghouse Electric Company LLC. While Toshiba has been a majority owner of Westinghouse since 2006, IHI is a 3 shareholder in the company. In 2008, Toshiba signed cooperation agreements in the PWR business with IHI and holding company Doosan Corporation. This was followed by IHI and Doosan being selected to supply equipment and materials for the AP1000 reactor construction projects of Westinghouse.

The primary reason driving the demand for new nuclear power plants is the growing realization that nuclear power is one of the most promising ways to ensure longterm energy security. Toshiba has been increasing its focus on the nuclear business as more countries are considering nuclear power as a clean alternative to conventional power sources. Toshiba and Westinghouse expect to receive at least 39 supply orders for worldwide nuclear power plants through 2015.

Related News

$1.6 Billion Battery Plant Charges Niagara Region for Electric Vehicle Future

Ontario EV Battery Separator Plant anchors Canada's EV supply chain, with Asahi Kasei producing lithium-ion battery separators in Niagara Region to support Honda's Alliston assembly, clean transportation growth, and sustainable manufacturing jobs.


Key Points

Asahi Kasei's Niagara Region plant makes lithium-ion battery separators supplying Honda's EV factory in Ontario.

✅ Starts up by 2027 to align with Honda EV output timeline.

✅ Backed by clean tech tax credits and public investment.

✅ Boosts local jobs, R&D, and clean transportation leadership.


The automotive industry is undergoing a seismic shift, and Canada is firmly planting its flag in the electric vehicle (EV) revolution, propelled by recent EV assembly deals across the country. A new $1.6 billion battery component plant in Ontario's Niagara Region signifies a significant step towards a cleaner, more sustainable transportation future. This Asahi Kasei facility, a key player in Honda's $15 billion electric vehicle supply chain investment, promises to create jobs, boost the local economy, and solidify Ontario's position as a leader in clean transportation technology.

Honda's ambitious project forms part of Honda's Ontario EV investment that involves constructing a dedicated battery plant adjacent to their existing Alliston, Ontario assembly facility. This new plant will focus on producing fully electric vehicles, requiring a robust supply chain for critical components. Asahi Kasei's Niagara Region plant enters the picture here, specializing in the production of battery separators – a thin film crucial for separating the positive and negative electrodes within a lithium-ion battery. These separators play a vital role in ensuring the battery functions safely and efficiently.

The Niagara Region plant is expected to be operational by 2 027, perfectly aligning with Honda's EV production timeline. This strategic partnership benefits both companies: Honda secures a reliable source for a vital component, while Asahi Kasei capitalizes on the burgeoning demand for EV parts. The project is a catalyst for economic growth in Ontario, creating jobs in construction and manufacturing, supporting an EV jobs boom province-wide, and potentially future research and development sectors. Additionally, it positions the province as a hub for clean transportation technology, attracting further investment and fostering innovation.

This announcement isn't an isolated event. News of Volkswagen constructing a separate EV battery plant in St. Thomas, Ontario, and the continuation of a major EV battery project near Montreal further underscore Canada's commitment to electric vehicles. These developments signify a clear shift in the country's automotive landscape, with a focus on sustainable solutions.

Government support has undoubtedly played a crucial role in attracting these investments. The Honda deal involves up to $5 billion in public funds. Asahi Kasei's Niagara Region plant is also expected to benefit from federal and provincial clean technology tax credits. This demonstrates a collaborative effort between government and industry, including investments by Canada and Quebec in battery assembly, to foster a thriving EV ecosystem in Canada.

The economic and environmental benefits of this project are undeniable. Battery production is expected to create thousands of jobs, while the shift towards electric vehicles will lead to reduced emissions and a cleaner environment. Ontario stands to gain significantly from this transition, becoming a leader in clean energy technology and attracting skilled workers and businesses catering to the EV sector, especially as the U.S. auto pivot to EVs accelerates across the border.

However, challenges remain. Concerns about the environmental impact of battery production, particularly the sourcing of raw materials and the potential for hazardous waste, need to be addressed. Additionally, ensuring a skilled workforce capable of handling the complexities of EV technology is paramount.

Despite these challenges, the future of electric vehicles in Canada appears bright. Major automakers are making significant investments, government support is growing, and consumer interest in EVs is on the rise. The Niagara Region plant serves as a tangible symbol of Canada's commitment to a cleaner and more sustainable transportation future. With careful planning and continued Canada-U.S. collaboration across the sector, this project has the potential to revolutionize the Canadian automotive industry and pave the way for a greener tomorrow.


Related News

View more

Hydro Quebec to increase hydropower capacity to more than 37,000 MW in 2021

Hydro Quebec transmission expansion aims to move surplus hydroelectric capacity from record reservoirs to the US grid via new interties, increasing exports to New England and New York amid rising winter peak demand.


Key Points

A plan to add capacity and intertie links to export surplus hydro power from Quebec's reservoirs to the US grid.

✅ 245 MW added in 2021; portfolio reaches 37,012 MW

✅ Reservoirs at unprecedented levels; export potential high

✅ Lacks US transmission; working on new interties


Hydro Quebec plans to add an incremental 245 MW of hydro-electric generation capacity in 2021 to its expansive portfolio in the north of the province, while Quebec authorized nearly 1,000 MW for industrial projects across the region, bringing the total capacity to 37,012 MW, an official said Friday

Quebec`s highest peak demand of 39,240 MW occurred on January 22, 2014.

A little over 75% of Quebec`s population heat their homes with electricity, Sutherland said, aligning with Hydro Quebec's strategy to wean the province off fossil fuels over time.

The province-owned company produced 205.1 TWh of power in 2017 and its net exports were 34.4 TWh that year, while Ontario chose not to renew a power deal in a separate development.

Sutherland said Hydro Quebec`s reservoirs are currently at "unprecedented levels" and the company could export more of its electricity to New England and New York, but faces transmission constraints that limit its ability to do so.

Hydro Quebec is working with US transmission developers, electric distribution companies, independent system operators and state government agencies to expand that transmission capacity in order to delivery more power from its hydro system to the US, Sutherland said.

Separately, NB Power signed three deals to bring more Quebec electricity into the province, reflecting growing regional demand.

The last major intertie connection between Quebec and the US was completed close to 30 years ago. The roughly 2,000 MW capacity transmission line that connects into the Boston area was completed in the late 1990s, according to Hydro Quebec spokeswoman Lynn St-Laurent.


Related News

View more

UK low-carbon electricity generation stalls in 2019

UK low-carbon electricity 2019 saw stalled growth as renewables rose slightly, wind expanded, nuclear output fell, coal hit record lows, and net-zero targets demand faster deployment to cut CO2 intensity below 100gCO2/kWh.


Key Points

Low-carbon sources supplied 54% of UK power in 2019, up just 1TWh; wind grew, nuclear fell, and coal dropped to 2%.

✅ Wind up 8TWh; nuclear down 9TWh amid outages

✅ Fossil fuels 43% of generation; coal at 2%

✅ Net-zero needs 15TWh per year added to 2030


The amount of electricity generated by low-carbon sources in the UK stalled in 2019, Carbon Brief analysis shows.

Low-carbon electricity output from wind, solar, nuclear, hydro and biomass rose by just 1 terawatt hour (TWh, less than 1%) in 2019. It represents the smallest annual increase in a decade, where annual growth averaged 9TWh. This growth will need to double in the 2020s to meet UK climate targets while replacing old nuclear plants as they retire.

Some 54% of UK electricity generation in 2019 came from low-carbon sources, including 37% from renewables and 20% from wind alone, underscoring wind's leading role in the power mix during key periods. A record-low 43% was from fossil fuels, with 41% from gas and just 2% from coal, also a record low. In 2010, fossil fuels generated 75% of the total.

Carbon Brief’s analysis of UK electricity generation in 2019 is based on figures from BM Reports and the Department for Business, Energy and Industrial Strategy (BEIS). See the methodology at the end for more on how the analysis was conducted.

The numbers differ from those published earlier in January by National Grid, which were for electricity supplied in Great Britain only (England, Wales and Scotland, but excluding Northern Ireland), including via imports from other countries.

Low-carbon low
In 2019, the UK became the first major economy to target net-zero greenhouse gas emissions by 2050, increasing the ambition of its legally binding Climate Change Act.

To date, the country has cut its emissions by around two-fifths since 1990, with almost all of its recent progress coming from the electricity sector.

Emissions from electricity generation have fallen rapidly in the decade since 2010 as coal power has been almost phased out and even gas output has declined. Fossil fuels have been displaced by falling demand and by renewables, such as wind, solar and biomass.

But Carbon Brief’s annual analysis of UK electricity generation shows progress stalled in 2019, with the output from low-carbon sources barely increasing compared to a year earlier.

The chart below shows low-carbon generation in each year since 2010 (grey bars) and the estimated level in 2019 (red). The pale grey bars show the estimated future output of existing low-carbon sources after old nuclear plants retire and the pale red bars show the amount of new generation needed to keep electricity sector emissions to less than 100 grammes of CO2 per kilowatt hour (gCO2/kWh), the UK’s nominal target for the sector.

 Annual electricity generation in the UK by fuel, terawatt hours, 2010-2019. Top panel: fuel by fuel. Bottom panel: cumulative total generation from all sources. Source: BEIS energy trends, BM Reports and Carbon Brief analysis. Chart by Carbon Brief using Highcharts.
As the chart shows, the UK will require significantly more low-carbon electricity over the next decade as part of meeting its legally binding climate goals.

The nominal 100gCO2/kWh target for 2030 was set in the context of the UK’s less ambitious goal of cutting emissions to 80% below 1990 levels by 2050. Now that the country is aiming to cut emissions to net-zero by 2050, that 100gCO2/kWh indicator is likely to be the bare minimum.

Even so, it would require a rapid step up in the pace of low-carbon expansion, compared to the increases seen over the past decade. On average, low-carbon generation has risen by 9TWh each year in the decade since 2010 – including a rise of just 1TWh in 2019.

Given scheduled nuclear retirements and rising demand expected by the Committee on Climate Change (CCC) – with some electrification of transport and heating – low-carbon generation would need to increase by 15TWh each year until 2030, just to meet the benchmark of 100gCO2/kWh.

For context, the 3.2 gigawatt (GW) Hinkley C new nuclear plant being built in Somerset will generate around 25TWh once completed around 2026. The world’s largest offshore windfarm, the 1.2GW Hornsea One scheme off the Yorkshire coast, will generate around 5TWh each year.

The new Conservative government is targeting 40GW of offshore wind by 2030, up from today’s figure of around 8GW. If policies are put in place to meet this goal, then it could keep power sector emissions below 100gCO2/kWh, depending on the actual performance of the windfarms built.

However, new onshore wind and solar, further new nuclear or other low-carbon generation, such as gas with carbon capture and storage (CCS), is likely to be needed if demand is higher than expected, or if the 100gCO2/kWh benchmark is too weak in the context of net-zero by 2050.

The CCC says it is “likely” to “reflect the need for more rapid deployment” of low-carbon towards net-zero emissions in its advice on the sixth UK carbon budget for 2033-2037, due in September.

Trading places
Looking more closely at UK electricity generation in 2019, Carbon Brief’s analysis shows why there was so little growth for low-carbon sources compared to the previous year.

There was another increase for wind power in 2019 (up 8TWh, 14%), with record wind generation as several large new windfarms were completed including the 1.2GW Hornsea One project in October and the 0.6GW Beatrice offshore windfarm in Q2 of 2019. But this was offset by a decline for nuclear (down 9TWh, 14%), due to ongoing outages for reactors at Hunterston in Scotland and Dungeness in Kent.

(Analysis of data held by trade organisation RenewableUK suggests some 0.6GW of onshore wind capacity also started operating in 2019, including the 0.2GW Dorenell scheme in Moray, Scotland.)

As a result of these movements, the UK’s windfarms overtook nuclear for the first time ever in 2019, becoming the country’s second-largest source of electricity generation, and earlier, wind and solar together surpassed nuclear in the UK as momentum built. This is shown in the figure below, with wind (green line, top panel) trading places with nuclear (purple) and gas (dark blue) down around 25% since 2010 but remaining the single-largest source.

 Annual electricity generation in the UK by fuel, terawatt hours, 2010-2019. Top panel: fuel by fuel. Bottom panel: cumulative total generation from all sources. Source: BEIS energy trends, BM Reports and Carbon Brief analysis. Chart by Carbon Brief using Highcharts.
The UK’s currently suspended nuclear plants are due to return to service in January and March, according to operator EDF, the French state-backed utility firm. However, as noted above, most of the UK’s nuclear fleet is set to retire during the 2020s, with only Sizewell B in Suffolk due to still be operating by 2030. Hunterston is scheduled to retire by 2023 and Dungeness by 2028.

Set against these losses, the UK has a pipeline of offshore windfarms, secured via “contracts for difference” with the government, at a series of auctions. The most recent auction, in September 2019, saw prices below £40 per megawatt hour – similar to current wholesale electricity prices.

However, the capacity contracted so far is not sufficient to meet the government’s target of 40GW by 2030, meaning further auctions – or some other policy mechanism – will be required.

Coal zero
As well as the switch between wind and nuclear, 2019 also saw coal fall below solar for the first time across a full year, echoing the 2016 moment when wind outgenerated coal across the UK, after it suffered another 60% reduction in electricity output. Just six coal plants remain in the UK, with Aberthaw B in Wales and Fiddlers Ferry in Cheshire closing in March.

Coal accounted for just 2% of UK generation in 2019, a record-low coal share since centralised electricity supplies started to operate in 1882. The fuel met 40% of UK needs as recently as 2012, but has plummeted thanks to falling demand, rising renewables, cheaper gas and higher CO2 prices.

The reduction in average coal generation hides the fact that the fuel is now often not required at all to meet the UK’s electricity needs. The chart below shows the number of days each year when coal output was zero in 2019 (red line) and the two previous years (blue).

 Cumulative number of days when UK electricity generation from renewable sources has been higher than that from fossil fuels. Source: BEIS energy trends, BM Reports and Carbon Brief analysis. Chart by Carbon Brief using Highcharts.
The 83 days in 2019 with zero coal generation amount to nearly a quarter of the year and include the record-breaking 18-day stretch without the fuel.

Great Britain has been running for a record TWO WEEKS without using coal to generate electricity – the first time this has happened since 1882.

The country’s grid has been coal-free for 45% of hours in 2019 so far.https://www.carbonbrief.org/countdown-to-2025-tracking-the-uk-coal-phase-out …

Coal generation was set for significant reductions around the world in 2019 – including a 20% reduction for the EU as a whole – according to analysis published by Carbon Brief in November.

Notably, overall UK electricity generation fell by another 9TWh in 2019 (3%), bringing the total decline to 58TWh since 2010. This is equivalent to more than twice the output from the Hinkley C scheme being built in Somerset. As Carbon Brief explained last year, falling demand has had a similar impact on electricity-sector CO2 emissions as the increase in output from renewables.

This is illustrated by the fact that the 9TWh reduction in overall generation translated into a 9TWh (6%) cut in fossil-fuel generation during 2019, with coal falling by 10TWh and gas rising marginally.

Increasingly renewable
As fossil-fuel output and overall generation have declined, the UK’s renewable sources of electricity have continued to increase. Their output has risen nearly five-fold in the past decade and their share of the UK total has increased from 7% in 2010 to 37% in 2019.

As a result, the UK’s increasingly renewable grid is seeing more minutes, hours and days during which the likes of wind, solar and biomass collectively outpace all fossil fuels put together, and on some days wind is the main source as well.

The chart below shows the number of days during each year when renewables generated more electricity than fossil fuels in 2019 (red line) and each of the previous four years (blue lines). In total, nearly two-fifths of days in 2019 crossed this threshold.

 Cumulative number of days when the UK has not generated any electricity from coal. Source: BEIS energy trends, BM Reports and Carbon Brief analysis. Chart by Carbon Brief using Highcharts.
There were also four months in 2019 when renewables generated more of the UK’s electricity than fossil fuels: March, August, September and December. The first ever such month came in September 2018 and more are certain to follow.

National Grid, which manages Great Britain’s high-voltage electricity transmission network, is aiming to be able to run the system without fossil fuels by 2025, at least for short periods. At present, it sometimes has to ask windfarm operators to switch off and gas plants to start running in order to keep the electricity grid stable.

Note that biomass accounted for 11% of UK electricity generation in 2019, nearly a third of the total from all renewables. Some two-thirds of the biomass output is from “plant biomass”, primarily wood pellets burnt at Lynemouth in Northumberland and the Drax plant in Yorkshire. The remainder was from an array of smaller sites based on landfill gas, sewage gas or anaerobic digestion.

The CCC says the UK should “move away” from large-scale biomass power plants, once existing subsidy contracts for Drax and Lynemouth expire in 2027.

Using biomass to generate electricity is not zero-carbon and in some circumstances could lead to higher emissions than from fossil fuels. Moreover, there are more valuable uses for the world’s limited supply of biomass feedstock, the CCC says, including carbon sequestration and hard-to-abate sectors with few alternatives.

Methodology
The figures in the article are from Carbon Brief analysis of data from BEIS Energy Trends chapter 5 and chapter 6, as well as from BM Reports. The figures from BM Reports are for electricity supplied to the grid in Great Britain only and are adjusted to include Northern Ireland.

In Carbon Brief’s analysis, the BM Reports numbers are also adjusted to account for electricity used by power plants on site and for generation by plants not connected to the high-voltage national grid. This includes many onshore windfarms, as well as industrial gas combined heat and power plants and those burning landfill gas, waste or sewage gas.

By design, the Carbon Brief analysis is intended to align as closely as possible to the official government figures on electricity generated in the UK, reported in BEIS Energy Trends table 5.1.

Briefly, the raw data for each fuel is in most cases adjusted with a multiplier, derived from the ratio between the reported BEIS numbers and unadjusted figures for previous quarters.

Carbon Brief’s method of analysis has been verified against published BEIS figures using “hindcasting”. This shows the estimates for total electricity generation from fossil fuels or renewables to have been within ±3% of the BEIS number in each quarter since Q4 2017. (Data before then is not sufficient to carry out the Carbon Brief analysis.)

For example, in the second quarter of 2019, a Carbon Brief hindcast estimates gas generation at 33.1TWh, whereas the published BEIS figure was 34.0TWh. Similarly, it produces an estimate of 27.4TWh for renewables, against a BEIS figure of 27.1TWh.

National Grid recently shared its own analysis for electricity in Great Britain during 2019 via its energy dashboard, which differs from Carbon Brief’s figures.


Related News

View more

Operating record for Bruce Power as Covid-19 support Council announced

Bruce Power Life-Extension Programme advances Ontario nuclear capacity through CANDU Major Component Replacement, reliable operation milestones, supply chain retooling for COVID-19 recovery, PPE production, ventilator projects, and medical isotope supply security.


Key Points

A program to refurbish CANDU reactors, extend asset life, and mobilize Ontario nuclear supply chain and isotopes.

✅ Extends CANDU units via Major Component Replacement

✅ Supports COVID-19 recovery with PPE and ventilator projects

✅ Boosts Ontario energy reliability and medical isotopes


Canada’s Bruce Power said on 1 May that unit 1 at the Bruce nuclear power plant had set a record of 624 consecutive days of reliable operation – the longest since it was returned to service in 2012.

It exceeded Bruce 8’s run of 623 consecutive days between May 2016 and February 2018. Bruce 1, a Candu reactor, was put into service in 1977. It was shut down and mothballed by the former Ontario Hydro in 1997, and was refurbished and returned to service in 2012 by Bruce Power.

Bruce units 3 and 4 were restarted in 2003 and 2004. They are part of Bruce Power’s Life-Extension Programme, and future planning such as Bruce C project exploration continues across the fleet, with units 3 and 4 to undergo Major Component Replacement (MCR) Projects from 2023-28, adding about 30 years of life to the reactors.

The refurbishment of Bruce 6 has begun and will be followed by MCR Unit 3 which is scheduled to begin in 2023. Nuclear power accounts for more than 60% of Ontario’s supply, with Bruce Power providing more than 30%   of the province’s electricity.

Set up of Covid recovery council
On 30 April, Bruce Power announced the establishment of the Bruce Power Retooling and Economic Recovery Council to leverage the province’s nuclear supply chain to support Ontario’s fight against Covid-19 and to help aid economic recovery.

Bruce Power’s life extension programme is Canada’s second largest infrastructure project and largest private sector infrastructure programme. It is creating 22,000 direct and indirect jobs, delivering economic benefits that are expected to contribute $4 billion to Ontario’s GDP and $8-$11 billion to Canada’s gross domestic product (GDP), Bruce Power said.

“With 90% of the investment in manufactured goods and services coming from 480 companies in Ontario and other provinces, including recent manufacturing contracts with key suppliers, we can harness these capabilities in the fight against Covid-19, and help drive our economic recovery,” the company said.

“An innovative and dynamic nuclear supply chain is more important than ever in meeting this new challenge while successfully implementing our mission of providing clean, reliable, flexible, low-cost nuclear energy and a global supply of medical isotopes,” said Bruce Power president and CEO Mike Rencheck. “We are mobilising a great team with our extended supply chain, which spans the province, to assist in the fight against Covid-19 and to help drive our economic recovery in the future.”

Greg Rickford, the Minister of Energy, Mines, Northern Development, and Minister of Indigenous Affairs, said the launch of the council is consistent with Ontario’s focus to fight Covid-19 as a top priority and a look ahead to economic recovery, and initiatives like Pickering life extensions supporting long-term system reliability.

The creation of the Council was announced during a live event on Bruce Power's Facebook page, in which Rencheck was joined by Associate Minister of Energy Bill Walker and Rocco Rossi, the president and CEO of the Ontario Chamber of Commerce.

Walker reiterated the Government of Ontario’s commitment to nuclear power over the long term and to the life extension programme, including the Pickering B refurbishment as part of this strategy.

The Council, which will be formed for the duration of the pandemic and will include of all of Bruce Power’s Ontario-based suppliers, will focus on the continued retooling of the supply chain to meet front-line Covid-19 needs to contribute to the province’s economy recovery in the short, medium and long term.

New uses for nuclear medical applications will be explored, including isotopes for the sterilisation of medical equipment and long-term supply security.

The supply chain will be leveraged to support the health care sector through the rapid production of medical Personal Protection Equipment for front line-workers and large-scale PPE donations to communities as well as participation in pilot projects to make ventilators within the Bruce Power supply chain or help identify technology to better utilise existing ventilators;

“Buy Local” tools and approaches will be emphasised to ensure small businesses are utilised fully in communities where nuclear suppliers are located.

The production of hand sanitiser and other cleaning products will be facilitated for distribution to communities.


Related News

View more

Ontario's electricity operator kept quiet about phantom demand that cost customers millions

IESO Fictitious Demand Error inflated HOEP in the Ontario electricity market, after embedded generation was mis-modeled; the OEB says double-counted load lifted wholesale prices and shifted costs via the Global Adjustment.


Key Points

An IESO modeling flaw that double-counted load, inflating HOEP and charges in Ontario's wholesale market.

✅ Double-counted unmetered load from embedded generation

✅ Inflated HOEP; shifted costs via Global Adjustment

✅ OEB flagged transparency; exporters paid more


For almost a year, the operator of Ontario’s electricity system erroneously counted enough phantom demand to power a small city, causing prices to spike and hundreds of millions of dollars in extra charges to consumers, according to the provincial energy regulator.

The Independent Electricity System Operator (IESO) also failed to tell anyone about the error once it noticed and fixed it.

The error likely added between $450 million and $560 million to hourly rates and other charges before it was fixed in April 2017, according to a report released this month by the Ontario Energy Board’s Market Surveillance Panel.

It did this by adding as much as 220 MW of “fictitious demand” to the market starting in May 2016, when the IESO started paying consumers who reduced their demand for power during peak periods. This involved the integration of small-scale embedded generation (largely made up of solar) into its wholesale model for the first time.

The mistake assumed maximum consumption at such sites without meters, and double-counted that consumption.

The OEB said the mistake particularly hurt exporters and some end-users, who did not benefit from a related reduction of a global adjustment rate applicable to other customers.

“The most direct impact of the increase in HOEP (Hourly Ontario Energy Price) was felt by Ontario consumers and exporters of electricity, who paid an artificially high HOEP, to the benefit of generators and importers,” the OEB said.

The mix-up did not result in an equivalent increase in total system costs, because changes to the HOEP are offset by inverse changes to a electricity cost allocation mechanism such as the Global Adjustment rate, the OEB noted.


A chart from the OEB's report shows the time of day when fictitious demand was added to the system, and its influence on hourly rates.

Peak time spikes
The OEB said that the fictitious demand “regularly inflated” the hourly price of energy and other costs calculated as a direct function of it.

For almost a year, Ontario's electricity system operator @IESO_Tweets erroneously counted enough phantom demand to power a small city, causing price spikes and hundreds of millions in charges to consumers, @OntEnergyBoard says. @5thEstate reports.

It estimated the average increase to the HOEP was as much as $4.50/MWh, but that price spikes, compounded by scheduled OEB rate changes, would have been much higher during busier times, such as the mid-morning and early evening.

“In times of tight supply, the addition of fictitious demand often had a dramatic inflationary impact on the HOEP,” the report said.

That meant on one summer evening in 2016 the hourly rate jumped to $1,619/MWh, it said, which was the fourth highest in the history of the Ontario wholesale electricity market.

“Additional demand is met by scheduling increasingly expensive supply, thus increasing the market price. In instances where supply is tight and the supply stack is steep, small increases in demand can cause significant increases in the market price.

The OEB questioned why, as of September this year, the IESO had failed to notify its customers or the broader public, amid a broader auditor-regulator dispute that drew political attention, about the mistake and its effect on prices.

“It's time for greater transparency on where electricity costs are really coming from,” said Sarah Buchanan, clean energy program manager at Environmental Defence.

“Ontario will be making big decisions in the coming years about whether to keep our electricity grid clean, or burn more fossil fuels to keep the lights on,” she added. “These decisions need to be informed by the best possible evidence, and that can't happen if critical information is hidden.”

In a response to the OEB report on Monday, the IESO said its own initial analysis found that the error likely pushed wholesale electricity payments up by $225 million. That calculation assumed that the higher prices would have changed consumer behaviour, while upcoming electricity auctions were cited as a way to lower costs, it said.

In response to questions, a spokesperson said residential and small commercial consumers would have saved $11 million in electricity costs over the 11-month period, even as a typical bill increase loomed province-wide, while larger consumers would have paid an extra $14 million.

That is because residential and small commercial customers pay some costs via time-of-use rates, including a temporary recovery rate framework, the IESO said, while larger customers pay them in a way that reflects their share of overall electricity use during the five highest demand hours of the year.

The IESO said it could not compensate those that had paid too much, given the complexity of the system, and that the modelling error did not have a significant impact on ratepayers.

While acknowledging the effects of the mistake would vary among its customers, the IESO said the net market impact was less than $10 million, amid ongoing legislation to lower electricity rates in Ontario.

It said it would improve testing of its processes prior to deployment and agreed to publicly disclose errors that significantly affect the wholesale market in the future.


Related News

View more

Florida Court Blocks Push to Break Electricity Monopolies

Florida Electricity Deregulation Ruling highlights the Florida Supreme Court decision blocking a ballot measure on retail choice, preserving utility monopolies for NextEra and Duke Energy, while similar deregulation efforts arise in Virginia and Arizona.


Key Points

A high court decision removing a retail choice ballot measure, keeping Florida utility monopolies intact for incumbents.

✅ Petition language deemed misleading for 2020 ballot

✅ Preserves NextEra and Duke Energy market dominance

✅ Similar retail choice pushes in VA and AZ


Florida’s top court ruled against a proposed constitutional amendment that would have allowed customers to pick their electricity provider, even as Florida solar incentives face rejection by state leaders, threatening monopolies held by utilities such as NextEra Energy Inc. and Duke Energy Corp.

In a ruling Thursday, the court said the petition’s language is “misleading” and doesn’t comply with requirements to be included on the 2020 ballot, reflecting debates over electricity pricing changes at the federal level. The measure’s sponsor, Citizens for Energy Choice, said the move ends the initiative, even as electricity future advocacy continues nationwide.

“While we were confident in our plan to gather the remaining signatures required, we cannot overcome this last obstacle,” the group’s chair, Alex Patton, noting ongoing energy freedom in the South efforts, said in a statement.

The proposed measure was one of several efforts underway to deregulate U.S. electricity markets, including New York’s review of retail energy markets this year. Earlier this week, two Virginia state lawmakers unveiled a bill to allow residents and businesses to pick their electricity provider, threatening Dominion Energy Inc.’s longstanding local monopoly. And in Arizona, where Arizona Public Service Co. has long reigned, regulators are considering a similar move, while in New England Hydro-Quebec’s export bid has been energized by a court decision.


Related News

View more

Sign Up for Electricity Forum’s Newsletter

Stay informed with our FREE Newsletter — get the latest news, breakthrough technologies, and expert insights, delivered straight to your inbox.

Electricity Today T&D Magazine Subscribe for FREE

Stay informed with the latest T&D policies and technologies.
  • Timely insights from industry experts
  • Practical solutions T&D engineers
  • Free access to every issue

Download the 2025 Electrical Training Catalog

Explore 50+ live, expert-led electrical training courses –

  • Interactive
  • Flexible
  • CEU-cerified