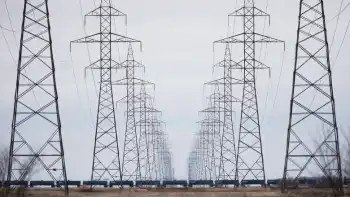
Mon Power installing new conductors on transmission line

By First Energy


NFPA 70e Training

Our customized live online or in‑person group training can be delivered to your staff at your location.

  • Live Online
  • 6 hours Instructor-led
  • Group Training Available
Regular Price:
$199
Coupon Price:
$149
Reserve Your Seat Today
Project Designed to Benefit Mon Power Customers in Monongalia County Mon Power, a subsidiary of FirstEnergy Corp., is installing new conductors on a 138,000-volt transmission line near Morgantown to increase capacity, enhance service reliability to existing customers and handle future load growth in the Monongalia County area.

The $5 million project includes three phases, with all the work occurring on existing right-of-way. The transmission line upgrade is expected to be completed before year's end.

"This work will upgrade existing Mon Power facilities and benefit customers in the Morgantown area, a fast-growing region of our West Virginia service territory, without needing to acquire additional easements or build new sections of line," said Holly Kauffman, FirstEnergy's president of West Virginia Operations.

Work is underway on the initial phase of the project which involves replacing about three miles of conductor on a transmission line between substations on Collins Ferry Road and Chaplin Hill Road in Morgantown. Crews also will be replacing nine existing wooden structures as part of the project. This section of the project is expected to be completed by mid-April.

The next phase involves reconductoring about half a mile of transmission line and replacing six wooden structures between the substation located on Collins Ferry Road and another Morgantown substation on West Run Road. The work is scheduled to start in mid-April and be completed by early June.

The final phase will be the installation of new conductor on six miles of existing transmission line between the substation on West Run Road and a substation adjacent to the Lake Lynn Power Station. Work is expected to start in July and be completed by the end of the year.

This transmission line upgrade is part of FirstEnergy's previously announced plans to invest more than $110 million in 2014 in the Mon Power area on transmission and distribution projects designed to further improve service reliability. Major projects scheduled for 2014 include trimming trees, building new distribution circuits, replacing underground cables, and inspecting and replacing equipment including utility poles.

Mon Power serves about 385,000 customers in 34 West Virginia counties.

Related News

ABL Secures Contract for UK Subsea Power

ABL has secured a contract for the UK Subsea Power Link, highlighting ABL Group’s marine warranty role in Eastern Green Link 2, a 2 GW offshore electricity superhighway connecting Scotland and England to enhance grid reliability and renewable energy transmission.


Key Points: ABL Group’s contract for the UK Subsea Power Link

ABL Group has been appointed to provide marine warranty survey services for the 2 GW Eastern Green Link 2 subsea interconnector between Scotland and England.

✅ Manages vessel suitability checks, installation oversight, and DP assurance

✅ Strengthens UK grid reliability and advances the clean energy transition

✅ Sizeable contract valued between USD 1 million and 3 million


Energy and marine consultancy ABL, a subsidiary of ABL Group, has been awarded a contract by Eastern Green Link 2 (EGL2) to provide marine warranty survey (MWS) services for the installation of a new 2 GW subsea power connection between Scotland and England.

EGL2 is one of the United Kingdom’s most significant energy-infrastructure projects, involving the creation of a 505-kilometre “electricity superhighway” that will enable simultaneous power transfer between Peterhead in Aberdeenshire and Drax in North Yorkshire, mirroring a renewable power link announced for the same corridor recently. The project is designed to strengthen grid resilience, integrate renewable energy from Scotland’s offshore resources, and advance the UK’s broader energy transition goals.

Under the terms of the contract, ABL will be responsible for the technical review and approval of the project and procedural documentation, as well as conducting suitability surveys of the proposed fleet for marine transportation and installation operations. The company will also provide dynamic positioning (DP) assurance where required and will review and approve all warranted operations through on-site attendances, reflecting practices used on projects like the Great Northern Transmission Line in North America.

Cable-laying operations for the link are scheduled to take place between January and September 2028, amid wider efforts to fast-track grid connections across the UK. According to ABL, the engagement represents a “sizeable” contract, valued between USD 1 million and 3 million.

“This appointment reflects ABL's reputation as a trusted MWS partner for major power transmission infrastructure development and reinforces our position at the forefront of supporting the UK's energy transition,” said Hege Norheim, CEO of ABL Group. “We look forward to contributing to this strategic initiative.”

The subsea interconnector, known as Eastern Green Link 2, will transmit up to 2 gigawatts of electricity—enough to power approximately 2 million homes. It forms part of the Great Grid Upgrade, National Grid’s nationwide program to modernize and expand the transmission network in preparation for a low-carbon future, alongside a recent 2 GW substation milestone.

By linking renewable-rich northern Scotland with high-demand regions in England, EGL2 is expected to reduce congestion on the existing grid by leveraging HVDC technology to improve transfer efficiency, enhance security of supply, and facilitate the more efficient flow of surplus renewable energy south. The connection will also support the UK government’s target of decarbonizing the electricity system by 2035.

ABL’s appointment follows a period of intensive marine and geotechnical surveys along the proposed cable route to assess seabed conditions and environmental sensitivities. The company’s marine warranty oversight will ensure that transportation and installation operations meet strict safety, technical, and environmental standards demanded by insurers and project partners, as seen in a recent cross-border transmission approval in North America.

For ABL Group, which provides engineering and risk services to the offshore energy and marine industries worldwide, the contract marks another milestone in its expanding portfolio of subsea power and transmission projects across Europe. With operations set to begin in 2028, the Eastern Green Link 2 initiative represents both a major engineering challenge and a key enabler of the UK’s offshore energy ambitions, echoing a recent offshore wind power milestone in the U.S.


Related Articles


View more

EIA: Pennsylvania exports the most electricity, California imports the most from other states

U.S. Electricity Trade by State, 2013-2017 highlights EIA grid patterns, interstate imports and exports, cross-border flows with Canada and Mexico, net exporters and importers, and market regions like ISOs and RTOs shaping consumption and generation.


Key Points

Brief EIA overview of interstate and cross-border power flows, ranking top net importers and exporters.

✅ Pennsylvania was the largest net exporter, averaging 59 million MWh.

✅ California was the largest net importer, averaging 77 million MWh.

✅ Top cross-border: NY, CA, VT, MN, MI imports; WA, TX, CA, NY, MT exports.


According to the U.S. Energy Information Administration (EIA) State Electricity Profiles, from 2013 to 2017, Pennsylvania was the largest net exporter of electricity, while California was the largest net importer.

Pennsylvania exported an annual average of 59 million megawatt-hours (MWh), while California imported an average of 77 million MWh annually.

Based on the share of total consumption in each state, the District of Columbia, Maryland, Massachusetts, Idaho and Delaware were the five largest power-importing states between 2013 and 2017, highlighting how some clean states import 'dirty' electricity as consumption outpaces local generation. Wyoming, West Virginia, North Dakota, Montana and New Hampshire were the five largest power-exporting states. Wyoming and West Virginia were net power exporting states between 2013 and 2017.

New York, California, Vermont, Minnesota and Michigan imported the most electricity from Canada or Mexico on average from 2013 to 2017, reflecting the U.S. look to Canada for green power during that period. Similarly, Washington, Texas, California, New York, and Montana exported the most electricity to Canada or Mexico, on average, during the same period.

Electricity routinely flows among the Lower 48 states and, to a lesser extent, between the United States and Canada and Mexico. From 2013 to 2017, Pennsylvania was the largest net exporter of electricity, sending an annual average of 59 million megawatthours (MWh) outside the state. California was the largest net importer, receiving an average of 77 million MWh annually.

Based on the share of total consumption within each state, the District of Columbia, Maryland, Massachusetts, Idaho, and Delaware were the five largest power-importing states between 2013 and 2017. Wyoming, West Virginia, North Dakota, Montana, and New Hampshire were the five largest power-exporting states. States with major population centers and relatively less generating capacity within their state boundaries tend to have higher ratios of net electricity imports to total electricity consumption, as utilities devote more to electricity delivery than to power production in many markets.

Wyoming and West Virginia were net power exporting states (they exported more power to other states than they consumed) between 2013 and 2017. Customers residing in these two states are not necessarily at an economic disadvantage or advantage compared with customers in neighboring states when considering their electricity bills and fees and market dynamics. However, large amounts of power trading may affect a state’s revenue derived from power generation.

Some states also import and export electricity outside the United States to Canada or Mexico, even as Canada's electricity exports face trade tensions today. New York, California, Vermont, Minnesota, and Michigan are the five states that imported the most electricity from Canada or Mexico on average from 2013 through 2017. Similarly, Washington, Texas (where electricity production and consumption lead the nation), California, New York, and Montana are the five states that exported the most electricity to Canada or Mexico, on average, for the same period.

Many states within the continental United States fall within integrated market regions, referred to as independent system operators or regional transmission organizations. These integrated market regions allow electricity to flow freely between states or parts of states within their boundaries.

EIA’s State Electricity Profiles provide details about the supply and disposition of electricity for each state, including net trade with other states and international imports and exports, and help you understand where your electricity comes from more clearly.


Related News

View more

Costa Rica hits record electricity generation from 99% renewable sources

Costa Rica Renewable Energy Record highlights 99.99% clean power in May 2019, driven by hydropower, wind, solar, geothermal, and biomass, enabling ICE REM electricity exports and reduced rates from optimized generation totaling 984.19 GWh.


Key Points

May 2019 benchmark: Costa Rica generated 99.99% of 984.19 GWh from renewables, shifting from imports to regional exports.

✅ 99.99% renewable share across hydro, wind, solar, geothermal, biomass

✅ 984.19 GWh generated; ICE suspended imports and exported via REM

✅ Geothermal output increased to offset dry-season hydropower variability


During the whole month of May 2019, Costa Rica generated a total of 984.19 gigawatt hours of electricity, the highest in the country’s history. What makes this feat even more impressive is the fact that 99.99% of this energy came from a portfolio of renewable sources such as hydropower, wind, biomass, solar, and geothermal.

With such a high generation rate, the state power company Instituto Costariccense de Electricidad (ICE) were able to suspend energy imports from the first week of May and shifted to exports, while U.S. renewable electricity surpassed coal in 2022 domestically. To date, the power company continues to sell electricity to the Regional Electricity Market (REM) which generates revenues and is likely to reduce local electricity rates, a trend echoed in places like Idaho where a vast majority of electricity comes from renewables.

The record-breaking power generation was made possible by optimization of the country’s renewable sources, much as U.S. wind capacity surpassed hydro capacity at the end of 2016 to reshape portfolios. As the period coincided with the tail end of the dry season, the geothermal quota had to be increased.

Costa Rica remains a leader in renewable power generation, whereas U.S. wind generation has become the most-used renewable source in recent years. In 2015, more than 98% of the country’s electrical generation came from renewable sources, while U.S. renewables hit a record 28% in April in one recent benchmark. Through the years, this figure has remained fairly constant despite dry bouts caused by the El Niño phenomenon, and U.S. solar generation also continued to rise.


Related News

View more

Bomb Cyclone Leaves Half a Million Without Power in Western Washington

Western Washington Bomb Cyclone unleashed gale-force winds, torrential rain, and coastal flooding, causing massive power outages from Seattle to Tacoma; storm surge, downed trees, and blocked roads hindered emergency response and infrastructure repairs.


Key Points

A rapidly deepening storm with severe winds, rain, flooding, and major power outages across Western Washington.

✅ Rapid barometric pressure drop intensified the system

✅ Gale-force winds downed trees and power lines

✅ Coastal flooding and storm surge disrupted transport


A powerful "bomb cyclone" recently hit Western Washington, causing widespread destruction across the region. The intense storm left more than half a million residents without power, similar to B.C. bomb cyclone outages seen to the north, with outages affecting communities from Seattle to Olympia. This weather phenomenon, marked by a rapid drop in atmospheric pressure, unleashed severe wind gusts, heavy rain, and flooding, causing significant disruption to daily life.

The bomb cyclone, which is a rapidly intensifying storm, typically features a sharp drop in barometric pressure over a short period of time. This creates extreme weather conditions, including gale-force winds, torrential rain, and coastal flooding, as seen during California storm impacts earlier in the season. In Western Washington, the storm struck just as the region was beginning to prepare for the winter season, catching many off guard with its strength and unpredictability.

The storm's impact was immediately felt as high winds downed trees, power lines, and other infrastructure. By the time the worst of the storm had passed, utility companies had reported widespread power outages, with more than 500,000 customers losing electricity. The outages were particularly severe in areas like Seattle, Tacoma, and the surrounding communities. Crews worked tirelessly in difficult conditions to restore power, but many residents faced extended outages, underscoring US grid climate vulnerabilities that complicate recovery efforts, with some lasting for days due to the scope of the damage.

The power outages were accompanied by heavy rainfall, leading to localized flooding. Roads were inundated, making it difficult for first responders and repair crews to reach affected areas. Emergency services were stretched thin as they dealt with downed trees, blocked roads, and flooded neighborhoods. In some areas, floodwaters reached homes, forcing people to evacuate. In addition, several schools were closed, and public transportation services were temporarily halted, leaving commuters stranded and businesses unable to operate.

As the storm moved inland, its effects continued to be felt. Western Washington’s coastal regions were hammered by high waves and storm surges, further exacerbating the damage. The combination of wind and rain also led to hazardous driving conditions, prompting authorities to advise people to stay off the roads unless absolutely necessary.

While power companies worked around the clock to restore electricity, informed by grid resilience strategies that could help utilities prepare for future events, challenges persisted. Fallen trees and debris blocked access to repair sites, and the sheer number of outages made it difficult for crews to restore power quickly. Some customers were left in the dark for days, forced to rely on generators, candles, and other makeshift solutions. The storm's intensity left a trail of destruction, requiring significant resources to address the damages and rebuild critical infrastructure.

In addition to the immediate impacts on power and transportation, the bomb cyclone raised important concerns about climate change and the increasing frequency of extreme weather events. Experts note that storms like these are becoming more common, with rapid intensification leading to more severe consequences and compounding pressures such as extreme-heat electricity costs for households. As the planet warms, scientists predict that such weather systems will continue to grow in strength, posing greater challenges to cities and regions that are not always prepared for such extreme events.

In the aftermath of the storm, local governments and utility companies faced the daunting task of not only restoring services but also assessing the broader impact of the storm on communities. Many areas, especially those hit hardest by flooding and power outages, will require substantial recovery efforts. The devastation of the bomb cyclone highlighted the vulnerability of infrastructure in the face of rapidly changing weather patterns and water availability, as seen in BC Hydro drought adaptations nearby, and reinforced the need for greater resilience in the face of future storms.

The storm's impact on the Pacific Northwest is a reminder of the power of nature and the importance of preparedness. As Western Washington recovers, there is a renewed focus on strengthening infrastructure, including expanded renewable electricity to diversify supply, improving emergency response systems, and ensuring that communities are better equipped to handle the challenges posed by increasingly severe weather events. For now, residents remain hopeful that the worst is behind them and are working together to rebuild and prepare for whatever future storms may bring.

The bomb cyclone has left an indelible mark on Western Washington, but it also serves as a call to action for better preparedness, more robust infrastructure, and a greater focus on combating climate change to mitigate the impact of such extreme weather in the future.


Related News

View more

European responses to Covid-19 accelerate electricity system transition by a decade - Wartsila

EU-UK Coal Power Decline 2020 underscores Covid-19's impact on power generation, with renewables rising, carbon emissions falling, and electricity demand down, revealing resilient grids and accelerating the energy transition across European markets.


Key Points

Covid-19's impact on EU-UK power: coal down, renewables up, lower emissions intensity and reduced electricity demand.

✅ Coal generation down 25.5% EU-UK; 29% in March 10-April 10 period

✅ Renewables share up to 46%; grids remained stable and flexible

✅ Electricity demand fell 10%; emissions intensity dropped 19.5%


Coal based power generation has fallen by over a quarter (25.5%) across the European Union (EU) and United Kingdom (UK) in the first three months of 2020, compared to 2019, as a result of the response to Covid-19, with renewable energy reaching a 43% share, as wind and solar outpaced gas across the EU, according to new analysis by the technology group Wärtsilä.

The impact is even more stark in the last month, with coal generation collapsing by almost one third (29%) between March 10 and April 10 compared to the same period in 2019, making up only 12% of total EU and UK generation. By contrast, renewables delivered almost half (46%) of generation – an increase of 8% compared to 2019.

In total, demand for electricity across the continent is down by one tenth (10%), mirroring global demand declines of around 15%, due to measures taken to combat Covid-19, the biggest drop in demand since the Second World War. The result is an unprecedented fall in carbon emissions from the power sector, with emission intensity falling by 19.5% compared to the same March 10-April 10 period last year. The analysis comes from the Wärtsilä Energy Transition Lab, a new free-to-use data platform developed by Wärtsilä to help the industry, policy makers and the public understand the impact of Covid-19 on European electricity markets and analyse what this means for the future design and operation of its energy systems. The goal is to help accelerate the transition to 100% renewables.

Björn Ullbro, Vice President for Europe & Africa at Wärtsilä Energy Business, said: “The impact of the Covid-19 crisis on European energy systems is extraordinary. We are seeing levels of renewable electricity that some people believed would cause systems to collapse, yet they haven’t – in fact they are coping well. The question is, what does this mean for the future?”

“What we can see today is how our energy systems cope with much more renewable power – knowledge that will be invaluable, aligning with IAEA low-carbon insights, to accelerate the energy transition. We are making this new platform freely available to support the energy industry to adapt and use the momentum this tragic crisis has created to deliver a better, cleaner energy system, faster.”

The figures mark a dramatic shift in Europe’s energy mix – one that was not anticipated to occur until the end of the decade. The impact of the Covid-19 crisis has effectively accelerated the energy transition in the short-term, even as later lockdowns saw power demand hold firm in parts of Europe, providing a unique opportunity to see how energy systems function with far higher levels of renewables.

Ullbro added: “Electricity demand across Europe has fallen due to the lockdown measures applied by governments to stop the spread of the coronavirus. However, total renewable generation has remained at pre-crisis levels with low electricity prices, combined with renewables-friendly policy measures, crowding out gas and fossil fuel power generation, especially coal. This sets the scene for the next decade of the energy transition.”

These Europe-wide impacts are mirrored at a national level, for example:

  • In the UK, renewables now have a 43% share of generation, following a stall in low-carbon progress in 2019 (up 10% on the same March 10-April 10 period in 2019) with coal power down 35% and gas down 24%.
  • Germany has seen the share of renewables reach 60% (up 12%) and coal generation fall 44%, resulting in a fall in the carbon intensity of its electricity of over 30%.
  • Spain currently has 49% renewables with coal power down by 41%.
  • Italy has seen the steepest fall in demand, down 21% so far.

An industry first, the Wärtsilä Energy Transition Lab has been specifically developed as an open-data platform for the energy industry to understand the impact of Covid-19 and help accelerate the energy transition. The tool provides detailed data on electricity generation, demand and pricing for all 27 EU countries and the UK, combining Entso-E data in a single, easy to use platform. It will also allow users to model how systems could operate in future with higher renewables, as global power demand surpasses pre-pandemic levels, helping pinpoint problem areas and highlight where to focus policy and investment.


Related News

View more

The Great Debate About Bitcoin's Huge Appetite For Electricity Determining Its Future

Bitcoin Energy Debate examines electricity usage, mining costs, environmental impact, and blockchain efficiency, weighing renewable power, carbon footprint, scalability, and transaction throughput to clarify stakeholder claims from Tesla, Square, academics, and policymakers.


Key Points

Debate on Bitcoin mining's power use, environmental impact, efficiency, and scalability versus alternative blockchains.

✅ Compares energy intensity with transaction throughput and system outputs.

✅ Weighs renewables, stranded power, and carbon footprint in mining.

✅ Assesses PoS blockchains, stablecoins, and scalability tradeoffs.


There is a great debate underway about the electricity required to process Bitcoin transactions. The debate is significant, the stakes are high, the views are diverse, and there are smart people on both sides. Bitcoin generates a lot of emotion, thereby producing too much heat and not enough light. In this post, I explain the importance of identifying the key issues in the debate, and of understanding the nature and extent of disagreement about how much electrical energy Bitcoin consumes.

Consider the background against which the debate is taking place. Because of its unstable price, Bitcoin cannot serve as a global mainstream medium of exchange. The instability is apparent. On January 1, 2021, Bitcoin’s dollar price was just over $29,000. Its price rose above $63,000 in mid-April, and then fell below $35,000, where it has traded recently. Now the financial media is asking whether we are about to experience another “cyber winter” as the prices of cryptocurrencies continue their dramatic declines.

Central banks warns of bubble on bitcoins as it skyrockets
As bitcoins skyrocket to more than $12 000 for one BTC, many central banks as ECB or US Federal ... [+] NURPHOTO VIA GETTY IMAGES
Bitcoin is a high sentiment beta asset, and unless that changes, Bitcoin cannot serve as a global mainstream medium of exchange. Being a high sentiment beta asset means that Bitcoin’s market price is driven much more by investor psychology than by underlying fundamentals.

As a general matter, high sentiment beta assets are difficult to value and difficult to arbitrage. Bitcoin qualifies in this regard. As a general matter, there is great disagreement among investors about the fair values of high sentiment beta assets. Bitcoin qualifies in this regard.

One major disagreement about Bitcoin involves the very high demand for electrical power associated with Bitcoin transaction processing, an issue that came to light several years ago. In recent months, the issue has surfaced again, in a drama featuring disagreement between two prominent industry leaders, Elon Musk (from Tesla and SpaceX) and Jack Dorsey (from Square).

On one side of the argument, Musk contends that Bitcoin’s great need for electrical power is detrimental to the environment, especially amid disruptions in U.S. coal and nuclear power that increase supply strain.  On the other side, Dorsey argues that Bitcoin’s electricity profile is a benefit to the environment, in part because it provides a reliable customer base for clean electric power. This might make sense, in the absence of other motives for generating clean power; however, it seems to me that there has been a surge in investment in alternative technologies for producing electricity that has nothing to do with cryptocurrency. So I am not sure that the argument is especially strong, but will leave it there. In any event, this is a demand side argument.

A supply side argument favoring Bitcoin is that the processing of Bitcoin transactions, known as “Bitcoin mining,” already uses clean electrical power, power which has already been produced, as in hydroelectric plants at night, but not otherwise consumed in an era of flat electricity demand across mature markets.

Both Musk and Dorsey are serious Bitcoin investors. Earlier this year, Tesla purchased $1.5 billion of Bitcoin, agreed to accept Bitcoin as payment for automobile sales, and then reversed itself. This reversal appears to have pricked an expanding Bitcoin bubble. Square is a digital transaction processing firm, and Bitcoin is part of its long-term strategy.

Consider two big questions at the heart of the digital revolution in finance. First, to what degree will blockchain replace conventional transaction technologies? Second, to what degree will competing blockchain based digital assets, which are more efficient than Bitcoin, overcome Bitcoin’s first mover advantage as the first cryptocurrency?

To gain some insight about possible answers to these questions, and the nature of the issues related to the disagreement between Dorsey and Musk, I emailed a series of academics and/or authors who have expertise in blockchain technology.

David Yermack, a financial economist at New York University, has written and lectured extensively on blockchains. In 2019, Yermack wrote the following: “While Bitcoin and successor cryptocurrencies have grown remarkably, data indicates that many of their users have not tried to participate in the mainstream financial system. Instead they have deliberately avoided it in order to transact in black markets for drugs and other contraband … or evade capital controls in countries such as China.” In this regard, cyber-criminals demanding ransom for locking up their targets information systems often require payment in Bitcoin. Recent examples of cyber-criminal activity are not difficult to find, such as incidents involving Kaseya and Colonial Pipeline.

David Yermack continues: “However, the potential benefits of blockchain for improving data security and solving moral hazard problems throughout the financial system have become widely apparent as cryptocurrencies have grown.” In his recent correspondence with me, he argues that the electrical power issue associated with Bitcoin “mining,” is relatively minor because Bitcoin miners are incentivized to seek out cheap electric power, and patterns shifted as COVID-19 changed U.S. electricity consumption across sectors.

Thomas Philippon, also a financial economist at NYU, has done important work characterizing the impact of technology on the resource requirements of the financial sector. He has argued that historically, the financial sector has comprised about 6-to-7% of the economy on average, with variability over time. Unit costs, as a percentage of assets, have consistently been about 2%, even with technological advances. In respect to Bitcoin, he writes in his correspondence with me that Bitcoin is too energy inefficient to generate net positive social benefits, and that energy crisis pressures on U.S. electricity and fuels complicate the picture, but acknowledges that over time positive benefits might be possible.

Emin Gün Sirer is a computer scientist at Cornell University, whose venture AVA Labs has been developing alternative blockchain technology for the financial sector. In his correspondence with me, he writes that he rejects the argument that Bitcoin will spur investment in renewable energy relative to other stimuli. He also questions the social value of maintaining a fairly centralized ledger largely created by miners that had been in China and are now migrating to other locations such as El Salvador.

Bob Seeman is an engineer, lawyer, and businessman, who has written a book entitled Bitcoin: The Mother of All Scams. In his correspondence with me, he writes that his professional experience with Bitcoin led him to conclude that Bitcoin is nothing more than unlicensed gambling, a point he makes in his book.

David Gautschi is an academic at Fordham University with expertise in global energy. I asked him about studies that compare Bitcoin’s use of energy with that of the U.S. financial sector. In correspondence with me, he cautioned that the issues are complex, and noted that online technology generally consumes a lot of power, with electricity demand during COVID-19 highlighting shifting load profiles.

My question to David Gautschi was prompted by a study undertaken by the cryptocurrency firm Galaxy Digital. This study found that the financial sector together with the gold industry consumes twice as much electrical power as Bitcoin transaction processing. The claim by Galaxy is that Bitcoin’s electrical power needs are “at least two times lower than the total energy consumed by the banking system as well as the gold industry on an annual basis.”

Galaxy’s analysis is detailed and bottom up based. In order to assess the plausibility of its claims, I did a rough top down analysis whose results were roughly consistent with the claims in the Galaxy study. For sake of disclosure, I placed the heuristic calculations I ran in a footnote.1 If we accept the Galaxy numbers, there remains the question of understanding the outputs produced by the electrical consumption associated with both Bitcoin mining and U.S. banks’ production of financial services. I did not see that the Galaxy study addresses the output issue, and it is important.

Consider some quick statistics which relate to the issue of outputs. The total market for global financial services was about $20 trillion in 2020. The number of Bitcoin transactions processed per day was about 330,000 in December 2020, and about 400,000 in January 2021. The corresponding number for Bitcoin’s digital rival Ethereum during this time was about 1.1 million transactions per day. In contrast, the global number of credit card transactions per day in 2018 was about 1 billion.2

Bitcoin Value Falls
LONDON, ENGLAND - NOVEMBER 20: A visual representation of the cryptocurrencies Bitcoin and Ethereum ... [+] GETTY IMAGES
These numbers tell us that Bitcoin transactions comprise a small share, on the order of 0.04%, of global transactions, but use something like a third of the electricity needed for these transactions. That said, the associated costs of processing Bitcoin transactions relate to tying blocks of transactions together in a blockchain, not to the number of transactions. Nevertheless, even if the financial sector does indeed consume twice as much electrical power as Bitcoin, the disparity between Bitcoin and traditional financial technology is striking, and the experience of Texas grid reliability underscores system constraints when it comes to output relative to input.  This, I suggest, weakens the argument that Bitcoin’s electricity demand profile is inconsequential because Bitcoin mining uses slack electricity.

A big question is how much electrical power Bitcoin mining would require, if Bitcoin were to capture a major share of the transactions involved in world commerce. Certainly much more than it does today; but how much more?

Given that Bitcoin is a high sentiment beta asset, there will be a lot of disagreement about the answers to these two questions. Eventually we might get answers.

At the same time, a high sentiment beta asset is ill suited to being a medium of exchange and a store of value. This is why stablecoins have emerged, such as Diem, Tether, USD Coin, and Dai. Increased use of these stable alternatives might prevent Bitcoin from ever achieving a major share of the transactions involved in world commerce.

We shall see what the future brings. Certainly El Salvador’s recent decision to make Bitcoin its legal tender, and to become a leader in Bitcoin mining, is something to watch carefully. Just keep in mind that there is significant downside to experiencing foreign exchange rate volatility. This is why global financial institutions such as the World Bank and IMF do not support El Salvador’s decision; and as I keep saying, Bitcoin is a very high sentiment beta asset.

In the past I suggested that Bitcoin bubble would burst when Bitcoin investors conclude that its associated processing is too energy inefficient. Of course, many Bitcoin investors are passionate devotees, who are vulnerable to the psychological bias known as motivated reasoning. Motivated reasoning-based sentiment, featuring denial,3 can keep a bubble from bursting, or generate a series of bubbles, a pattern we can see from Bitcoin’s history.

I find the argument that Bitcoin is necessary to provide the right incentives for the development of clean alternatives for generating electricity to be interesting, but less than compelling. Are there no other incentives, such as evolving utility trends, or more efficient blockchain technologies? Bitcoin does have a first mover advantage relative to other cryptocurrencies. I just think we need to be concerned about getting locked into an technologically inferior solution because of switching costs.

There is an argument to made that decisions, such as how to use electric power, are made in markets with self-interested agents properly evaluating the tradeoffs. That said, think about why most of the world adopted the Windows operating system in the 1980s over the superior Mac operating system offered by Apple. Yes, we left it to markets to determine the outcome. People did make choices; and it took years for Windows to catch up with the Mac’s operating system.

My experience as a behavioral economist has taught me that the world is far from perfect, to expect to be surprised, and to expect people to make mistakes. We shall see what happens with Bitcoin going forward.

As things stand now, Bitcoin is well suited as an asset for fulfilling some people’s urge to engage in high stakes gambling. Indeed, many people have a strong need to engage in gambling. Last year, per capita expenditure on lottery tickets in Massachusetts was the highest in the U.S. at over $930.

High sentiment beta assets offer lottery-like payoffs. While Bitcoin certainly does a good job of that, it cannot simultaneously serve as an effective medium of exchange and reliable store of value, even setting aside the issue at the heart of the electricity debate.


Related News

View more

Sign Up for Electricity Forum’s Newsletter

Stay informed with our FREE Newsletter — get the latest news, breakthrough technologies, and expert insights, delivered straight to your inbox.

Electricity Today T&D Magazine Subscribe for FREE

Stay informed with the latest T&D policies and technologies.
  • Timely insights from industry experts
  • Practical solutions T&D engineers
  • Free access to every issue

Live Online & In-person Group Training

Advantages To Instructor-Led Training – Instructor-Led Course, Customized Training, Multiple Locations, Economical, CEU Credits, Course Discounts.

Request For Quotation

Whether you would prefer Live Online or In-Person instruction, our electrical training courses can be tailored to meet your company's specific requirements and delivered to your employees in one location or at various locations.