Rhode Island PUC approves infrastructure improvement plans

By National Grid


NFPA 70e Training

Our customized live online or in‑person group training can be delivered to your staff at your location.

  • Live Online
  • 6 hours Instructor-led
  • Group Training Available
Regular Price:
$199
Coupon Price:
$149
Reserve Your Seat Today
PROVIDENCE, R.I. – National Grid is ready to move forward on its statewide Infrastructure, Safety and Reliability ISR Plans for the coming year for both natural gas and electric system improvements approved by the Rhode Island Public Utilities Commission.

The ISR Plans are submitted annually and outline the companyÂ’s proposed upgrades to the stateÂ’s aging electric and gas infrastructure. The Fiscal Year 2016 plan calls for an investment of more than $150 million, ranging from electric substation upgrades to natural gas pipeline replacement.

“National Grid is committed to improving and sustaining our electric and gas infrastructure in Rhode Island. The Commission’s approval of our two plans will allow our customers to continue to receive safe and reliable energy for years to come,” said Timothy F. Horan, president of National Grid in Rhode Island. “We look forward to working closely with local public works officials and communities as we begin this year’s improvement projects throughout the state.”

Electric System Improvements

National GridÂ’s effort to upgrade the stateÂ’s electric distribution system, a $73.3 million investment for Fiscal Year 2016, includes the following customer projects, among others:

- South Street Substation – Replacing existing equipment to address capacity and asset condition issues to accommodate existing and future electric needs of downtown Providence, with project completion in 2019.

- Aquidneck Island – Installing new substation, sub-transmission line, and distribution feeders to address normal and contingency electricity load and retire five substations in Newport and Middletown, with project completion in 2019.

- Quonset Substation & Electric Boat Expansion – Expanding the substation and distribution to address asset condition, area capacity and Electric Boat’s proposed expansions, with projected completion in 2017.

- Ongoing Vegetation Management – To mitigate potential outages caused by hazardous trees near power lines, National Grid will trim approximately 1,250 miles of trees each year, working within a four-year trimming cycle.

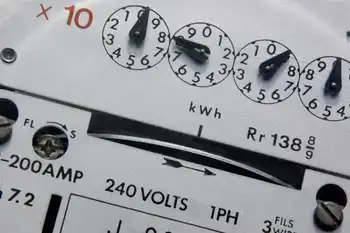
ISR costs are included in the delivery charges side of a customerÂ’s bill. Based solely on this yearÂ’s ISR Plan approved by the PUC, a typical residential customer using 500 KWH each month would see an increase of less than one percent, or 79 cents each month. However, when combined with other delivery service rate changes that took effect on April 1, the same customer will see a monthly bill decrease of $1.35. Bills will go from $98.81 to $97.46.

Natural Gas System Improvements

National GridÂ’s effort to upgrade Rhode IslandÂ’s natural gas infrastructure, a $76.8 million investment for Fiscal Year 2016, includes the following customer projects, among others:

- Proactive replacement and improvement of more than 50 miles of leak-prone pipeline throughout the state.

- Structural upgrades to natural gas pressure regulating facilities.

- Gas system expansion, including the installation of new gas mains and service lines

- Gas planning work, including the elimination of single feeds, valve work, system resiliency and more.

- LNG plant improvements in Exeter and Cumberland.

Through the construction and completion phases of these improvement projects, National Grid will work closely with local municipalities to mitigate traffic disruptions, and will notify abutting property owners of construction work schedules.

The average residential heating customer using 846 therms per year will experience an average increase of $2.83, or 2.7 percent, on their monthly natural gas bill.

Related News

Construction starts on disputed $1B electricity corridor

New England Clean Energy Connect advances despite court delays, installing steel poles on a Maine corridor for Canadian hydropower, while legal challenges seek environmental review; permits, jobs, and grid upgrades drive the renewable transmission project.


Key Points

An HV line in Maine delivering 1,200 MW of Canadian hydropower to New England to cut emissions and stabilize costs.

✅ Appeals court pauses 53-mile new section; upgrades continue

✅ 1,200 MW hydropower aims to cut emissions, stabilize rates

✅ Permits issued; environmental review litigation ongoing


Construction on part of a $1 billion electricity transmission corridor through sparsely populated woods in western Maine is on hold because of legal action, echoing Clean Line's Iowa withdrawal amid court uncertainty, but that doesn't mean all building has been halted.

Workers installed the first of 829 steel poles Tuesday on a widened portion of the existing corridor that is part of the project near The Forks, as the groundwork is laid for the 145-mile ( 230-kilometre ) New England Clean Energy Connect, a project central to Maine's debate over the 145-mile line moving forward.

The work is getting started even though the 1st U.S. Circuit Court of Appeals delayed construction of a new 53-mile ( 85-kilometre ) section.

Three conservation groups are seeking an injunction to delay the project while they sue to force the U.S. Army Corps of Engineers to conduct a more rigorous environmental review.

In western Maine, workers already have staged heavy equipment and timber “mats” that will be used to prevent the equipment from damaging the ground. About 275 Maine workers already have been hired, and more would be hired if not for the litigation, officials said.

“This project has always promised to provide an economic boost to Maine’s economy, and we are already seeing those benefits take shape," Thorn Dickinson, CEO of the New England Clean Energy Connect, said Tuesday.

The electricity transmission line would provide a conduit for up to 1,200 megawatts of Canadian hydropower, reducing greenhouse emissions and stabilizing energy costs in New England as states pursue Connecticut's market overhaul to improve market design, supporters say.

The project, which would be fully funded by Massachusetts ratepayers to meet the state's clean energy goals after New Hampshire rejected a Quebec-Massachusetts proposal elsewhere, calls for construction of a high-voltage power line from Mount Beattie Township on the Canadian border to the regional power grid in Lewiston, Maine.

Critics have been trying to stop the project, reflecting clashes over New Hampshire hydropower in the region, saying it would destroy wilderness in western Maine. They also say that the environmental benefits of the project have been overstated.

In addition to the lawsuit, opponents have submitted petitions seeking to have a statewide vote, even as a Maine court ruling on Hydro-Quebec exports has reshaped the legal landscape.

Sandi Howard, a leading opponent of the project, said the decision by the company to proceed showed “disdain for everyday Mainers” by ignoring permit appeals and ongoing litigation.

“For years, CMP has pushed the false narrative that their unpopular and destructive project is a ‘done deal’ to bully Mainers into submission on this for-profit project. But to be clear, we won’t stop until Maine voters (their customers), have the chance to vote,” said Howard, who led the referendum petition drive for the No CMP Corridor PAC.

The project has received permits from the Army Corps, Maine Department of Environmental Protection, Maine Land Use Planning Commission and Maine Public Utilities Commission.

The final approval came in the form of a presidential permit issued last month from the U.S. Department of Energy, providing green light for the interconnect at the Canadian border, even as customer backlash to utility acquisitions elsewhere underscores public scrutiny.


Related News

View more

BloombergNEF: World offshore wind costs 'drop 32% per cent'

Global Renewable LCOE Trends reveal offshore wind costs down 32%, with 10MW turbines, lower CAPEX and OPEX, and parity for solar PV and onshore wind in Europe, China, and California, per BloombergNEF analysis.


Key Points

Benchmarks showing falling LCOE for offshore wind, onshore wind, and solar PV, driven by larger turbines and lower CAPEX

✅ Offshore wind LCOE $78/MWh; $53-64/MWh in DK/NL excl. transmission

✅ Onshore wind $47/MWh; solar PV $51/MWh, best $26-36/MWh

✅ Cost drivers: 10MW turbines, lower CAPEX/OPEX, weak China demand


World offshore wind costs have fallen 32% from just a year ago and 12% compared with the first half of 2019, according to a BNEF long-term outlook from BloombergNEF.

In its latest Levelized Cost of Electricity (LCOE) Update, BloombergNEF said its current global benchmark LCOE estimate for offshore wind is $78 a megawatt-hour.

“New offshore wind projects throughout Europe, including the UK's build-out, now deploy turbines with power ratings up to 10MW, unlocking CAPEX and OPEX savings,” BloombergNEF said.

In Denmark and the Netherlands, it expects the most recent projects financed to achieve $53-64/MWh excluding transmission.

New solar and onshore wind projects have reached parity with average wholesale power prices in California and parts of Europe, while in China levelised costs are below the benchmark average regulated coal price, according to BloombergNEF.

The company's global benchmark levelized cost figures for onshore wind and PV projects financed in the last six months are at $47 and $51 a megawatt-hours, underscoring that renewables are now the cheapest new electricity option in many regions, down 6% and 11% respectively compared with the first half of 2019.

BloombergNEF said for wind this is mainly down to a fall in the price of turbines – 7% lower on average globally compared with the end of 2018.

In China, the world’s largest solar market, the CAPEX of utility-scale PV plants has dropped 11% in the last six months, reaching $0.57m per MW.

“Weak demand for new plants in China has left developers and engineering, procurement and construction firms eager for business, and this has put pressure on CAPEX,” BloombergNEF said.

It added that estimates of the cheapest PV projects financed recently – in India, Chile and Australia – will be able to achieve an LCOE of $27-36/MWh, assuming competitive returns for their equity investors.

Best-in-class onshore wind farms in Brazil, India, Mexico and Texas can reach levelized costs as low as $26-31/MWh already, the research said.

Programs such as the World Bank wind program are helping developing countries accelerate wind deployment as costs continue to drop.

BloombergNEF associate in the energy economics team Tifenn Brandily said: “This is a three- stage process. In phase one, new solar and wind get cheaper than new gas and coal plants on a cost-of- energy basis.

“In phase two, renewables reach parity with power prices. In phase three, they become even cheaper than running existing thermal plants.

“Our analysis shows that phase one has now been reached for two-thirds of the global population.

“Phase two started with California, China and parts of Europe. We expect phase three to be reached on a global scale by 2030.

“As this all plays out, thermal power plants will increasingly be relegated to a balancing role, looking for opportunities to generate when the sun doesn’t shine or the wind doesn’t blow.”


Related News

View more

Scotland’s Wind Farms Generate Enough Electricity to Power Nearly 4.5 Million Homes

Scotland Wind Energy delivered record renewable power as wind turbines and farms generated 9,831,320 MWh in H1 2019, supplying clean electricity for every home twice and supporting northern England, according to WWF data.


Key Points

Term for Scotland's wind power output, highlighting 2019 records, clean electricity, and progress on decarbonization.

✅ 9,831,320 MWh generated Jan-Jun 2019 by wind farms

✅ Enough to power 4.47 million homes twice in that period

✅ Advances decarbonization and 2030 renewables, 2050 net-zero goals


Wind turbines in Scotland produced enough electricity in the first half of 2019, reflecting periods when wind led the power mix across the UK, to power every home in the country twice over, according to new data by the analytics group WeatherEnergy. The wind farms generated 9,831,320 megawatt-hours between January and June, as the UK set a wind generation record in comparable periods, equal to the total electricity consumption of 4.47 million homes during that same period.

The electricity generated by wind in early 2019 is enough to power all of Scotland’s homes, as well as a large portion of northern England’s, highlighting how wind and solar exceeded nuclear in the UK in recent milestones as well, and events such as record UK output during Storm Malik underscore this capacity.

“These are amazing figures,” Robin Parker, climate and energy policy manager at WWF, which highlighted the new data, said in a statement. “Scotland’s wind energy revolution is clearly continuing to power ahead, as wind became the UK’s main electricity source in a recent first. Up and down the country, we are all benefitting from cleaner energy and so is the climate.”

Scotland currently has a target of generating half its electricity from renewables by 2030, a goal buoyed by milestones like more UK electricity from wind than coal in 2016, and decarbonizing its energy system almost entirely by 2050. Experts say the latest wind energy data shows the country could reach its goal far sooner than originally anticipated, especially with complementary technologies such as tidal power in Scottish waters gaining traction.


Related News

View more

UK low-carbon electricity generation stalls in 2019

UK low-carbon electricity 2019 saw stalled growth as renewables rose slightly, wind expanded, nuclear output fell, coal hit record lows, and net-zero targets demand faster deployment to cut CO2 intensity below 100gCO2/kWh.


Key Points

Low-carbon sources supplied 54% of UK power in 2019, up just 1TWh; wind grew, nuclear fell, and coal dropped to 2%.

✅ Wind up 8TWh; nuclear down 9TWh amid outages

✅ Fossil fuels 43% of generation; coal at 2%

✅ Net-zero needs 15TWh per year added to 2030


The amount of electricity generated by low-carbon sources in the UK stalled in 2019, Carbon Brief analysis shows.

Low-carbon electricity output from wind, solar, nuclear, hydro and biomass rose by just 1 terawatt hour (TWh, less than 1%) in 2019. It represents the smallest annual increase in a decade, where annual growth averaged 9TWh. This growth will need to double in the 2020s to meet UK climate targets while replacing old nuclear plants as they retire.

Some 54% of UK electricity generation in 2019 came from low-carbon sources, including 37% from renewables and 20% from wind alone, underscoring wind's leading role in the power mix during key periods. A record-low 43% was from fossil fuels, with 41% from gas and just 2% from coal, also a record low. In 2010, fossil fuels generated 75% of the total.

Carbon Brief’s analysis of UK electricity generation in 2019 is based on figures from BM Reports and the Department for Business, Energy and Industrial Strategy (BEIS). See the methodology at the end for more on how the analysis was conducted.

The numbers differ from those published earlier in January by National Grid, which were for electricity supplied in Great Britain only (England, Wales and Scotland, but excluding Northern Ireland), including via imports from other countries.

Low-carbon low
In 2019, the UK became the first major economy to target net-zero greenhouse gas emissions by 2050, increasing the ambition of its legally binding Climate Change Act.

To date, the country has cut its emissions by around two-fifths since 1990, with almost all of its recent progress coming from the electricity sector.

Emissions from electricity generation have fallen rapidly in the decade since 2010 as coal power has been almost phased out and even gas output has declined. Fossil fuels have been displaced by falling demand and by renewables, such as wind, solar and biomass.

But Carbon Brief’s annual analysis of UK electricity generation shows progress stalled in 2019, with the output from low-carbon sources barely increasing compared to a year earlier.

The chart below shows low-carbon generation in each year since 2010 (grey bars) and the estimated level in 2019 (red). The pale grey bars show the estimated future output of existing low-carbon sources after old nuclear plants retire and the pale red bars show the amount of new generation needed to keep electricity sector emissions to less than 100 grammes of CO2 per kilowatt hour (gCO2/kWh), the UK’s nominal target for the sector.

 Annual electricity generation in the UK by fuel, terawatt hours, 2010-2019. Top panel: fuel by fuel. Bottom panel: cumulative total generation from all sources. Source: BEIS energy trends, BM Reports and Carbon Brief analysis. Chart by Carbon Brief using Highcharts.
As the chart shows, the UK will require significantly more low-carbon electricity over the next decade as part of meeting its legally binding climate goals.

The nominal 100gCO2/kWh target for 2030 was set in the context of the UK’s less ambitious goal of cutting emissions to 80% below 1990 levels by 2050. Now that the country is aiming to cut emissions to net-zero by 2050, that 100gCO2/kWh indicator is likely to be the bare minimum.

Even so, it would require a rapid step up in the pace of low-carbon expansion, compared to the increases seen over the past decade. On average, low-carbon generation has risen by 9TWh each year in the decade since 2010 – including a rise of just 1TWh in 2019.

Given scheduled nuclear retirements and rising demand expected by the Committee on Climate Change (CCC) – with some electrification of transport and heating – low-carbon generation would need to increase by 15TWh each year until 2030, just to meet the benchmark of 100gCO2/kWh.

For context, the 3.2 gigawatt (GW) Hinkley C new nuclear plant being built in Somerset will generate around 25TWh once completed around 2026. The world’s largest offshore windfarm, the 1.2GW Hornsea One scheme off the Yorkshire coast, will generate around 5TWh each year.

The new Conservative government is targeting 40GW of offshore wind by 2030, up from today’s figure of around 8GW. If policies are put in place to meet this goal, then it could keep power sector emissions below 100gCO2/kWh, depending on the actual performance of the windfarms built.

However, new onshore wind and solar, further new nuclear or other low-carbon generation, such as gas with carbon capture and storage (CCS), is likely to be needed if demand is higher than expected, or if the 100gCO2/kWh benchmark is too weak in the context of net-zero by 2050.

The CCC says it is “likely” to “reflect the need for more rapid deployment” of low-carbon towards net-zero emissions in its advice on the sixth UK carbon budget for 2033-2037, due in September.

Trading places
Looking more closely at UK electricity generation in 2019, Carbon Brief’s analysis shows why there was so little growth for low-carbon sources compared to the previous year.

There was another increase for wind power in 2019 (up 8TWh, 14%), with record wind generation as several large new windfarms were completed including the 1.2GW Hornsea One project in October and the 0.6GW Beatrice offshore windfarm in Q2 of 2019. But this was offset by a decline for nuclear (down 9TWh, 14%), due to ongoing outages for reactors at Hunterston in Scotland and Dungeness in Kent.

(Analysis of data held by trade organisation RenewableUK suggests some 0.6GW of onshore wind capacity also started operating in 2019, including the 0.2GW Dorenell scheme in Moray, Scotland.)

As a result of these movements, the UK’s windfarms overtook nuclear for the first time ever in 2019, becoming the country’s second-largest source of electricity generation, and earlier, wind and solar together surpassed nuclear in the UK as momentum built. This is shown in the figure below, with wind (green line, top panel) trading places with nuclear (purple) and gas (dark blue) down around 25% since 2010 but remaining the single-largest source.

 Annual electricity generation in the UK by fuel, terawatt hours, 2010-2019. Top panel: fuel by fuel. Bottom panel: cumulative total generation from all sources. Source: BEIS energy trends, BM Reports and Carbon Brief analysis. Chart by Carbon Brief using Highcharts.
The UK’s currently suspended nuclear plants are due to return to service in January and March, according to operator EDF, the French state-backed utility firm. However, as noted above, most of the UK’s nuclear fleet is set to retire during the 2020s, with only Sizewell B in Suffolk due to still be operating by 2030. Hunterston is scheduled to retire by 2023 and Dungeness by 2028.

Set against these losses, the UK has a pipeline of offshore windfarms, secured via “contracts for difference” with the government, at a series of auctions. The most recent auction, in September 2019, saw prices below £40 per megawatt hour – similar to current wholesale electricity prices.

However, the capacity contracted so far is not sufficient to meet the government’s target of 40GW by 2030, meaning further auctions – or some other policy mechanism – will be required.

Coal zero
As well as the switch between wind and nuclear, 2019 also saw coal fall below solar for the first time across a full year, echoing the 2016 moment when wind outgenerated coal across the UK, after it suffered another 60% reduction in electricity output. Just six coal plants remain in the UK, with Aberthaw B in Wales and Fiddlers Ferry in Cheshire closing in March.

Coal accounted for just 2% of UK generation in 2019, a record-low coal share since centralised electricity supplies started to operate in 1882. The fuel met 40% of UK needs as recently as 2012, but has plummeted thanks to falling demand, rising renewables, cheaper gas and higher CO2 prices.

The reduction in average coal generation hides the fact that the fuel is now often not required at all to meet the UK’s electricity needs. The chart below shows the number of days each year when coal output was zero in 2019 (red line) and the two previous years (blue).

 Cumulative number of days when UK electricity generation from renewable sources has been higher than that from fossil fuels. Source: BEIS energy trends, BM Reports and Carbon Brief analysis. Chart by Carbon Brief using Highcharts.
The 83 days in 2019 with zero coal generation amount to nearly a quarter of the year and include the record-breaking 18-day stretch without the fuel.

Great Britain has been running for a record TWO WEEKS without using coal to generate electricity – the first time this has happened since 1882.

The country’s grid has been coal-free for 45% of hours in 2019 so far.https://www.carbonbrief.org/countdown-to-2025-tracking-the-uk-coal-phase-out …

Coal generation was set for significant reductions around the world in 2019 – including a 20% reduction for the EU as a whole – according to analysis published by Carbon Brief in November.

Notably, overall UK electricity generation fell by another 9TWh in 2019 (3%), bringing the total decline to 58TWh since 2010. This is equivalent to more than twice the output from the Hinkley C scheme being built in Somerset. As Carbon Brief explained last year, falling demand has had a similar impact on electricity-sector CO2 emissions as the increase in output from renewables.

This is illustrated by the fact that the 9TWh reduction in overall generation translated into a 9TWh (6%) cut in fossil-fuel generation during 2019, with coal falling by 10TWh and gas rising marginally.

Increasingly renewable
As fossil-fuel output and overall generation have declined, the UK’s renewable sources of electricity have continued to increase. Their output has risen nearly five-fold in the past decade and their share of the UK total has increased from 7% in 2010 to 37% in 2019.

As a result, the UK’s increasingly renewable grid is seeing more minutes, hours and days during which the likes of wind, solar and biomass collectively outpace all fossil fuels put together, and on some days wind is the main source as well.

The chart below shows the number of days during each year when renewables generated more electricity than fossil fuels in 2019 (red line) and each of the previous four years (blue lines). In total, nearly two-fifths of days in 2019 crossed this threshold.

 Cumulative number of days when the UK has not generated any electricity from coal. Source: BEIS energy trends, BM Reports and Carbon Brief analysis. Chart by Carbon Brief using Highcharts.
There were also four months in 2019 when renewables generated more of the UK’s electricity than fossil fuels: March, August, September and December. The first ever such month came in September 2018 and more are certain to follow.

National Grid, which manages Great Britain’s high-voltage electricity transmission network, is aiming to be able to run the system without fossil fuels by 2025, at least for short periods. At present, it sometimes has to ask windfarm operators to switch off and gas plants to start running in order to keep the electricity grid stable.

Note that biomass accounted for 11% of UK electricity generation in 2019, nearly a third of the total from all renewables. Some two-thirds of the biomass output is from “plant biomass”, primarily wood pellets burnt at Lynemouth in Northumberland and the Drax plant in Yorkshire. The remainder was from an array of smaller sites based on landfill gas, sewage gas or anaerobic digestion.

The CCC says the UK should “move away” from large-scale biomass power plants, once existing subsidy contracts for Drax and Lynemouth expire in 2027.

Using biomass to generate electricity is not zero-carbon and in some circumstances could lead to higher emissions than from fossil fuels. Moreover, there are more valuable uses for the world’s limited supply of biomass feedstock, the CCC says, including carbon sequestration and hard-to-abate sectors with few alternatives.

Methodology
The figures in the article are from Carbon Brief analysis of data from BEIS Energy Trends chapter 5 and chapter 6, as well as from BM Reports. The figures from BM Reports are for electricity supplied to the grid in Great Britain only and are adjusted to include Northern Ireland.

In Carbon Brief’s analysis, the BM Reports numbers are also adjusted to account for electricity used by power plants on site and for generation by plants not connected to the high-voltage national grid. This includes many onshore windfarms, as well as industrial gas combined heat and power plants and those burning landfill gas, waste or sewage gas.

By design, the Carbon Brief analysis is intended to align as closely as possible to the official government figures on electricity generated in the UK, reported in BEIS Energy Trends table 5.1.

Briefly, the raw data for each fuel is in most cases adjusted with a multiplier, derived from the ratio between the reported BEIS numbers and unadjusted figures for previous quarters.

Carbon Brief’s method of analysis has been verified against published BEIS figures using “hindcasting”. This shows the estimates for total electricity generation from fossil fuels or renewables to have been within ±3% of the BEIS number in each quarter since Q4 2017. (Data before then is not sufficient to carry out the Carbon Brief analysis.)

For example, in the second quarter of 2019, a Carbon Brief hindcast estimates gas generation at 33.1TWh, whereas the published BEIS figure was 34.0TWh. Similarly, it produces an estimate of 27.4TWh for renewables, against a BEIS figure of 27.1TWh.

National Grid recently shared its own analysis for electricity in Great Britain during 2019 via its energy dashboard, which differs from Carbon Brief’s figures.


Related News

View more

Tornadoes and More: What Spring Can Bring to the Power Grid

Spring Storm Grid Risks highlight tornado outbreaks, flooding, power outages, and transmission disruptions, with NOAA flood outlooks, coal and barge delays, vulnerable nuclear sites, and distribution line damage demanding resilience, reliability, and emergency preparedness.


Key Points

Spring Storm Grid Risks show how tornadoes and floods disrupt power systems, fuel transport, and plants guide resilience.

✅ Tornado outbreaks and derechos damage distribution and transmission

✅ Flooding drives outages via treefall, substation and plant inundation

✅ Fuel logistics disrupted: rail coal, river barges, road access


The storm and tornado outbreak that recently barreled through the US Midwest, South and Mid-Atlantic was a devastating reminder of how much danger spring can deliver, despite it being the “milder” season compared to summer and winter.  

Danger season is approaching, and the country is starting to see the impacts. 

The event killed at least 32 people across seven states. The National Weather Service is still tallying up the number of confirmed tornadoes, which has already passed 100. Communities coping with tragedy are assessing the damage, which so far includes at least 72 destroyed homes in one Tennessee county alone, and dozens more homes elsewhere. 

On Saturday, April 1–the day after the storm struck–there were 1.1 million US utility customers without power, even as EIA reported a January power generation surge earlier in the year. On Monday morning, April 3, there were still more than 80,000 customers in the dark, according to PowerOutage.us. The storm system brought disruptions to both distribution grids–those networks of local power lines you generally see running overhead to buildings–as well as the larger transmission grid in the Midwest, which is far less common than distribution-level issues. 

While we don’t yet have a lot of granular details about this latest storm’s grid impacts, recent shifts in demand like New York City's pandemic power patterns show how operating conditions evolve, and it’s worth going through what else the country might be in for this spring, as well as in future springs. Moreover, there are steps policymakers can take to prepare for these spring weather phenomena and bolster the reliability and resilience of the US power system. 

Heightened flood risk 
The National Oceanic Atmospheric Administration (NOAA) said in a recent outlook that about 44 percent of the United States is at risk of floods this spring, equating to about 146 million people. This includes most of the eastern half of the country, the federal agency said. 

The agency also sees “major” flood risk potential in some parts of the Upper Mississippi River Basin, and relatively higher risk in the Sierra Nevada region, due in part to a historic snowpack in California.  

Multiple components of the power system can be affected by spring floods. 

Power lines – Floods can saturate soil and make trees more likely to uproot and fall onto power lines. This has been contributing to power outages during California’s recent heavy storms–called atmospheric rivers–that started over the winter. In other regions, soil moisture has even been used as a predictor of where power outages will occur due to hurricanes, so that utility companies are better prepared to send line repair crews to the right areas. Hurricanes are primarily a summer and fall phenomenon, and summer also brings grid stress from air conditioning demand in many states, so for now, during spring, they are less of a concern.  

Fuel transport – Spring floods can hinder the transportation of fuels like coal. While it is a heavily polluting fossil fuel that is set to continue declining as a fuel source for US electricity generation, with the EIA summer outlook for wind and solar pointing to further shifts, coal still accounted for roughly 20 percent of the country’s generation in 2022.   

About 70 percent of US coal is transported at least part of the way by trains. The rail infrastructure to transport coal from the Powder River Basin in Montana and Wyoming–the country’s primary coal source–was proven to be vulnerable to extreme floods in the spring of 2011, and even more extreme floods in the spring of 2019. The 2019 floods’ disruptions of coal shipments to power plants via rail persisted for months and into the summertime, also affecting river shipments of coal by barge. In June 2019, hundreds of barges were stalled in the Mississippi River, through which millions of tons of the fossil fuel are normally transported. 

Power plants – Power plants themselves can also be at risk of flooding, since most of them are sited near a source of water that is used to create steam to spin the plants’ turbines, and conversely, low water levels can constrain hydropower as seen in Western Canada hydropower drought during recent reservoir shortfalls. Most US fossil fuel generating capacity from sources like methane gas, which recently set natural gas power records across the grid, and coal utilizes steam to generate electricity. 

However, much of the attention paid to the flood risk of power plant sites has centered on nuclear plants, a key source of low-carbon electricity discussed in IAEA low-carbon electricity lessons that also require a water source for the creation of steam, as well as for keeping the plant cool in an emergency. To name a notable flood example here in the United States–both visually and substantively–in 2011, the Fort Calhoun nuclear plant in Nebraska was completely surrounded by water due to late-spring flooding along the Missouri River. This sparked a lot of concerns because it was just a few months after the March 2011 meltdown of the Fukushima Daiichi nuclear plant in Japan. The public was thankfully not harmed by the Nebraska incident, but this was unfortunately not an isolated incident in terms of flood risks posed to the US nuclear power fleet. 


Related News

View more

Florida says no to $400M in federal solar energy incentives

Florida Solar for All Opt-Out highlights Gov. DeSantis rejecting EPA grant funds under the Inflation Reduction Act, limiting low-income households' access to solar panels, clean energy programs, and promised electricity savings across disadvantaged communities.


Key Points

Florida Solar for All Opt-Out is the state declining EPA grants, restricting low-income access to solar energy savings.

✅ EPA grant under IRA aimed at low-income solar

✅ Estimated 20% electricity bill savings missed

✅ Florida lacks PPAs and renewable standards


Florida has passed up on up to $400 million in federal money that would have helped low-income households install solar panels.

A $7 billion grant “competition” to promote clean energy in disadvantaged communities by providing low-income households with access to affordable solar energy was introduced by President Joe Biden earlier this year, and despite his climate law's mixed results in practice, none of that money will reach Florida households.

The Environmental Protection Agency announced the competition in June as part of Biden’s Inflation Reduction Act. However, Florida Gov. Ron DeSantis has decided to pass on the $400 million up for grabs by choosing to opt out of the opportunity.

Inflation Reduction Act:What is the Inflation Reduction Act? Everything to know about one of Biden's big laws

The program would have helped Florida households reduce their electricity costs by a minimum of 20% during a key time when Floridians are leaving in droves due to a rising cost of living associated with soaring insurance costs, inflation, and proposed FPL rate hikes statewide.

Florida was one of six other states that chose not to apply for the money.

President Joe Biden announced a $7 billion “competition” to promote clean energy in disadvantaged communities.

The opportunity, named “Solar for All,” was announced by the EPA in June and promised to provide up to $7 billion in grants to states, territories, tribal governments, municipalities, and nonprofits to expand the number of low-income and disadvantaged communities primed for residential solar investment — enabling millions of low-income households to access affordable, resilient and clean solar energy.

The grant is intended to help lower energy costs for families, create jobs and help reduce greenhouse effects that accelerate global climate change by providing financial support and incentives to communities that were previously locked out of investments.


How much money would Floridians save under the ‘Solar for All’ solar panel grant?

The program aims to reduce household electricity costs by at least 20%. Florida households paid an average of $154.51 per month for electricity in 2022, just over 14% of the national average of $135.25, and debates over hurricane rate surcharges continue to shape customer bills, according to the U.S. Energy Information Administration. A 20% savings would drop those bills down to around $123 per month.

On the campaign trail, DeSantis has pledged to unravel Biden’s green energy agenda if elected president, amid escalating solar policy battles nationwide, slamming the Inflation Reduction Act and what he called “a concerted effort to ramp up the fear when it comes to things like global warming and climate change.”

His energy agenda includes ending Biden’s subsidies for electric cars while pushing policies that he says would ramp up domestic oil production.

“The subsidies are going to drive inflation higher,” DeSantis said at an event in September. “It’s not going to help with interest rates, and it is certainly not going to help with our unsustainable debt levels.”

DeSantis heading to third debate:As he enters third debate, Ron DeSantis has a big Nikki Haley problem

DeSantis’ plan to curb clean energy usage in Florida seems to be at odds with the state as a whole, and the region's evolving strategy for the South underscores why it has been ranked among the top three states to go solar since 2019, according to the Solar Energy Industries Association (SEIA).

SEIA also shows, however, that Florida lags behind many other states when it comes to solar policies, as utilities tilt the solar market in ways that influence policy outcomes statewide. Florida, for instance, has no renewable energy standards, which are used to increase the use of renewable energy sources for electricity by requiring or encouraging suppliers to provide customers with a stated minimum share of electricity from eligible renewable resources, according to the EIA.

Power purchase agreements, which can help lower the cost of going solar through third-party financing, are also not allowed in Florida, with court rulings on monopolies reinforcing the existing market structure. And there have been other policies implemented that drove other potential solar investments to other states.


Related News

View more

Sign Up for Electricity Forum’s Newsletter

Stay informed with our FREE Newsletter — get the latest news, breakthrough technologies, and expert insights, delivered straight to your inbox.

Electricity Today T&D Magazine Subscribe for FREE

Stay informed with the latest T&D policies and technologies.
  • Timely insights from industry experts
  • Practical solutions T&D engineers
  • Free access to every issue

Live Online & In-person Group Training

Advantages To Instructor-Led Training – Instructor-Led Course, Customized Training, Multiple Locations, Economical, CEU Credits, Course Discounts.

Request For Quotation

Whether you would prefer Live Online or In-Person instruction, our electrical training courses can be tailored to meet your company's specific requirements and delivered to your employees in one location or at various locations.