Protective Relay Training - Basic
Our customized live online or in‑person group training can be delivered to your staff at your location.

- Live Online
- 12 hours Instructor-led
- Group Training Available
Regular Price:
$699
Coupon Price:
$599
Hydro-Québec ranks highest among large utilities, Manitoba Hydro ranks highest among medium-large utilities, and Newfoundland Power ranks highest among medium-size utilities in satisfying residential electric utility customers in Canada, according to the J.D. Power and Associates 2007 Canadian Electric Utility Residential Customer Satisfaction Study.
The inaugural study measures customer satisfaction based on responses from residential customers served by the 14 largest retail electric utility companies, which collectively represent more than 10 million residential customers.
In each of the three segments — Large (serving 650,000 residential customers or more), Medium-Large (serving between 400,000 and 650,000 customers) and Medium (serving 200,000 to 400,000 customers) — customer satisfaction is measured for six factors, listed in order of importance: power quality and reliability; price and value; corporate citizenship; billing and payment; communications; and customer service.
The study finds that providing comprehensive information to customers can help mitigate decreases in satisfaction resulting from power outages. Among customers who called their utility company to report an outage, overall satisfaction is 55 points higher (on a 1,000-point scale) for customers who say they received at least four items of information, compared with customers who report receiving at least one.
“While weather and other circumstances affecting power quality and reliability may be out of a utility company’s control, managing an outage situation through effective and thorough communication is within their capacity, and can go a long way toward increasing customer satisfaction,” said Alan Destribats, vice president of the utility practice at J.D. Power and Associates.
“With only 47 per cent of customers reporting that they recall receiving a communication from their utility in the previous year, this is a notable opportunity for improvement throughout the industry.”
Communication regarding a utility company’s corporate citizenship activities also helps increase satisfaction scores. Customers who say that they are aware of at least one of the four following corporate citizenship initiatives — donations/sponsorships; improving environmental impact; energy conservation programs; or building new power plants — provide satisfaction scores that are 75 points higher than customers who are not aware of their utility’s initiatives.
Among large utilities, Hydro-Québec ranks highest in customer satisfaction, earning a score of 621 on a 1,000-point scale. Hydro-Québec performs particularly well in all six factors driving satisfaction.
Manitoba Hydro ranks highest in customer satisfaction among medium-large utilities, achieving a score of 625 and performing particularly well in four of the six factors: billing and payment; communications; corporate citizenship; and price and value. Following Manitoba Hydro in the rankings are SaskPower (603), which performs well in customer service, and ENMAX (595), which performs well in power quality and reliability.
Newfoundland Power ranks highest among medium utilities in customer satisfaction, earning a score of 616 and performing particularly well in all six factors. Also performing above the industry average is Hydro Ottawa, with 550 index points.
The study also finds several other key patterns:
• The average reported bill for electric service is $155 per month. Winter and spring bills are reported to be $41 higher on average than summer and fall bills.
• Customers of medium-size utilities pay the highest reported bill amounts — averaging $185 per month — compared with an average of $158 per month for large-utility customers and an average of $136 per month for medium-large-utility customers.
• Approximately 47 per cent of residential customers pay their electric bill online through a financial services firm, compared with 7 per cent of customers who pay via mail.
Related News

35 arrested in India for stealing electricity
BEST vigilance raid on Wadala electricity theft uncovered a Mumbai power theft racket in Antop…
View more
'For now, we're not touching it': Quebec closes door on nuclear power
Quebec Energy Strategy focuses on hydropower, energy efficiency, and new dams as Hydro-Que9bec pursues Churchill…
View more
Ontario Sets Electricity Rates at Off-Peak Price until February 7
Ontario Off-Peak Electricity Rate offers 8.2 cents per kWh for 24 hours, supporting Time-of-Use and…
View more
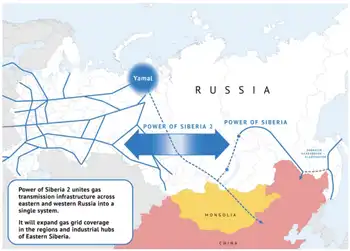
Russia to triple electricity supplies to China
Amur-Heihe ETL Power Supply Tripling will expand Russia-China electricity exports, extending 750 MW DC full-load…
View more

Growing pot sucks up electricity and pumps out an astounding amount of carbon dioxide — it doesn't have to
Sustainable Cannabis Cultivation leverages greenhouse design, renewable energy, automation, and water recapture to cut electricity…
View more
Power Outages to Mitigate Wildfire Risks
Colorado Wildfire Power Shutoffs reduce ignition risk through PSPS, grid safety protocols, data-driven forecasts, and…
View more
Sign Up for Electricity Forum’s Newsletter
Stay informed with our FREE Newsletter — get the latest news, breakthrough technologies, and expert insights, delivered straight to your inbox.
Electricity Today T&D Magazine Subscribe for FREE

Stay informed with the latest T&D policies and technologies.
- Timely insights from industry experts
- Practical solutions T&D engineers
- Free access to every issue

