Winds of change rock Wolfe Island

By Toronto Star


CSA Z462 Arc Flash Training - Electrical Safety Essentials

Our customized live online or in‑person group training can be delivered to your staff at your location.

  • Live Online
  • 6 hours Instructor-led
  • Group Training Available
Regular Price:
$249
Coupon Price:
$199
Reserve Your Seat Today
For generations, the most prominent landmarks visible on Wolfe Island from the ferry chugging back and forth from Kingston were the cross and spires of the churches in the village of Marysville.

Rather the way you'd imagine the great cosmic CEO intended it.

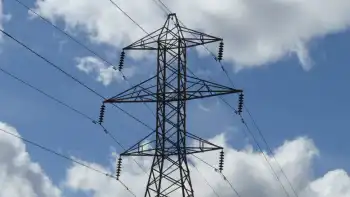
Sometime last century, progress did have its way, even on a sleepy little island where modernity has been assiduously ignored, and hydro and the odd transmission tower was installed to stretch slightly nearer the heavens.

Still, Wolfe Island, the largest of the Thousand Islands, a 25-minute ferry ride from the mainland, where Lake Ontario ends and the St. Lawrence River begins, remained a place so admirably resistant to change that things like neon and motels, chain stores and drive-thrus made no inroads at all.

Until now.

This year, things have changed utterly. The future has arrived on Wolfe Island with a wind-turbine vengeance. And many ferry passengers will surely lament this summer that one of Ontario's more tranquil refuges has been turned into a wind-turbine theme park.

Eighty-six wind turbines now tower over a flat little land mass only 35 kilometres long and 10 wide, dwarfing those churches that once claimed pride of stature.

"You can't miss 'em," sighed the lady at the inn booking a traveller's reservation.

And if opinion might be split locally about the merits of the Wolfe Island Wind Project, there can be no argument about that appraisal. The turbines are a dominating – some say overbearing – omnipresence.

The project is the second-largest in Canada and a submarine cable to the mainland delivers enough wind-generated juice to provide power for tens of thousands of homes.

Owner Canadian Hydro boasts that wind power "creates no air pollution or greenhouse gases (which contribute to climate change), leaves behind no hazardous or toxic wastes and uses no water."

Whatever the technical merits of the project, there's no question about the aesthetic impact on the island. The turbines have tilted its ambience from the pastoral to the industrial.

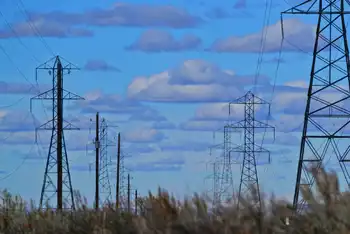
The turbines are a looming presence visible or palpable from almost anywhere on the island and the impression they leave depends a lot on one's outlook, angle, even mood.

At times, they appear like a devouring wave of massive, mantis-like insects; at others, a squadron of fighter planes. At 80 metres high, their slow, relentless spinning can be mesmerizing. Their whirr, from nearby, is like the drone of a distant plane, or the whooshing, surf-sound heard by putting an ear to a conch shell.

Now that the turbines are up and running, most locals shrug and say opposition and controversy is abating – though concerns remain about potential health effects and, recently, carved hands were placed at the turbine sites in what was taken to be a mysterious protest.

Meanwhile, not far to the west, opponents of proposed wind projects in Prince Edward County cite "the perceived ruin of Wolfe Island" as part of their call to arms.

Still, one island farmer said "once they're up, they're not hurting anything." Since the turbine kicked in on his property, "I haven't lost any sleep over it."

The turbines are even used as a selling point. The Alton Moor Golf Course says these "majestic structures provide a striking backdrop" to its nine holes and invites visitors to "golf amid the turbines."

As the farmer says, from his point of view, wind beats nuclear and coal. And he understands the motivation for the project. "There's certainly wind over here." Enough, he says, to have once blown over his 16-foot hay wagon. "They didn't put them here for nothing."

Related News

South Australia rides renewables boom to become electricity exporter

Australia electricity grid transition is accelerating as renewables, wind, solar, and storage drive decentralised generation, emissions cuts, and NEM trade shifts, with South Australia becoming a net exporter post-Hazelwood closure and rooftop solar surging.


Key Points

Australia electricity shift to renewables, distributed generation and storage, cutting emissions, reshaping NEM flows.

✅ South Australia now exports power post-Hazelwood closure

✅ Rooftop solar is the fastest-growing NEM generation source

✅ Gas peaking and storage investments balance variable renewables


The politics may not change much, but Australia’s electricity grid is changing before our very eyes – slowly and inevitably becoming more renewable, more decentralised, and in step with Australia's energy transition that is challenging the pre-conceptions of many in the industry.

The latest national emissions audit from The Australia Institute, which includes an update on key electricity trends in the national electricity market, notes some interesting developments over the last three months.

The most surprising of those developments may be the South Australia achievement, which shows that since the closure of the Hazelwood brown coal generator in Victoria in March 2017, and as renewables outpacing brown coal in other markets, South Australia has become a net exporter of electricity, in net annualised terms.

Hugh Saddler, lead author of the study, notes that this is a big change for South Australia, which in 1999 and 2000, when it had only gas and local coal, used to import 30% of its electricity demand.

#google#

The fact that wholesale prices in South Australia were higher in other states – then, as they are now – has nothing to with wind and solar, but the fact that it has no low-cost conventional source and a peaky demand profile (then and now).

“The difference today is that the state is now taking advantage of its abundant resources of wind and solar radiation, and the new technologies which have made them the lowest cost sources of new generation, to supply much of its electricity requirements,” Saddler writes.

Other things to note about the flows between states is that Victoria was about equal on imports and exports with its three neighbouring states, despite the closure of Hazelwood. NSW continues to import around 10% of its needs from cheaper providers in Queensland.

Gas-fired generation had increased in the last year or two in South Australia as a result of the Northern closure, but is still below the levels of a decade ago.

But because it is expensive, this is likely to spur more investment in storage.

As for rooftop solar, Saddler notes that the share of residential solar in the grid is still relatively small but, despite excess solar risks flagged by distributors, it is the most steadily growing generation source in the NEM.

That line is expected to grow steadily. By 2040, or perhaps 2050, the share of distributed generation, which includes rooftop solar, battery storage and demand management, is expected to reach nearly half of all Australia’s grid demand.

Saddler, says, however, that the increase in large-scale solar over the last few months is a significant milestone in Australia’s transition towards clean electricity generation, mirroring trends in India's on-grid solar development seen in recent years. (See very top graph).

“Firstly, they are a concrete demonstration that the construction cost advantage, which wind enjoyed over solar until a year or two ago, is gone.

“From now on we can expect new capacity to be a mix of both technologies. Indeed, the Clean Energy Regulator states that it expects solar to account for half of all (new renewable) capacity by 2020, and the US is moving toward 30% from wind and solar as well.”


Related News

View more

U.S. Electricity Sales Projections Continue to Fall

US Electricity Demand Outlook examines EIA forecasts, GDP decoupling, energy efficiency, electrification, electric vehicles, grid load growth, and weather variability to frame long term demand trends and utility planning scenarios.


Key Points

An analysis of EIA projections showing demand decoupling from GDP, with EV adoption and efficiency shaping future grid load.

✅ EIA lowers load growth; demand decouples from GDP.

✅ Efficiency and sector shifts depress kWh sales.

✅ EV adoption could revive load and capacity needs.


Electricity producers and distributors are in an unusual business. The product they provide is available to all customers instantaneously, literally at the flip of a switch. But the large amount of equipment, both hardware and software to do this takes years to design, site and install.

From a long range planning perspective, just as important as a good engineering design is an accurate sales projections. For the US electric utility industry the most authoritative electricity demand projec-tions come from the Department of Energy’s Energy Information Administration (EIA). EIA's compre-hensive reports combine econometric analysis with judgment calls on social and economic trends like the adoption rate of new technologies that could affect future electricity demand, things like LED light-ing and battery powered cars, and the rise of renewables overtaking coal in generation.

Before the Great Recession almost a decade ago, the EIA projected annual growth in US electricity production at roughly 1.5 percent per year. After the Great Recession began, the EIA lowered its projections of US electricity consumption growth to below 1 percent. Actual growth has been closer to zero. While the EIA did not antici-pate the last recession or its aftermath, we cannot fault them on that.

After the event, though, the EIA also trimmed its estimates of economic growth. For the 2015-2030 period it now predicts 2.1 percent economic and 0.3 percent electricity growth, down from previously projections of 2.7 percent and 1.3 percent respectively. (See Figures 1 and 2.)


Table 1. EIA electric generation projections by year of forecast (kWh billions)


Table 2. EIA forecast of GDP by year of forecast (billion 2009 $)

Back in 2007, the EIA figured that every one percent increase in economic activity required a 0.48 percent in-crease in electric generation to support it. By 2017, the EIA calculated that a 1 percent growth in economic activity now only required a 0.14 percent increase in electric output. What accounts for such a downgrade or disconnect between electricity usage and economic growth? And what factors might turn the numbers 
around?

First, the US economy lost energy intensive heavy industry like smelting, steel mills and refineries; patterns in China's electricity sector highlight how industrial shifts can reshape power demand. A more service oriented economy (think health care) relies more heavily on the movement of data or information and uses far less power than a manufacturing-oriented economy.

A small volcano in Argentina is about to fuel the next tech boom – and a little known company is going to be right at the center. Early investors stand to gain incredible profits and you can too. Read the report.

Second, internet shopping has hurt so-called "brick and mortar" retailers. Despite the departure of heavy industry, in years past a burgeoning US commercial sector increased its demand and usage of electricity to offset the industrial decline. But not anymore. Energy efficiency measures as well as per-haps greater concern about global warming and greenhouse gas emissions and have cut into electricity sales. “Do more with less” has the right ring to it.

But there may be other components to the ongoing decline in electricity usage. Academic studies show that electricity usage seems to increase with income along an S curve, and flattens out after a certain income level. That is, if you earn $1 billion per year you do not (or cannot) use ten times a much electricity as someone earning only $100 million.

But people at typical, middle income levels increase or decrease electricity usage when incomes rise or fall. The squeeze on middle income families was discussed often in the late presidential campaign. In recent decades an increasing percentage of income has gone to a small percentage of the population at the top of the income scale. This trend probably accounts for some weakness in residential sales. This suggests that government policy addressing income inequality would also boost electricity sales.

Population growth affects demand for electricity as well as the economy as a whole. The EIA has made few changes in its projections, showing 0.7 percent per year population growth in 2015- 2030 in both the 2007 and 2017 forecasts. Recent studies, however, have shown a drop in the birth rate to record lows. More troubling, from a national health perspective is that the average age of death may have stopped rising. Those two factors point to lower population growth, especially if the government also restricts immi-gration. Thus, the US may be approaching a period of rather modest population growth.

All of the above factors point to minimal sales growth for electricity producers in the US--perhaps even lower than the seemingly conservative EIA estimates. But the cloud on the horizon has a silver lining in the shape of an electric car. Both the United Kingdom and France have set dates to end of production of automobiles with internal combustion engines. Several European car makers have declared that 20 percent of their output will be electric vehicles by the early 2020s. If we adopt automobiles powered by electricity and not gasoline or diesel, electricity sales would increase by one third. For the power indus-try, electric vehicles represent the next big thing.

We don’t pretend to know how electric car sales will progress. But assume vehicle turnover rates re-main at the current 7 percent per year and electric cars account for 5 percent of sales in the first five years (as op-posed to 1 percent now), 20 percent in the next five years and 50 percent in the third five year period. Wildly optimistic assumptions? Maybe. By 2030, electric cars would constitute 28 percent of the vehicle fleet. They would add about 10 percent to kilowatt hour sales by that date, assuming that battery efficiencies do not improved by then. Those added sales would require increased electric generation output, with low-emissions sources expected to cover almost all the growth globally. They would also raise long term growth rates for 2015-2030 from the present 0.3 percent to 1.0 percent. The slow upturn in demand should give the electric companies time to gear up so to speak.

In the meantime, weather will continue to play a big role in electricity consumption. Record heat-induced demand peaks are being set here in the US even as surging global demand puts power systems under strain worldwide.

Can we discern a pattern in weather conditions 15 years out? Maybe we can, but that is one topic we don’t expect a government agency to tackle in public right now. Meantime, weather will affect sales more than anything else and we cannot predict the weather. Or can we?


Related News

View more

Ukraine Leans on Imports to Keep the Lights On

Ukraine Electricity Imports surge to record levels as EU neighbors bolster grid stability amid Russian strikes, supporting energy security, preventing blackouts, and straining cross-border transmission capacity while Ukraine rebuilds damaged infrastructure and diversifies with renewables.


Key Points

Emergency EU power purchases stabilizing Ukraine’s grid after war damage.

✅ Record 19,000 MWh per day from EU interconnectors

✅ Supports grid stability and blackout prevention

✅ Cost and transmission upgrades challenge sustainability


Russia's ongoing war in Ukraine has extended far beyond the battlefield, with critical infrastructure becoming a target. Ukraine's once-robust energy system has sustained significant damage amid energy ceasefire violations and Russian missile and drone strikes. To cope with these disruptions and maintain power supplies for Ukrainian citizens, the country is turning to record-breaking electricity imports from neighboring European nations.

Prior to the war, Ukraine enjoyed a self-sufficient energy sector, even exporting electricity to neighboring countries. However, targeted attacks on power plants and transmission lines have crippled generation capacity. The situation is particularly dire in eastern and southern Ukraine, where ongoing fighting has caused extensive damage.

Faced with this energy crisis, Ukraine is looking to Europe for a lifeline. The country's energy ministry has announced plans to import a staggering amount of electricity – exceeding 19,000 megawatt-hours (MWh) per day – to prepare for winter and stabilize supplies. This surpasses the previous record set in March 2024 and represents a significant increase in Ukraine's reliance on external power sources.

Several European nations are stepping up to support Ukraine. Countries like Poland, Slovakia, Romania, Hungary, which maintains quiet energy ties with Russia today, and Moldova have agreed to provide emergency electricity supplies. These imports will help stabilize Ukraine's power grid and prevent widespread blackouts, especially during peak consumption hours.

The reliance on imports, however, presents its own set of challenges. Firstly, the sheer volume of electricity needed puts a strain on the capacity of neighboring grids. Upgrading and expanding transmission infrastructure will be crucial to ensure a smooth flow of electricity. Secondly, the cost of imported electricity can be higher than domestically generated power amid price hikes and instability globally, placing additional pressure on Ukraine's already strained finances.

Beyond these immediate concerns, the long-term implications of relying on external energy sources need to be considered. Ukraine's long-term goal is to rebuild its own energy infrastructure and regain energy independence. International assistance, including energy security support measures, will be crucial in this endeavor. Financial aid and technical expertise can help Ukraine repair damaged power plants, diversify its energy mix through further investment in renewables, and develop more resilient grid infrastructure.

The war in Ukraine has underscored the importance of energy security. A nation's dependence on a single source of energy, be it domestic or foreign, leaves it vulnerable to disruption, as others consider national security and fossil fuels in their own policies. For Ukraine, diversification and building a more resilient energy infrastructure are key takeaways from this crisis.

The international community also has a role to play. Supporting Ukraine's energy sector not only helps the nation weather the current crisis but also strengthens European energy security as a whole, where concerns over Europe's energy nightmare remain pronounced. A stable and independent Ukraine, less reliant on Russian energy, contributes to a more secure and prosperous Europe.

As the war in Ukraine continues, the battle for energy security rages on. While the immediate focus is on keeping the lights on through imports, the long-term goal for Ukraine is to rebuild a stronger, more resilient energy sector that can power the nation's future. The international community's support will be crucial in helping Ukraine achieve this goal.


Related News

View more

Solar farm the size of 313 football fields to be built at Edmonton airport

Airport City Solar Edmonton will deliver a 120-megawatt, 627-acre photovoltaic, utility-scale renewable energy project at EIA, creating jobs, attracting foreign investment, and supplying clean power to Fortis Alberta and airport distribution systems.


Key Points

A 120 MW, 627-acre photovoltaic solar farm at EIA supplying clean power to Fortis Alberta and airport systems.

✅ 120 MW utility-scale project over 627 acres at EIA

✅ Feeds Fortis Alberta and airport distribution networks

✅ Drives jobs, investment, and regional sustainability


A European-based company is proposing to build a solar farm bigger than 300 CFL football fields at Edmonton's international airport, aligning with Alberta's red-hot solar growth seen across the province.

Edmonton International Airport and Alpin Sun are working on an agreement that will see the company develop Airport City Solar, a 627-acre, 120-megawatt solar farm that reflects how renewable power developers combine resources for stronger projects on what is now a canola field on the west side of the airport lands.

The solar farm will be the largest at an airport anywhere in the world, EIA said in a news release Tuesday, in a region that also hosts the largest rooftop solar array at a local producer.

"It's a great opportunity to drive economic development as well as be better for the environment," Myron Keehn, vice-president, commercial development and air service at EIA, told CBC News, even as Alberta faces challenges with solar expansion that require careful planning.

"We're really excited that [Alpin Sun] has chosen Edmonton and the airport to do it. It's a great location. We've got lots of land, we're geographically located north, which is great for us, because it allows us to have great hours of sunlight.

"As everyone knows in Edmonton, you can golf early in the morning or golf late at night in the summertime here. And in wintertime it's great, because of the snow, and the reflective [sunlight] off the snow that creates power as well."

Airport official Myron Keehn says the field behind him will become home to the world's largest solar farm at an airport. (Scott Neufeld/CBC)

The project will "create jobs, provide sustainable solar power for our region and show our dedication to sustainability," Tom Ruth, EIA president and CEO, said in the news release, while complementing initiatives by Ermineskin First Nation to expand Indigenous participation in electricity generation.

Construction is expected to begin in early 2022, as new solar facilities in Alberta demonstrate lower costs than natural gas. The solar farm would be operational by the end of that year, the release said. 

Alpin Sun says the project will bring in $169 million in foreign investment to the Edmonton metro region amid federal green electricity contracts that are boosting market certainty. 

Power generated by Airport City Solar will feed into Fortis Alberta and airport distribution systems.


Related News

View more

UK low-carbon electricity generation stalls in 2019

UK low-carbon electricity 2019 saw stalled growth as renewables rose slightly, wind expanded, nuclear output fell, coal hit record lows, and net-zero targets demand faster deployment to cut CO2 intensity below 100gCO2/kWh.


Key Points

Low-carbon sources supplied 54% of UK power in 2019, up just 1TWh; wind grew, nuclear fell, and coal dropped to 2%.

✅ Wind up 8TWh; nuclear down 9TWh amid outages

✅ Fossil fuels 43% of generation; coal at 2%

✅ Net-zero needs 15TWh per year added to 2030


The amount of electricity generated by low-carbon sources in the UK stalled in 2019, Carbon Brief analysis shows.

Low-carbon electricity output from wind, solar, nuclear, hydro and biomass rose by just 1 terawatt hour (TWh, less than 1%) in 2019. It represents the smallest annual increase in a decade, where annual growth averaged 9TWh. This growth will need to double in the 2020s to meet UK climate targets while replacing old nuclear plants as they retire.

Some 54% of UK electricity generation in 2019 came from low-carbon sources, including 37% from renewables and 20% from wind alone, underscoring wind's leading role in the power mix during key periods. A record-low 43% was from fossil fuels, with 41% from gas and just 2% from coal, also a record low. In 2010, fossil fuels generated 75% of the total.

Carbon Brief’s analysis of UK electricity generation in 2019 is based on figures from BM Reports and the Department for Business, Energy and Industrial Strategy (BEIS). See the methodology at the end for more on how the analysis was conducted.

The numbers differ from those published earlier in January by National Grid, which were for electricity supplied in Great Britain only (England, Wales and Scotland, but excluding Northern Ireland), including via imports from other countries.

Low-carbon low
In 2019, the UK became the first major economy to target net-zero greenhouse gas emissions by 2050, increasing the ambition of its legally binding Climate Change Act.

To date, the country has cut its emissions by around two-fifths since 1990, with almost all of its recent progress coming from the electricity sector.

Emissions from electricity generation have fallen rapidly in the decade since 2010 as coal power has been almost phased out and even gas output has declined. Fossil fuels have been displaced by falling demand and by renewables, such as wind, solar and biomass.

But Carbon Brief’s annual analysis of UK electricity generation shows progress stalled in 2019, with the output from low-carbon sources barely increasing compared to a year earlier.

The chart below shows low-carbon generation in each year since 2010 (grey bars) and the estimated level in 2019 (red). The pale grey bars show the estimated future output of existing low-carbon sources after old nuclear plants retire and the pale red bars show the amount of new generation needed to keep electricity sector emissions to less than 100 grammes of CO2 per kilowatt hour (gCO2/kWh), the UK’s nominal target for the sector.

 Annual electricity generation in the UK by fuel, terawatt hours, 2010-2019. Top panel: fuel by fuel. Bottom panel: cumulative total generation from all sources. Source: BEIS energy trends, BM Reports and Carbon Brief analysis. Chart by Carbon Brief using Highcharts.
As the chart shows, the UK will require significantly more low-carbon electricity over the next decade as part of meeting its legally binding climate goals.

The nominal 100gCO2/kWh target for 2030 was set in the context of the UK’s less ambitious goal of cutting emissions to 80% below 1990 levels by 2050. Now that the country is aiming to cut emissions to net-zero by 2050, that 100gCO2/kWh indicator is likely to be the bare minimum.

Even so, it would require a rapid step up in the pace of low-carbon expansion, compared to the increases seen over the past decade. On average, low-carbon generation has risen by 9TWh each year in the decade since 2010 – including a rise of just 1TWh in 2019.

Given scheduled nuclear retirements and rising demand expected by the Committee on Climate Change (CCC) – with some electrification of transport and heating – low-carbon generation would need to increase by 15TWh each year until 2030, just to meet the benchmark of 100gCO2/kWh.

For context, the 3.2 gigawatt (GW) Hinkley C new nuclear plant being built in Somerset will generate around 25TWh once completed around 2026. The world’s largest offshore windfarm, the 1.2GW Hornsea One scheme off the Yorkshire coast, will generate around 5TWh each year.

The new Conservative government is targeting 40GW of offshore wind by 2030, up from today’s figure of around 8GW. If policies are put in place to meet this goal, then it could keep power sector emissions below 100gCO2/kWh, depending on the actual performance of the windfarms built.

However, new onshore wind and solar, further new nuclear or other low-carbon generation, such as gas with carbon capture and storage (CCS), is likely to be needed if demand is higher than expected, or if the 100gCO2/kWh benchmark is too weak in the context of net-zero by 2050.

The CCC says it is “likely” to “reflect the need for more rapid deployment” of low-carbon towards net-zero emissions in its advice on the sixth UK carbon budget for 2033-2037, due in September.

Trading places
Looking more closely at UK electricity generation in 2019, Carbon Brief’s analysis shows why there was so little growth for low-carbon sources compared to the previous year.

There was another increase for wind power in 2019 (up 8TWh, 14%), with record wind generation as several large new windfarms were completed including the 1.2GW Hornsea One project in October and the 0.6GW Beatrice offshore windfarm in Q2 of 2019. But this was offset by a decline for nuclear (down 9TWh, 14%), due to ongoing outages for reactors at Hunterston in Scotland and Dungeness in Kent.

(Analysis of data held by trade organisation RenewableUK suggests some 0.6GW of onshore wind capacity also started operating in 2019, including the 0.2GW Dorenell scheme in Moray, Scotland.)

As a result of these movements, the UK’s windfarms overtook nuclear for the first time ever in 2019, becoming the country’s second-largest source of electricity generation, and earlier, wind and solar together surpassed nuclear in the UK as momentum built. This is shown in the figure below, with wind (green line, top panel) trading places with nuclear (purple) and gas (dark blue) down around 25% since 2010 but remaining the single-largest source.

 Annual electricity generation in the UK by fuel, terawatt hours, 2010-2019. Top panel: fuel by fuel. Bottom panel: cumulative total generation from all sources. Source: BEIS energy trends, BM Reports and Carbon Brief analysis. Chart by Carbon Brief using Highcharts.
The UK’s currently suspended nuclear plants are due to return to service in January and March, according to operator EDF, the French state-backed utility firm. However, as noted above, most of the UK’s nuclear fleet is set to retire during the 2020s, with only Sizewell B in Suffolk due to still be operating by 2030. Hunterston is scheduled to retire by 2023 and Dungeness by 2028.

Set against these losses, the UK has a pipeline of offshore windfarms, secured via “contracts for difference” with the government, at a series of auctions. The most recent auction, in September 2019, saw prices below £40 per megawatt hour – similar to current wholesale electricity prices.

However, the capacity contracted so far is not sufficient to meet the government’s target of 40GW by 2030, meaning further auctions – or some other policy mechanism – will be required.

Coal zero
As well as the switch between wind and nuclear, 2019 also saw coal fall below solar for the first time across a full year, echoing the 2016 moment when wind outgenerated coal across the UK, after it suffered another 60% reduction in electricity output. Just six coal plants remain in the UK, with Aberthaw B in Wales and Fiddlers Ferry in Cheshire closing in March.

Coal accounted for just 2% of UK generation in 2019, a record-low coal share since centralised electricity supplies started to operate in 1882. The fuel met 40% of UK needs as recently as 2012, but has plummeted thanks to falling demand, rising renewables, cheaper gas and higher CO2 prices.

The reduction in average coal generation hides the fact that the fuel is now often not required at all to meet the UK’s electricity needs. The chart below shows the number of days each year when coal output was zero in 2019 (red line) and the two previous years (blue).

 Cumulative number of days when UK electricity generation from renewable sources has been higher than that from fossil fuels. Source: BEIS energy trends, BM Reports and Carbon Brief analysis. Chart by Carbon Brief using Highcharts.
The 83 days in 2019 with zero coal generation amount to nearly a quarter of the year and include the record-breaking 18-day stretch without the fuel.

Great Britain has been running for a record TWO WEEKS without using coal to generate electricity – the first time this has happened since 1882.

The country’s grid has been coal-free for 45% of hours in 2019 so far.https://www.carbonbrief.org/countdown-to-2025-tracking-the-uk-coal-phase-out …

Coal generation was set for significant reductions around the world in 2019 – including a 20% reduction for the EU as a whole – according to analysis published by Carbon Brief in November.

Notably, overall UK electricity generation fell by another 9TWh in 2019 (3%), bringing the total decline to 58TWh since 2010. This is equivalent to more than twice the output from the Hinkley C scheme being built in Somerset. As Carbon Brief explained last year, falling demand has had a similar impact on electricity-sector CO2 emissions as the increase in output from renewables.

This is illustrated by the fact that the 9TWh reduction in overall generation translated into a 9TWh (6%) cut in fossil-fuel generation during 2019, with coal falling by 10TWh and gas rising marginally.

Increasingly renewable
As fossil-fuel output and overall generation have declined, the UK’s renewable sources of electricity have continued to increase. Their output has risen nearly five-fold in the past decade and their share of the UK total has increased from 7% in 2010 to 37% in 2019.

As a result, the UK’s increasingly renewable grid is seeing more minutes, hours and days during which the likes of wind, solar and biomass collectively outpace all fossil fuels put together, and on some days wind is the main source as well.

The chart below shows the number of days during each year when renewables generated more electricity than fossil fuels in 2019 (red line) and each of the previous four years (blue lines). In total, nearly two-fifths of days in 2019 crossed this threshold.

 Cumulative number of days when the UK has not generated any electricity from coal. Source: BEIS energy trends, BM Reports and Carbon Brief analysis. Chart by Carbon Brief using Highcharts.
There were also four months in 2019 when renewables generated more of the UK’s electricity than fossil fuels: March, August, September and December. The first ever such month came in September 2018 and more are certain to follow.

National Grid, which manages Great Britain’s high-voltage electricity transmission network, is aiming to be able to run the system without fossil fuels by 2025, at least for short periods. At present, it sometimes has to ask windfarm operators to switch off and gas plants to start running in order to keep the electricity grid stable.

Note that biomass accounted for 11% of UK electricity generation in 2019, nearly a third of the total from all renewables. Some two-thirds of the biomass output is from “plant biomass”, primarily wood pellets burnt at Lynemouth in Northumberland and the Drax plant in Yorkshire. The remainder was from an array of smaller sites based on landfill gas, sewage gas or anaerobic digestion.

The CCC says the UK should “move away” from large-scale biomass power plants, once existing subsidy contracts for Drax and Lynemouth expire in 2027.

Using biomass to generate electricity is not zero-carbon and in some circumstances could lead to higher emissions than from fossil fuels. Moreover, there are more valuable uses for the world’s limited supply of biomass feedstock, the CCC says, including carbon sequestration and hard-to-abate sectors with few alternatives.

Methodology
The figures in the article are from Carbon Brief analysis of data from BEIS Energy Trends chapter 5 and chapter 6, as well as from BM Reports. The figures from BM Reports are for electricity supplied to the grid in Great Britain only and are adjusted to include Northern Ireland.

In Carbon Brief’s analysis, the BM Reports numbers are also adjusted to account for electricity used by power plants on site and for generation by plants not connected to the high-voltage national grid. This includes many onshore windfarms, as well as industrial gas combined heat and power plants and those burning landfill gas, waste or sewage gas.

By design, the Carbon Brief analysis is intended to align as closely as possible to the official government figures on electricity generated in the UK, reported in BEIS Energy Trends table 5.1.

Briefly, the raw data for each fuel is in most cases adjusted with a multiplier, derived from the ratio between the reported BEIS numbers and unadjusted figures for previous quarters.

Carbon Brief’s method of analysis has been verified against published BEIS figures using “hindcasting”. This shows the estimates for total electricity generation from fossil fuels or renewables to have been within ±3% of the BEIS number in each quarter since Q4 2017. (Data before then is not sufficient to carry out the Carbon Brief analysis.)

For example, in the second quarter of 2019, a Carbon Brief hindcast estimates gas generation at 33.1TWh, whereas the published BEIS figure was 34.0TWh. Similarly, it produces an estimate of 27.4TWh for renewables, against a BEIS figure of 27.1TWh.

National Grid recently shared its own analysis for electricity in Great Britain during 2019 via its energy dashboard, which differs from Carbon Brief’s figures.


Related News

View more

N.W.T. green energy advocate urges using more electricity for heat

Taltson Hydro Electric Heating directs surplus hydro power in the South Slave to space heat via discounted rates, displacing diesel and cutting greenhouse gas emissions, with rebates, separate metering, and backup systems shaping adoption.


Key Points

An initiative using Taltson's surplus hydro to heat buildings, discount rates replace diesel and cut emissions.

✅ 6.3 cents/kWh heating rate needs separate metering, backup heat

✅ 4-6 MW surplus hydro; outages require diesel; rebates available

✅ Program may be curtailed if new mines or mills demand power


A Northwest Territories green energy advocate says there's an obvious way to expand demand for electricity in the territory's South Slave region without relying on new mining developments — direct it toward heating.

One of the reasons the N.W.T. has always had some of the highest electricity rates in Canada is that a small number of people have to shoulder the huge costs of hydro facilities and power plants.

But some observers point out that residents consume as much energy for heat as they do for conventional uses of electricity, such as lighting and powering appliances. Right now almost all of that heat is generated by expensive oil imported from the United States.

The Northwest Territories Power Corporation says the 18-megawatt Taltson hydro system that serves the South Slave typically has four to six megawatts of excess generating capacity, even as record demand in Yukon is reported. It says using some of that to generate heat is a government priority.

But renewable energy advocate and former N.W.T. MP Dennis Bevington, who lives in the South Slave and heats his home using electricity, says the government is not making it easy for people to tap into that surplus to heat their homes and businesses, a debate that some say would benefit from independent planning at the national level.

Discount rate for heating, but there are catches
The power corporation offers hydro electricity from Taltson to use for heating at a much lower price than it charges for electricity generally. The discounted rate is not available to residential customers.

According to the corporation, consumers pay only 6.3 cents per kilowatt hour compared to the regular rate of just under 24 cents, while Manitoba Hydro financial pressures highlight the risks of expanding demand without new generation.

But to distinguish between the two, users are required to cover the cost of installing a separate power meter. Bevington, who developed the N.W.T.'s first energy strategy, says that is an unnecessary expense.

Taltson expansion key to reducing N.W.T.'s greenhouse gas emissions, says gov't
"The billing is how you control that," he said. "You establish an average electrical use in the winter months. That could be the base rate. Then, if you use power in the winter months above that, you get the discount."

Users are also required to have a back-up heating system. Taltson hydro power offers heating on the understanding that when the hydro system is down — such as during power outages or annual summer maintenance of the hydro system — electricity is not available for heating.
The president and CEO of the power corporation says there's a good reason for that. "The diesels are more expensive to run and they're actually greenhouse gas emitting," said Noel Voykin. "The whole idea of this [electric heat] program is to provide clean energy that is not otherwise being used."

According to the corporation, there have been huge savings for the few who have tapped into the hydro system to heat their buildings, and across Canada utilities are exploring novel generation such as NB Power's Belledune seawater project to diversify supply.

It's being used to heat Aurora College's Breynat Hall, and Joseph B. Tyrrell Elementary School and the transportation department garage in Fort Smith, N.W.T. Electricity is also used to heat the Jackfish power plant in the North Slave region.

The corporation says that during a four-year period, this saved more than 600,000 litres of diesel fuel and reduced greenhouse gas emissions by about 1,700 tonnes.

Bevington says the most obvious place to expand the use of electrical heat is to government housing.

"We have a hundred public housing units in Fort Smith," he said. "The government is putting diesel into those units [for heating] and they could be putting in their own electricity."

Heating a tiny part of energy market
The corporation says it sells only about 2.5 megawatts of electricity for heating each year, which is less than four per cent of the power it sells in the region. It says with some upgrades, another two megawatts of electricity could be made available for electrical heat.

Bevington says the corporation could do more to market electricity for heating. Voykin said that's the government's job. There are three programs that offer rebates to residents and businesses converting to electric heating.

If you build it, will they come? N.W.T. gov't hopes hydro expansion will attract investment
There are better options than billion dollar Taltson expansion, say energy leaders
There may be a reason why the government and the corporation are not more aggressively promoting using surplus electricity in the Taltson system for heating, as large hydro ambitions have reopened old wounds in places like Quebec and Newfoundland and Labrador during recent debates.

It is anticipating that new industrial customers may require that excess capacity in the coming years, and experiences elsewhere show that accommodating new energy-intensive customers can be challenging for utilities. Voykin said those potential new customers include a proposed mine at Pine Point and a pellet mill in Enterprise, N.W.T., even as biomass use faces environmental pushback in some regions.

The corporation says any surplus power in the system will be sold at standard rates to any new industrial customers instead of at discount rates for heating. If that requires cutting back on the heating program, it will be cut back.


Related News

View more

Sign Up for Electricity Forum’s Newsletter

Stay informed with our FREE Newsletter — get the latest news, breakthrough technologies, and expert insights, delivered straight to your inbox.

Electricity Today T&D Magazine Subscribe for FREE

Stay informed with the latest T&D policies and technologies.
  • Timely insights from industry experts
  • Practical solutions T&D engineers
  • Free access to every issue

Live Online & In-person Group Training

Advantages To Instructor-Led Training – Instructor-Led Course, Customized Training, Multiple Locations, Economical, CEU Credits, Course Discounts.

Request For Quotation

Whether you would prefer Live Online or In-Person instruction, our electrical training courses can be tailored to meet your company's specific requirements and delivered to your employees in one location or at various locations.