China tops in new wind energy

By Investor's Business Daily


Protective Relay Training - Basic

Our customized live online or in‑person group training can be delivered to your staff at your location.

  • Live Online
  • 12 hours Instructor-led
  • Group Training Available
Regular Price:
$699
Coupon Price:
$599
Reserve Your Seat Today
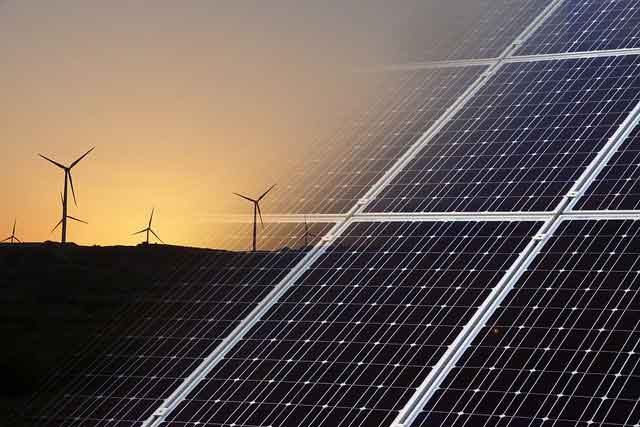
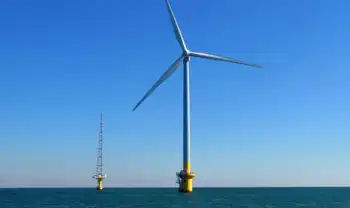
China overtook the U.S. at adding the most wind energy capacity annually, by building 13.8 gigawatts of capacity in 2009 vs. 10 GW here, according to the U.S. Department of Energy.

Still, the 10 GW the U.S. added last year represented a 40 increase from 2008's new capacity. The U.S. has the most total wind energy capacity in the world with 35.2 GW vs. No. 2 China with 25.8 GW.

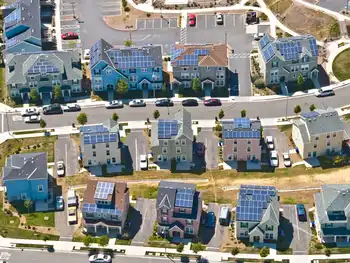
The U.S. solar power industry added just 481 megawatts of capacity last year.

Related News

Electricity bills on the rise in Calgary after

Calgary Electricity Price Increase signals higher ENMAX bills as grid demand surges; wholesale market volatility, fixed vs floating rates, kWh costs, and transmission charges drive above-average pricing across Alberta this winter.


Key Points

A market-led rise in Calgary power rates as grid demand and wholesale volatility affect fixed and floating plans.

✅ ENMAX warns of higher winter prices amid record grid demand

✅ Fixed rates hedge wholesale volatility; floating tracks spot market

✅ Transmission and distribution fees rise 5-10 percent annually


Calgarians should expect to be charged more for their electricity bills amid significant demand on the grid and a transition to above-average rates across Alberta.

ENMAX, one of the most-used electricity providers in the city, has sent an email to customers notifying them of higher prices for the rest of the winter months.

“Although fluctuations in electricity market prices are normal, we have seen a general trend of increasing rates over time,” the email to customers read.

“The price volatility we are forecasting is due to market factors beyond a single energy provider, including but not limited to expectations for a colder-than-normal winter and changes in electricity supply and demand in Alberta’s wholesale market. ”

Earlier this month, the province set a record for electricity usage during a bitterly cold stretch of weather.

According to energy comparison website energyrates.ca, Alberta’s energy prices have increased by 34 per cent between November 2020 and 2021.

“One of the reasons that this increase seems so significant is we’re actually coming off of a low period in the market,” the site’s founder Joel MacDonald told Global News. “You’re seeing rates well below average transitioning to well above average.”

According to ENMAX’s rate in January, the price of electricity currently sits at 15.9 cents per kilowatt-hour, with an electricity price spike from 7.9 cents per kilowatt-hour last year.

MacDonald said prices for electricity have been relatively low since 2018 but a swing in the price of oil has created more activity in the province’s industrial sector, and in turn more demand on the power grid.

According to MacDonald, the price increase can also be attributed to the removal of a consumer price cap that limited regulated rates to 6.8 cents per kilowatt-hour for households and small businesses with lower demand, which, after the carbon tax was repealed, initially remained in place.

Although the cap was scrapped by the UCP three years ago, he said energy bills now depend on the rate set by the market.

“What’s increased now recently is actually the price per kilowatt, and the (transmission and distribution) charges have only increased, but annually they increase between five and 10 per cent,” MacDonald said. “So the portion of your bill that’s increasing is different than what Albertans are typically used to, or at least in recent memory.”

But Albertans do have options, MacDonald said.

As part of its email to customers, ENMAX sent a list of energy saving tips to reduce energy consumption in people’s homes, including using cold water for laundry and avoiding dryer use, energy-efficient lightbulbs and unplugging electronics when they are not in use.

Retailers also offer contracts with floating or fixed rates for consumers.

“Fixed rates, obviously, you’re going to pick your price. It’s going to be the same each and every single month,” MacDonald said. “Floating rate is based off the wholesale spot market, and that has been exceptionally high the last few months.”

He said consumers looking to save money when electricity prices are high should look into a fixed rate.


Related News

View more

Cyprus can’t delay joining the electricity highway

Cyprus Electricity Interconnectors link the island to the EU grid via EuroAsia and EuroAfrica projects, enabling renewable energy trade, subsea transmission, market liberalization, and stronger energy security and diplomacy across the region.


Key Points

Subsea links connecting Cyprus to Greece, Israel and Egypt for EU grid integration, renewable trade and energy security.

✅ Connects EU, Israel, Egypt via EuroAsia and EuroAfrica

✅ Enables renewables integration and market liberalization

✅ Strengthens energy security, investment, and diplomacy


Electricity interconnectors bridging Cyprus with the broader geographical region, mirroring projects like the Ireland-France grid link already underway in Europe, are crucial for its diplomacy while improving its game to become a clean energy hub.

In an interview with Phileleftheros daily, Andreas Poullikkas, chairman of the Cyprus Energy Regulatory Authority (CERA), said electricity cables such as the EuroAsia Interconnector and the EuroAfrica Interconnector, could turn the island into an energy hub, creating investment opportunities.

“Cyprus, with proper planning, can make the most of its energy potential, turning Cyprus into an electricity producer-state and hub by establishing electrical interconnections, such as the EuroAsia Interconnector and the EuroAfrica Interconnector,” said Poullikkas.

He said these electricity interconnectors, “will enable the island to become a hub for electricity transmission between the European Union, Israel and Egypt, with developments such as the Israel Electric Corporation settlement highlighting regional dynamics, while increasing our energy security”.

Poullikkas argued it will have beneficial consequences in shaping healthy conditions for liberalising the country’s electricity market and economy, facilitating the production of electricity with Renewable Energy Sources and supporting broader efforts like the UK grid transformation toward net zero.

“Electricity interconnections are an excellent opportunity for greater business flexibility in Cyprus, ushering new investment opportunities, as seen with the Lake Erie Connector investment across North America, either in electricity generation or other sectors. Especially at a time when any investment or financial opportunity is welcomed.”

He said Cyprus’ energy resources are a combination of hydrocarbon deposits and renewable energy sources, such as solar.

This combination offers the country a comparative advantage in the energy sector.

Cyprus can take advantage of the development of alternative supply routes of the EU, as more links such as new UK interconnectors come online.

Poullikkas argued that as energy networks are developing rapidly throughout the bloc, serving the ever-increasing needs for electricity, and aligning with the global energy interconnection vision highlighted in recent assessments, the need to connect Cyprus with its wider geographical area is a matter of urgency.

He argues the development of important energy infrastructure, especially electricity interconnections, is an important catalyst in the implementation of Cyprus goals, while recognising how rule changes like Australia's big battery market shift can affect storage strategies.

“It should also be a national political priority, as this will help strengthen diplomatic relations,” added Poullikkas.

Implementing the electricity interconnectors between Israel, Cyprus and Greece through Crete and Attica (EuroAsia Interconnector) has been delayed by two years.

He said the delay was brought about after Greece decided to separate the Crete-Attica section of the interconnection and treat as a national project.

Poullikkas stressed the Greek authorities are committed to ensuring the connection of Cyprus with the electricity market of the EU.

“All the required permits have been obtained from the competent authorities in Cyprus and upon the completion of the procedures with the preferred manufacturers, construction of the Cyprus-Crete electrical interconnection will begin before the end of this year. Based on current data, the entire interconnection is expected to be implemented in 2023”.

“The EuroAfrica Interconnector is in the pre-works stage, all project implementation studies have already been completed and submitted to the competent authorities, including cost and benefit studies”.

EuroAsia Interconnector is a leading EU project of common interest (PCI), also labelled as an “electricity highway” by the European Commission.

It connects the national grids of Israel, Cyprus and Greece, creating a reliable energy bridge between the continents of Asia and Europe allowing bi-directional transmission of electricity.

The cost of the entire subsea cable system, at 1,208km, the longest in the world and the deepest at 3,000m below sea level, is estimated at €2.5 bln.

Construction costs for the first phase of the Egypt-Cyprus interconnection (EuroAfrica) with a Stage 1 transmission capacity of 1,000MW is estimated at €1bln.

The Cyprus-Greece (Crete) interconnection, as well as the Egypt-Cyprus electricity interconnector, will both be commissioned by December 2023.


Related News

View more

UK Anticipates a 16% Decrease in Energy Bills in April

UK Energy Price Cap Cut 2024 signals relief as wholesale gas prices fall; Ofgem price cap drops per Cornwall Insight, aided by LNG supply, mild winter, despite Red Sea tensions and Ukraine conflict impacts.


Key Points

A forecast cut to Great Britain's Ofgem price cap as wholesale gas falls, easing typical annual household bills in 2024.

✅ Cap falls from £1,928 to £1,620 in April 2024

✅ Forecast £1,497 in July, then about £1,541 from October

✅ Drivers: lower wholesale gas, LNG supply, mild winter


Households in Great Britain are set to experience a significant reduction in energy costs this spring, with bills projected to drop by over £300 annually. This decrease is primarily due to a decline in wholesale gas prices, offering some respite to those grappling with the cost of living crisis.

Cornwall Insight, a well-regarded industry analyst, predicts a 16% reduction in average bills from the previous quarter, potentially reaching the lowest levels since the onset of the Ukraine conflict.

The industry’s price cap, indicative of the average annual bill for a typical household, is expected to decrease from the current £1,928, set earlier this month, to £1,620 in April – a reduction of £308 and £40 less than previously forecasted in December, as ministers consider ending the gas-electricity price link to improve market resilience.

Concerns about escalating tensions in the Red Sea, where Houthi rebels have disrupted global shipping, initially led analysts to fear an increase in wholesale oil prices and subsequent impact on household energy costs.

Contrary to these concerns, oil prices have remained relatively stable, and European gas reserves have been higher than anticipated during a mild winter, with European gas prices returning to pre-Ukraine war levels since November.

Cornwall Insight anticipates that energy prices will continue to be comparatively low through 2024. They predict a further decline to £1,497 for a typical annual bill from July, followed by a slight increase to £1,541 starting in October.

This forecast is a welcome development for Britons who have been dealing with increased expenses across various sectors, from food to utilities, amidst persistently high inflation rates, with energy-driven EU inflation hitting lower-income households hardest across member states.

Energy bills saw a steep rise in 2021, which escalated further due to the Ukraine conflict in 2022, driving up wholesale gas prices. This surge prompted government intervention to subsidize bills, with the UK price cap estimated to cost around £89bn to the public purse, capping costs to a typical household at £2,500.

Cornwall Insight noted that the supply of liquified natural gas to Europe had not been as adversely affected by the Red Sea disruptions as initially feared. Moreover, the UK has been well-supplied with gas from the US, which has become a more significant supplier since the Ukraine war, even as US electricity prices have risen to multi-decade highs. Contributing factors also include lower gas prices in Asia, mild weather, and robust gas availability.

Craig Lowrey, a principal consultant at Cornwall Insight, remarked that concerns about Red Sea events driving up energy prices have not materialized, allowing households to expect a reduction in prices.

On Monday, the next-month wholesale gas price dropped by 4% to 65p a therm.

However, Lowrey cautioned that a complete return to pre-crisis energy bill levels remains unlikely due to ongoing market impacts from shifting away from Russian energy sources and persistent geopolitical tensions, as well as policy changes such as Britain’s Energy Security Bill shaping market reforms.

Richard Neudegg, director of regulation at Uswitch, welcomed the potential further reduction of the price cap in April. However, he pointed out that this offers little solace to households currently struggling with high winter energy costs during the winter. Neudegg urged Ofgem, the energy regulator, to prompt suppliers to reintroduce more competitive and affordable fixed-price deals.


Related News

View more

Potent greenhouse gas declines in the US, confirming success of control efforts

US SF6 Emissions Decline as NOAA analysis and EPA mitigation show progress, with atmospheric measurements and Greenhouse Gas Reporting verifying reductions from the electric power grid; sulfur hexafluoride's extreme global warming potential underscores inventory improvements.


Key Points

A documented drop in US sulfur hexafluoride emissions, confirmed by NOAA atmospheric data and EPA reporting reforms.

✅ NOAA towers and aircraft show 2007-2018 decline

✅ EPA reporting and utility mitigation narrowed inventory gaps

✅ Winter leaks and servicing signal further reduction options


A new NOAA analysis shows U.S. emissions of the super-potent greenhouse gas sulfur hexafluoride (SF6) have declined between 2007-2018, likely due to successful mitigation efforts by the Environmental Protection Agency (EPA) and the electric power industry, with attention to SF6 in the power industry across global markets. 

At the same time, significant disparities that existed previously between NOAA’s estimates, which are based on atmospheric measurements, and EPA’s estimates, which are based on a combination of reported emissions and industrial activity, have narrowed following the establishment of the EPA's Greenhouse Gas Reporting Program. The findings, published in the journal Atmospheric Chemistry and Physics, also suggest how additional emissions reductions might be achieved. 

SF6 is most commonly used as an electrical insulator in high-voltage equipment that transmits and distributes electricity, and its emissions have been increasing worldwide as electric power systems expand, even as regions hit milestones like California clean energy surpluses in recent years. Smaller amounts of SF6 are used in semiconductor manufacturing and in magnesium production. 

SF6 traps 25,000 times more heat than carbon dioxide over a 100-year time scale for equal amounts of emissions, and while CO2 emissions flatlined in 2019 globally, that comparison underscores the potency of SF6. That means a relatively small amount of the gas can have a significant impact on climate warming. Because of its extremely large global warming potential and long atmospheric lifetime, SF6 emissions will influence Earth’s climate for thousands of years.

In this study, researchers from NOAA’s Global Monitoring Laboratory, as record greenhouse gas concentrations drive demand for better data, working with colleagues at EPA, CIRES, and the University of Maryland, estimated U.S. SF6 emissions for the first time from atmospheric measurements collected at a network of tall towers and aircraft in NOAA’s Global Greenhouse Gas Reference Network. The researchers provided an estimate of SF6 emissions independent from the EPA’s estimate, which is based on reported SF6 emissions for some industrial facilities and on estimated SF6 emissions for others.

“We observed differences between our atmospheric estimates and the EPA’s activity-based estimates,” said study lead author Lei Hu, a Global Monitoring Laboratory researcher who was a CIRES scientist at the time of the study. “But by closely collaborating with the EPA, we were able to identify processes potentially responsible for a significant portion of this difference, highlighting ways to improve emission inventories and suggesting additional emission mitigation opportunities, such as forthcoming EPA carbon capture rules for power plants, in the future.” 

In the 1990s, the EPA launched voluntary partnerships with the electric power, where power-sector carbon emissions are falling as generation shifts, magnesium, and semiconductor industries to reduce SF6 emissions after the United States recognized that its emissions were significant. In 2011, large SF6 -emitting facilities were required to begin tracking and reporting their emissions under the EPA Greenhouse Gas Reporting Program. 

Hu and her colleagues documented a decline of about 60 percent in U.S. SF6 emissions between 2007-2018, amid global declines in coal-fired power in some years—equivalent to a reduction of between 6 and 20 million metric tons of CO2 emissions during that time period—likely due in part to the voluntary emission reduction partnerships and the EPA reporting requirement. A more modest declining trend has also been reported in the EPA’s national inventories submitted annually under the United Nations Framework Convention on Climate Change. 

Examining the differences between the NOAA and EPA independent estimates, the researchers found that the EPA’s past inventory analyses likely underestimated SF6 emissions from electrical power transmission and distribution facilities, and from a single SF6 production plant in Illinois. According to Hu, the research collaboration has likely improved the accuracy of the EPA inventories. The 2023 draft of the EPA’s U.S. Greenhouse Gas Emissions and Sinks: 1990-2021 used the results of this study to support revisions to its estimates of SF6 emissions from electrical transmission and distribution. 

The collaboration may also lead to improvements in the atmosphere-based estimates, helping NOAA identify how to expand or rework its network to better capture emitting industries or areas with significant emissions, according to Steve Montzka, senior scientist at GML and one of the paper’s authors.

Hu and her colleagues also found a seasonal variation in SF6 emissions from the atmosphere-based analysis, with higher emissions in winter than in summer. Industry representatives identified increased servicing of electrical power equipment in the southern states and leakage from aging brittle sealing materials in the equipment in northern states during winter as likely explanations for the enhanced wintertime emissions—findings that suggest opportunities for further emissions reductions.

“This is a great example of the future of greenhouse gas emission tracking, where inventory compilers and atmospheric scientists work together to better understand emissions and shed light on ways to further reduce them,” said Montzka.


Related News

View more

Can California Manage its Solar Boom?

California Duck Curve highlights midday solar oversupply and steep evening peak demand, stressing grid stability. Solutions include battery storage, demand response, diverse renewables like wind, geothermal, nuclear, and regional integration to reduce curtailment.


Key Points

A mismatch between midday solar surplus and evening demand spikes, straining the grid without storage and flexibility.

✅ Midday solar oversupply forces curtailment and wasted clean energy.

✅ Evening ramps require fast, fossil peaker plants to stabilize load.

✅ Batteries, demand response, regional trading flatten the curve.


California's remarkable success in adopting solar power, including a near-100% renewable milestone, has created a unique challenge: managing the infamous "duck curve." This distinctive curve illustrates a growing mismatch between solar electricity generation and the state's energy demands, creating potential problems for grid stability and ultimately threatening to slow California's progress in the fight against climate change.


The Shape of the Problem

The duck curve arises from a combination of high solar energy production during midday hours and surging energy demand in the late afternoon and evening when solar power declines. During peak solar hours, the grid often has an overabundance of electricity, and curtailments are increasing as a result, while as the sun sets, demand surges when people return home and businesses ramp up operations. California's energy grid operators must scramble to make up this difference, often relying on fast-acting but less environmentally friendly power sources.


The Consequences of the Duck Curve

The increasing severity of the duck curve has several potential consequences for California:

  • Grid Strain: The rapid ramp-up of power sources to meet evening demand puts significant strain on the electrical grid. This can lead to higher operational costs and potentially increase the risk of blackouts during peak demand times.
  • Curtailed Energy: To avoid overloading the grid, operators may sometimes have to curtail excess solar energy during midday, as rising curtailment reports indicate, essentially wasting clean electricity that could have been used to displace fossil fuel generation.
  • Obstacle to More Solar: The duck curve can make it harder to add new solar capacity, as seen in Alberta's solar expansion challenges, for fear of further destabilizing the grid and increasing the need for fossil fuel-based peaking plants.


Addressing the Challenge

California is actively seeking solutions to mitigate the duck curve, aligning with national decarbonization pathways that emphasize practicality. Potential strategies include:

  • Energy Storage: Deploying large-scale battery storage can help soak up excess solar electricity during the day and release it later when demand peaks, smoothing out the duck curve.
  • Demand Flexibility: Encouraging consumers to shift their energy use to off-peak hours through incentives and smart grid technologies can help reduce late-afternoon surges in demand.
  • Diverse Power Sources: While solar is crucial, a balanced mix of energy sources, including geothermal, wind, and nuclear, can improve grid stability and reduce reliance on rapid-response fossil fuel plants.
  • Regional Cooperation: Integrating California's grid with neighboring states can aid in balancing energy supply and demand across a wider geographical area.


The Ongoing Solar Debate

The duck curve has become a central point of debate about the future of California's energy landscape. While acknowledging the challenge, solar advocates argue for continued expansion, backed by measures like a bill to require solar on new buildings, emphasizing the urgent need to transition away from fossil fuels. Grid operators and some utility companies call for a more cautious approach, emphasizing grid reliability and potential costs if the problem isn't effectively managed.


Balancing California's Needs and its Green Ambitions

Finding the right path forward is essential; it will determine whether California can continue to lead the way in solar energy adoption while ensuring a reliable and affordable electricity supply. Successfully navigating the duck curve will require innovation, collaboration, and a strong commitment to building a sustainable energy system, as wildfire smoke impacts on solar continue to challenge generation predictability.


Related News

View more

The crisis in numbers: How COVID-19 has reshaped Saskatchewan

Saskatchewan COVID-19 economic impact: real-time data shows drops in electricity demand, oil well licensing, traffic and tickets, plus spikes in internet usage, government site visits, remote work, and alcohol wholesale volumes.


Key Points

COVID-19 reduced energy use, drilling and traffic, while pushing activity online; jobs, rents and sales show strain.

✅ Electricity demand down 6.7%; residential usage up

✅ Oil well license applications fell 15-fold in April

✅ Internet traffic up 16%-46%; wireless LTE up 34%


We’re only just beginning to grasp how COVID-19 has upended Saskatchewan’s economy, its government and all of our lives.

The numbers that usually make headlines — job losses, economic contraction, bankruptcies — are still well behind the pace of the virus and its toll.

But other numbers change more quickly. Saskatchewan people are using less power, and the power industry is adopting on-site staffing plans to ensure reliability as conditions evolve. We’re racking up fewer speeding tickets. And as new restrictions come, we’re clicking onto Saskatchewan.ca as much as 10,000 times per minute.

Here’s some data that provides a first glimpse into how much our province has changed in just six weeks.

Electricity use tends to rise and fall in tandem with the health of the economy, and the most recent data from SaskPower suggests businesses are powering down, while regional utilities such as Manitoba Hydro seek unpaid days off to trim costs.

Peak load requirements between March 15 and April 26 were 220 MW lower than during the same period in 2019, and elsewhere BC Hydro is posting COVID-19 updates at Site C as it manages project impacts. That’s a decrease of 6.7 per cent, with total load on April 29 at 2,551 MW. A megawatt is enough electricity to power about 1,000 homes.

Separate from pandemic impacts, an external investigation at Manitoba Hydro has drawn attention to workplace conduct issues.

But it’s not homes that are turning off the lights. SaskPower spokesman Joel Cherry said commercial and industrial usage is down, while residential demand is up, with household electricity bills rising as more people stay home.

The timing of power demand has also shifted, a pattern seen as residential electricity use rises during work-from-home routines. Peak load would usually come around 8 or 9 p.m. in April. Now it’s coming earlier, typically between 5 and 6 p.m.

Oil well applications fall 15-fold
Oil prices have cratered since late February, and producers in Saskatchewan have reacted by pulling back on drilling plans, while neighbouring Alberta provides transition support for coal workers amid broader energy shifts.

Applications for well licences fell from 242 in January to 203 in February (including nine potash and one helium operations), before dropping to 84 in March. April, the month benchmark oil prices went negative for one day, producers submitted just 15 applications.

That’s 15 times fewer than the 231 applications the Ministry of Energy and Resources received in April 2019.

Well licences are needed for drilling, operating, injecting, producing or exploring an oil and gas or potash well in the province.

There has been no clear trend in well abandonment, however. There were 176 applications for abandonment in March and 155 in April, roughly in line with figures from the year before.

SGI spokesman Tyler McMurchy believes the lower numbers might stem from a combination of lower traffic volumes during part of the month, possibly combined with a shift in police priorities. The March 2020 numbers are also well below January and February figures.

Indeed, the Ministry of Highways and infrastructure reported a 16 per cent decrease in average daily traffic last month compared to March 2019, through its traffic counts at 11 different spots on highways across the province.

In Regina, traffic counts at 16 locations dropped from a high of 2.1 million in the first week of March to a low of 1.3 million during the week of March 22. That’s a 44 per cent decrease.

Counts have gradually recovered to 1.6 million in the weeks since. The data was fairly consistent at all 16 spots, which are largely major intersections, though the city cautioned they may not be representative of Regina as a whole.

Tickets for cellphone use while driving also fell, dropping from 562 in February to 314 in March. McMurchy noted that distracted driving numbers in general have been falling since November as stiffer penalties were announced. Impaired driving tickets were up, by contrast, but still within a typical range.

Internet traffic shoots up 16 per cent, far more for rural high speed
You may be spending a lot more time on Netflix and Facebook in the age of social distancing, and SaskTel has noticed.

From late February to late April, SaskTel has seen “very significant increases in provincial data traffic.” DSL and fibre optic networks have handled a 16 per cent increase in traffic, while demand on the wireless LTE network is up 34 per cent.

Usage on the Fusion network up 46 per cent. That network serves rural areas that don’t have access to other high-speed options.

The specific reference dates for comparison were February 24 and April 27.

“We attribute these changes in data usage to the pandemic and not expected seasonal or yearly shifts in usage patterns,” said spokesman Greg Jacobs.

Saskatchewan.ca was attracting just 70 page views per minute on average in February. But page views jumped over 10,000 per minute at 2:38 p.m. on March 18, as Moe was still announcing the new measures.

That’s a 14,000 per cent increase.

For all of March, visitor sessions on the site clocked in at 3,905,061, almost four times the 944,904 recorded for February.

Bureaucracy has increasingly migrated to cyberspace, with 62 per cent of civil servants now working from home. Government Skype calls, both audio and video, have tripled from 12,000 sessions per day to 35,000.Telephone conference calls increased by a factor of 14 from the first week of February to the second full week of April, with 25 times more weekly call participants. 

The Ministry of Central Services reported a 17 per cent jump in emails received by government over the past two months, excluding the Ministry of Health.

But as civil servants spend more time on their computers, the government’s fleet is spending a lot less time on the road. The ministry has purchased 40 per cent fewer litres of fuel for its vehicles over the past four weeks, compared to the same time last year.

Alcohol wholesale volumes up 22 per cent, then fall back to normal
Retailers bought more alcohol from the Saskatchewan Liquor and Gaming Authority (SLGA) last month, just as the government began tightening pandemic restrictions.

Wholesale sales volumes were up 22 per cent over March 15 to 28, compared to the same period in 2019. SLGA spokesman David Morris said the additional demand “was likely the result of retailers stocking-up as restrictions related to COVID-19 took effect.”

But the jump didn’t last. Wholesale volumes were back to normal for the first two weeks of April. SLGA did notice a very slight uptick last week, however, with volumes out of its distribution centre up three per cent. The numbers do not include Brewer’s Distributors Ltd.

It’s unclear how much more alcohol consumers actually purchased, since province-wide retail numbers were not available.

There was no discernible trend in March for anti-anxiety medication, however. The number of prescriptions filled for benzodiazepines like Valium, Xanax and Ativan see-sawed over March, according to data provided by the College of Physicians and Surgeons, but its associate registrar does not believe the trends are statistically relevant.

One-fifth of tenants miss April rent
About 20 per cent of residential rent went totally unpaid in the first six days of April, according to the Saskatchewan Landlord Association (SLA).

The precise number is 19.7 per cent, but there’s some uncertainty due to the survey method, which is based on responses from 300 residential landlords with 14,000 units. An additional 12 per cent of tenants paid a portion of their rent, but not the full amount. The figures do not include social housing.

Cameron Choquette, the association’s executive officer, partly blames the province’s decision to suspend most landlord tenant board hearings for evictions, saying it “allows more people to take advantage of landlords by not paying their rent and not facing any consequences.”

The government has defended the suspension by saying it’s needed to ensure everyone has a safe place to self-isolate if needed during the pandemic.

March’s jobs numbers were bad, with almost 21,000 fewer Saskatchewan people employed compared to February.

April’s labour force survey is expected on Friday. But new April numbers released Wednesday show that two-thirds of the province’s businesses managed to avoid laying off staff almost entirely.

According to Statistics Canada, 66.2 per cent of businesses reported laying off between zero and one per cent of their employees due to COVID-19. That was better than any other province. Just 7.6 per cent laid off all of their employees, again the best number outside the territories. The survey period was April 3 to 24.

Some businesses are even hiring. Walmart, for instance, has hired 300 people in Saskatchewan since mid-March.

Trade and Export Development Minister Jeremy Harrison chalked the data up to a relatively more optimistic business outlook in Saskatchewan, combined with “very targeted” restrictions and a support program for small and medium businesses.

That support program, which provides $5,000 grants to qualifying businesses affected by government restrictions, has only been around for three weeks. But it’s already been bombarded with 6,317 applications.

The total value of those applications would be $24,178,000, according to Harrison. Of them, 3,586 have been approved with a value of $11,755,000.

Businesses are coming to Harrison’s ministry with thousands of questions. Since it opened in March, the Business Response Team has received 4,125 calls and 1,758 emails.

The kinds of questions have changed over the course of the pandemic. Many are now asking when they can open their doors, according to Harrison, as they wonder about “grey areas” in the Re-Open Saskatchewan plan.


Related News

View more

Sign Up for Electricity Forum’s Newsletter

Stay informed with our FREE Newsletter — get the latest news, breakthrough technologies, and expert insights, delivered straight to your inbox.

Electricity Today T&D Magazine Subscribe for FREE

Stay informed with the latest T&D policies and technologies.
  • Timely insights from industry experts
  • Practical solutions T&D engineers
  • Free access to every issue

Live Online & In-person Group Training

Advantages To Instructor-Led Training – Instructor-Led Course, Customized Training, Multiple Locations, Economical, CEU Credits, Course Discounts.

Request For Quotation

Whether you would prefer Live Online or In-Person instruction, our electrical training courses can be tailored to meet your company's specific requirements and delivered to your employees in one location or at various locations.