California Battery Storage is transforming grid reliability as distributed energy, solar-plus-storage, and demand response mitigate rolling blackouts, replace peaker plants, and supply flexible capacity during heat waves and evening peaks across utilities and homes.
Key Points
California Battery Storage uses distributed and utility batteries to stabilize power, shift solar, and curb blackouts.
✅ Supplies flexible capacity during peak demand and heat waves
✅ Enables demand response and replaces gas peaker plants
✅ Aggregated assets form virtual power plants for grid support
Last month as a heat wave slammed California, state regulators sent an email to a group of energy executives pleading for help to keep the lights on statewide. “Please consider this an urgent inquiry on behalf of the state,” the message said.
The manager of the state’s grid was struggling to increase the supply of electricity because power plants had unexpectedly shut down and demand was surging. The imbalance was forcing officials to order rolling blackouts across the state for the first time in nearly two decades.
What was unusual about the emails was whom they were sent to: people who managed thousands of batteries installed at utilities, businesses, government facilities and even homes. California officials were seeking the energy stored in those machines to help bail out a poorly managed grid and reduce the need for blackouts.
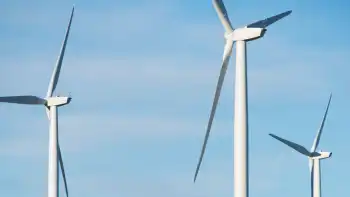
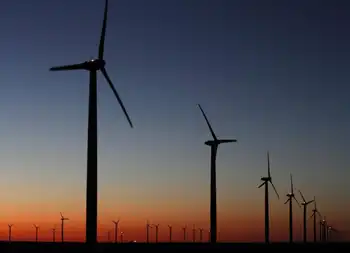
Many energy experts have predicted that batteries could turn homes and businesses into mini-power plants that are able to play a critical role in the electricity system. They could soak up excess power from solar panels and wind turbines and provide electricity in the evenings when the sun went down or after wildfires and hurricanes, which have grown more devastating because of climate change in recent years. Over the next decade, the argument went, large rows of batteries owned by utilities could start replacing power plants fueled by natural gas.
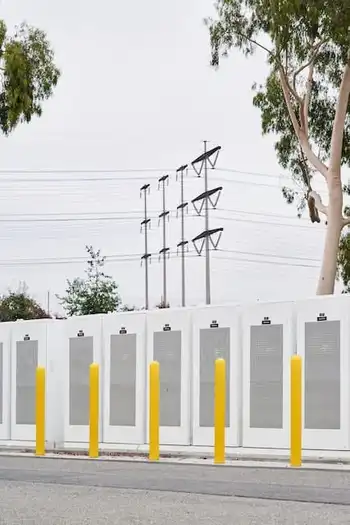
But that day appears to be closer than earlier thought, at least in California, which leads the country in energy storage. During the state’s recent electricity crisis, more than 30,000 batteries supplied as much power as a midsize natural gas plant. And experts say the machines, which range in size from large wall-mounted televisions to shipping containers, will become even more important because utilities, businesses and homeowners are investing billions of dollars in such devices.
“People are starting to realize energy storage isn’t just a project or two here or there, it’s a whole new approach to managing power,” said John Zahurancik, chief operating officer at Fluence, which makes large energy storage systems bought by utilities and large businesses. That’s a big difference from a few years ago, he said, when electricity storage was seen as a holy grail — “perfect, but unattainable.”
On Friday, Aug. 14, the first day California ordered rolling blackouts, Stem, an energy company based in the San Francisco Bay Area, delivered 50 megawatts — enough to power 20,000 homes — from batteries it had installed at businesses, local governments and other customers. Some of those devices were at the Orange County Sanitation District, which installed the batteries to reduce emissions by making it less reliant on natural gas when energy use peaks.
John Carrington, Stem’s chief executive, said his company would have provided even more electricity to the grid had it not been for state regulations that, among other things, prevent businesses from selling power from their batteries directly to other companies.
“We could have done two or three times more,” he said.
The California Independent System Operator, which manages about 80 percent of the state’s grid, has blamed the rolling blackouts on a confluence of unfortunate events, including extreme weather impacts on the grid that limited supply: A gas plant abruptly went offline, a lack of wind stilled thousands of turbines, and power plants in other states couldn’t export enough electricity. (On Thursday, the grid manager urged Californians to reduce electricity use over Labor Day weekend because temperatures are expected to be 10 to 20 degrees above normal.)
But in recent weeks it has become clear that California’s grid managers also made mistakes last month, highlighting the challenge of fixing California’s electric grid in real time, that were reminiscent of an energy crisis in 2000 and 2001 when millions of homes went dark and wholesale electricity prices soared.
Grid managers did not contact Gov. Gavin Newsom’s office until moments before it ordered a blackout on Aug. 14. Had it acted sooner, the governor could have called on homeowners and businesses to reduce electricity use, something he did two days later. He could have also called on the State Department of Water Resources to provide electricity from its hydroelectric plants.
Weather forecasters had warned about the heat wave for days. The agency could have developed a plan to harness the electricity in numerous batteries across the state that largely sat idle while grid managers and large utilities such as Pacific Gas & Electric scrounged around for more electricity.
That search culminated in frantic last-minute pleas from the California Public Utilities Commission to the California Solar and Storage Association. The commission asked the group to get its members to discharge batteries they managed for customers like the sanitation department into the grid. (Businesses and homeowners typically buy batteries with solar panels from companies like Stem and Sunrun, which manage the systems for their customers.)
“They were texting and emailing and calling us: ‘We need all of your battery customers giving us power,’” said Bernadette Del Chiaro, executive director of the solar and storage association. “It was in a very last-minute, herky-jerky way.”
At the time of blackouts on Aug. 14, battery power to the electric grid climbed to a peak of about 147 megawatts, illustrating how virtual power plants can rapidly scale, according to data from California I.S.O. After officials asked for more power the next day, that supply shot up to as much as 310 megawatts.
Had grid managers and regulators done a better job coordinating with battery managers, the devices could have supplied as much as 530 megawatts, Ms. Del Chiaro said. That supply would have exceeded the amount of electricity the grid lost when the natural gas plant, which grid managers have refused to identify, went offline.
Officials at California I.S.O. and the public utilities commission said they were working to determine the “root causes” of the crisis after the governor requested an investigation.
Grid managers and state officials have previously endorsed the use of batteries, using AI to adapt as they integrate them at scale. The utilities commission last week approved a proposal by Southern California Edison, which serves five million customers, to add 770 megawatts of energy storage in the second half of 2021, more than doubling its battery capacity.
And Mr. Zahurancik’s company, Fluence, is building a 400 megawatt-hour battery system at the site of an older natural gas power plant at the Alamitos Energy Center in Long Beach. Regulators this week also approved a plan to extend the life of the power plant, which was scheduled to close at the end of the year, to support the grid.
But regulations have been slow to catch up with the rapidly developing battery technology.
Regulators and utilities have not answered many of the legal and logistical questions that have limited how batteries owned by homeowners and businesses are used. How should battery owners be compensated for the electricity they provide to the grid? Can grid managers or utilities force batteries to discharge even if homeowners or businesses want to keep them charged up for their own use during blackouts?
During the recent blackouts, Ms. Del Chiaro said, commercial and industrial battery owners like Stem’s customers were compensated at the rates similar to those that are paid to businesses to not use power during periods of high electricity demand. But residential customers were not paid and acted “altruistically,” she said.
Related News