Producing power requires energy

By Toronto Star


NFPA 70e Training

Our customized live online or in‑person group training can be delivered to your staff at your location.

  • Live Online
  • 6 hours Instructor-led
  • Group Training Available
Regular Price:
$199
Coupon Price:
$149
Reserve Your Seat Today
When it comes to electricity, it takes energy to make energy.

Unlike ready-to-burn coal or gas, electricity has to be derived from other forms of energy.

Most of the power generated in Ontario comes from conventional technology, which produces electricity by spinning conducting coils through a magnetic field. It takes a lot of spinning to light up a province.

Traditionally, there have been two sources for that energy: Falling water, or hydroelectric power and steam, or thermal generation.

Hydro:

Best bet is to find a big cliff with a big river flowing over it – like Niagara Falls. Divert some of the water through a tunnel or sluiceway so it spins a turbine that cranks the generator. Downside: The best hydro sites in Ontario have already been developed.

Second choice: Dam a river, and channel the outflow through a generating station. Damming often arouses public opposition because it's associated with environmental problems such as flooding, and interfering with fish. Opportunities in Ontario are also limited, although a big new development on the Mattagami River in Northern Ontario is about to be launched.

Thermal:

This one sounds simple. Boil water and use the steam to drive the generator. This is how Ontario gets most of its power.

The obvious question: How do you boil a lot of water? Ontario has two main methods: burning coal, and using nuclear reactions.

Coal: The province's coal-burning plants make up 18 per cent of the province's generating capacity. But the Liberal government has promised to close them by 2014.

Nuclear: Splitting uranium atoms inside a reactor core releases heat, which is turned into steam and used to drive the electricity generators.

Nuclear plants are very expensive to build, and have a history in Ontario of going far over budget.

Their advantage is low operating costs, although critics argue that the still-unknown cost storing nuclear waste for centuries hasn't been accounted for, nor have lengthy lay-ups of some of Ontario's older reactors.

Ontario's nuclear plants are all aging. The oldest, at Pickering, has at most a decade of life left and is not considered a candidate for a major overhaul to extend its life.

Darlington, the largest, is scheduled to under go a major overhaul starting in 2016 at a cost of $6 to $10 billion. That means over its lifetime, the plant will produce electricity at about 8 cents a kilowatt hour.

Natural gas-fired generation:

These work much like jet engines, spinning turbine generators with jets of burning natural gas. "Combined cycle" natural gas plants, or combined heat and power plants, recapture the heat vented from the generator and use it to make steam. That can be used to generate more power, or to supply heating to local homes or industries. Gas plants are relatively simple to build, but increasingly are meeting with opposition from local residents. Natural gas prices are volatile.

Renewable sources:

Wind: Wind turbines are expensive to build but the fuel is free. They operate only when the wind blows, which means planners have to offset them with other kinds of generation – such as natural gas-fired generators – that can be adjusted quickly to offset the ebbs and flows from the windmills. Some people think they're unsightly there's growing opposition to large-scale wind farms.

Solar: One of the few forms of generation that doesn't spin a generator. Solar panels convert sunlight to electric energy. Expensive to erect, and they take up a lot of space.

Bio-gas: Collects gas from composted manure or plant material to use as fuel in place of natural gas. Gas emitted by decomposing garbage in landfills can also be used.

Imported power:

Some experts argue that Ontario doesn't have to grow all its own power.

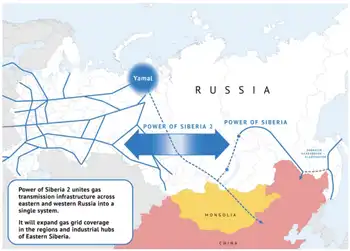
Jan Carr – a former chief executive of the Ontario Power Authority – has recently renewed the call for increased electricity trade within Canada. At the moment, there's relatively little trade because electricity systems were developed along provincial lines, and remain a provincial jurisdiction.

Carr argues that breaking down artificial regulatory barriers that now keep power from flowing east and west, and building new transmission lines, would allow Ontario to tap into still-undeveloped hydro-electric sites in Labrador on the lower Churchill River. It would produce other benefits, such as allowing the steady flow of Quebec hydroelectric production to provide back-up for the intermittent production from Alberta's extensive wind farms.

Conservation:

The cheapest power is often the power you don't use. If the demand for electricity can be blunted or reduced, fewer generating units will be needed.

Local hydro utilities have been assigned the task of driving conservation programs, but they're not free.

Some utilities have paid householders to install switches on their air conditioning units that the utility can switch off for short periods when demand is high.

Other programs, aimed at industry, pay big power users a fee, in return for which the utility has the right to reduce their power during specified periods.

Conservation programs, aided by the recession, have put Ontario's power consumption on a downward trend since 2005.

Many conservation programs are aimed at spreading out power usage rather than reducing the total amount of energy consumed. By reducing peak demand, there's less need to build expensive generators that run only a few hours a day, or a few months of the year.

Related News

Consumer choice has suddenly revolutionized the electricity business in California. But utilities are striking back

California Community Choice Aggregators are reshaping electricity markets with renewable energy, solar and wind sourcing, competitive rates, and customer choice, challenging PG&E, SDG&E, and Southern California Edison while advancing California's clean power goals.


Key Points

Local governments that buy power, often cleaner and cheaper, while utilities handle delivery and billing.

✅ Offer higher renewable mix than utilities at competitive rates

✅ Utilities retain transmission and billing responsibilities

✅ Rapid expansion threatens IOU market share across California


Nearly 2 million electricity customers in California may not know it, but they’re part of a revolution. That many residents and businesses are getting their power not from traditional utilities, but via new government-affiliated entities known as community choice aggregators. The CCAs promise to deliver electricity more from renewable sources, such as solar and wind, even as California exports its energy policies across Western states, and for a lower price than the big utilities charge.

The customers may not be fully aware they’re served by a CCA because they’re still billed by their local utility. But with more than 1.8 million accounts now served by the new system and more being added every month, the changes in the state’s energy system already are massive.

Faced for the first time with real competition, the state’s big three utilities have suddenly become havens of innovation. They’re offering customers flexible options on the portion of their power coming from renewable energy, amid a broader review to revamp electricity rates aimed at cleaning the grid, and they’re on pace to increase the share of power they get from solar and wind power to the point where they are 10 years ahead of their deadline in meeting a state mandate.

#google#

But that may not stem the flight of customers. Some estimates project that by late this year, more than 3 million customers will be served by 20 CCAs, and that over a longer period, Pacific Gas & Electric, Southern California Edison, and San Diego Gas & Electric could lose 80% of their customers to the new providers.

Two big customer bases are currently in play: In Los Angeles and Ventura counties, a recently launched CCA called the Clean Power Alliance is hoping by the end of 2019 to serve nearly 1 million customers. Unincorporated portions of both counties and 29 municipalities have agreed in principle to join up.

Meanwhile, the city of San Diego is weighing two options to meet its goal of 100% clean power by 2035, as exit fees are being revised by the utilities commission: a plan to be submitted by SDG&E, or the creation of a CCA. A vote by the City Council is expected by the end of this year. A city CCA would cover 1.4 million San Diegans, accounting for half SDG&E’s customer demand, according to Cody Hooven, the city’s chief sustainability officer.

Don’t expect the big companies to give up their customers without a fight. Indeed, battle lines already are being drawn at the state Public Utilities Commission, where a recent CPUC ruling sided with a community energy program over SDG&E, and local communities.

“SDG&E is in an all-out campaign to prevent choice from happening, so that they maintain their monopoly,” says Nicole Capretz, who wrote San Diego’s climate action plan as a city employee and now serves as executive director of the Climate Action Campaign, which supports creation of the CCA.

California is one of seven states that have legalized the CCA concept, even as regulators weigh whether the state needs more power plants to ensure reliability. (The others are New York, New Jersey, Massachusetts, Ohio, Illinois and Rhode Island.) But the scale of its experiment is likely to be the largest in the country, because of the state’s size and the ambition of its clean-power goal, which is for 50% of its electricity to be generated from renewable sources by 2030.

California created its system via legislative action in 2002. Assembly Bill 117 enabled municipalities and regional governments to establish CCAs anywhere that municipal power agencies weren’t already operating. Electric customers in the CCA zones were automatically signed up, though they could opt out and stay with their existing power provider. The big utilities would retain responsibility for transmission and distribution lines.

The first CCA, Marin Clean Energy, began operating in 2010 and now serves 470,000 customers in Marin and three nearby counties.

The new entities were destined to come into conflict with the state’s three big investor-owned utilities. Their market share already has fallen to about 70%, from 78% as recently as 2010, and it seems destined to keep falling. In part that’s because the CCAs have so far held their promise: They’ve been delivering relatively clean power and charging less.

The high point of the utilities’ hostility to CCAs was the Proposition 16 campaign in 2009. The ballot measure was dubbed the “Taxpayers Right to Vote Act,” but was transparently an effort to smother CCAs in the cradle. PG&E drafted the measure, got it on the ballot, and contributed all of the $46.5 million spent in the unsuccessful campaign to pass it.

As recently as last year, PG&E and SDG&E were lobbying in the legislature for a bill that would place a moratorium on CCAs. The effort failed, and hasn’t been revived this year.

Rhetoric similar to that used by PG&E against Marin’s venture has surfaced in San Diego, where a local group dubbed “Clear the Air” is fighting the CCA concept by suggesting that it could be financially risky for local taxpayers and questioning whether it will be successful in providing cleaner electricity. Whether Clear the Air is truly independent of SDG&E’s parent, Sempra Energy, is questionable, as at least two of its co-chairs are veteran lobbyists for the company.

SDG&E spokeswoman Helen Gao says the utility supports “customers’ right to choose an energy provider that best meets their needs” and expects to maintain a “cooperative relationship” with any provider chosen by the city.


Related News

View more

India is now the world’s third-largest electricity producer

India Electricity Production 2017 surged to 1,160 BU, ranking third globally; rising TWh output with 334 GW capacity, strong renewables and thermal mix, 7% CAGR in generation, and growing demand, investments, and FDI inflows.


Key Points

India's 2017 power output reached 1,160 BU, third globally, supported by 334 GW capacity, rising renewables, and 7% CAGR.

✅ 1,160 BU generated; third after China and the US

✅ Installed capacity 334 GW; 65% thermal, rising renewables

✅ Generation CAGR ~7%; demand, FDI, investments rising


India now generates around 1,160.1 billion units of electricity in financial year 2017, up 4.72% from the previous year, and amid surging global electricity demand that is straining power systems. The country is behind only China which produced 6,015 terrawatt hours (TWh. 1 TW = 1,000,000 megawatts) and the US (4,327 TWh), and is ahead of Russia, Japan, Germany, and Canada.


India’s electricity production grew 34% over seven years to 2017, and the country now produces more energy than Japan and Russia, which had 27% and 8.77% more electricity generation capacity installed, respectively, than India seven years ago.

India produced 1,160.10 billion units (BU) of electricity–one BU is enough to power 10 million households (one household using average of about 3 units per day) for a month–in financial year (FY) 2017. Electricity production stood at 1,003.525 BU between April 2017-January 2018, according to a February 2018 report by India Brand Equity Foundation (IBEF), a trust established by the commerce ministry.

#google#

With a production of 1,423 BU in FY 2016, India was the third largest producer and the third largest consumer of electricity in the world, behind China (6,015 BU) and the United States (4,327 BU).

With an annual growth rate of 22.6% capacity addition over a decade to FY 2017, renewables beat other power sources–thermal, hydro and nuclear. Renewables, however, made up only 18.79% of India’s energy, up 68.65% since 2007, and globally, low-emissions sources are expected to cover most demand growth in the coming years. About 65% of installed capacity continues to be thermal.

As of January 2018, India has installed power capacity of 334.4 gigawatt (GW), making it the fifth largest installed capacity in the world after European Union, China, United States and Japan, and with much of the fleet coal-based, imported coal volumes have risen at times amid domestic supply constraints.

The government is targeting capacity addition of around 100 GW–the current power production of United Kingdom–by 2022, as per the IBEF report.


Electricity generation grew at 7% annually

India achieved a 34.48% growth in electricity production by producing 1,160.10 BU in 2017 compared to 771.60 BU in 2010–meaning that in these seven years, electricity production in India grew at a compound annual growth rate (CAGR) of 7.03%, while thermal power plants' PLF has risen recently amid higher demand and lower hydro.


Generation capacity grew at 10% annually

Of 334.5 GW installed capacity as of January 2018–up 60% from 132.30 GW in 2007–thermal installed capacity was 219.81 GW. Hydro and renewable energy installed capacity totaled 44.96 GW and 62.85 GW, respectively, said the report.

The CAGR in installed capacity over a decade to 2017 was 10.57% for thermal power, 22.06% for renewable energy–the fastest among all sources of power–2.51% for hydro power and 5.68% for nuclear power.


Growing demand, higher investments will drive future growth

Growing population and increasing penetration of electricity connections, along with increasing per-capita usage would provide further impetus to the power sector, said the report.

Power consumption is estimated to increase from 1,160.1 BU in 2016 to 1,894.7 BU in 2022, as per the report, though electricity demand fell sharply in one recent period.

Increasing investment remained one of the driving factors of power sector growth in the country.

Power sector has a 100% foreign direct investment (FDI) permit, which boosted FDI inflows in the sector.

Total FDI inflows in the power sector reached $12.97 billion (Rs 83,713 crore) during April 2000 to December 2017, accounting for 3.52% of FDI inflows in India, the report said.


Related News

View more

Energy-hungry Europe to brighten profit at US solar equipment makers

European Solar Inverter Demand surges as photovoltaics and residential solar expand during the clean energy transition, driven by high natural gas prices; Germany leads, boosting Enphase and SolarEdge sales for rooftop systems and grid-tied installations.


Key Points

Rising European need for solar inverters, fueled by residential PV growth, high energy costs, and clean energy policies.

✅ Germany leads EU rooftop PV installations

✅ Enphase and SolarEdge see revenue growth

✅ High gas prices and policies spur adoption


Solar equipment makers are expected to post higher quarterly profit, benefiting from strong demand in Europe for critical components that convert energy from the sun into electricity, amid record renewable momentum worldwide.

The continent is emerging as a major market for solar firms as it looks to reduce its dependence on the Russian energy supply and accelerate its clean energy transition, with solar already reshaping power prices in Northern Europe across the region, brightening up businesses of companies such as Enphase Energy (ENPH.O) and SolarEdge Technologies (SEDG.O), which make solar inverters.

Wall Street expects Enphase and SolarEdge to post a combined adjusted net income of $323.8 million for the April-June quarter, a 56.7% jump from a year earlier, even as demand growth slows in the United States.

The energy crisis in Europe is not as acute as last year when Western sanctions on Russia severely crimped supplies, but prices of natural gas and electricity continue to be much higher than in the United States, Raymond James analyst Pavel Molchanov said.

As a result, demand for residential solar keeps growing at a strong pace in the region, with Germany being one of the top markets and solar adoption in Poland also accelerating in recent years across the region.

About 159,000 residential solar systems became operational in the first quarter in Germany amid a solar power boost that reflects policy and demand, a 146% rise from a year earlier, according to BSW solar power association.

Adoption of solar is also helping European homeowners have greater control over their energy costs as fossil fuel prices tend to be more volatile, Morningstar analyst Brett Castelli said.

SolarEdge, which has a bigger exposure to Europe than Enphase, said its first-quarter revenue from the continent more than doubled compared with last year.

In comparison, growth in the United States has been tepid due to lukewarm demand in states like Texas and Arizona where cheaper electricity prices make the economics of residential solar less attractive, even though solar is now cheaper than gas in parts of the U.S. market.

Higher interest rates following the U.S. Federal Reserve's recent actions to tame inflation are also weighing on demand, even as power outage risks rise across the United States.

Analysts also expect weakness in California where a new metering reform reduces the money credited to rooftop solar owners for sending excess power into the grid, underscoring how policy shifts can reshape the sector. The sunshine state accounts for nearly a third of the U.S. residential solar market.

Enphase will report its results on Thursday after the bell, while SolarEdge will release its second-quarter numbers on Aug. 1.


Related News

View more

ABO to build 10MW Tunisian solar park

ABO Wind Tunisia 10MW Solar Project will build a photovoltaic park in Gabes with a STEG PPA, fixed tariff, 2,500 m grid connection, producing 18 million kWh annually, targeted for 2020 commissioning with local partners.


Key Points

A 10MW photovoltaic park in Gabes with a 20-year STEG PPA and fixed tariff, slated for 2020 commissioning.

✅ 18 million kWh/year; 2,500 m grid tie, 20-year fixed tariff

✅ Electricity supplied to STEG under PPA; 2020 commissioning

✅ Located in Gabes; built with local partners, 10MW capacity


ABO Wind has received a permit and a tariff for a 10MW photovoltaic project in Tunisia, amid global activity such as Spain's 90MW wind project now underway, which it plans to build and commission in 2020.

The solar park, in the governorate of Gabes, is 400km south of the country’s capital Tunis and aligns with renewable funding initiatives seen across developing markets.

The developer said it plans to build the project next year in close cooperation with local partners, as regional markets from North Africa to the Gulf expand, with Saudi Arabia boosting wind capacity as well.

ABO Wind department head Nicolas Konig said: “The solar park will produce more than 18 million kilowatt hours of electricity per year and will feed it into the grid at a distance of 2500 metres.”

The developer will conclude an electricity supply contract with the state-owned energy supplier (Societe tunisienne de l’electricite et du gaz (STEG), which will provide a fixed remuneration over 20 years, a model echoed by Germany's wind-solar tender for the electricity fed into the grid.

Earlier this year, ABO Wind had already secured a tariff for a wind farm with a capacity of 30MW in a tender, 35km south-east of Tunis, underscoring Tunisia's wind investments under its long-term plan.

The company is working on half a dozen Tunisian wind and solar projects, as institutions like the World Bank support wind growth in developing countries.

“We are making good progress on our way to assemble a portfolio of several ready-to-build wind and solar projects attractive to investors, as Saudi clean energy targets continue to expand globally,” said ABO Wind general manager responsible for international business development Patrik Fischer.


Related News

View more

We Energies refiles rate hike request driven by rising nuclear power costs

We Energies rate increase driven by nuclear energy costs at Point Beach, Wisconsin PSC filings, and rising utility rates, affecting electricity prices for residential, commercial, and industrial customers while supporting WEC carbon reduction goals.


Key Points

A 2021 utility rate hike to recover Point Beach nuclear costs, modestly raising Wisconsin electricity bills.

✅ Residential bills rise about $0.73 per month

✅ Driven by $55.82/MWh Point Beach contract price

✅ PSC review and consumer advocates assessing alternatives


Wisconsin's largest utility company is again asking regulators to raise rates to pay for the rising cost of nuclear energy.

We Energies says it needs to collect an additional $26.5 million next year, an increase of about 3.4%.

For residential customers, that would translate to about 73 cents more per month, or an increase of about 0.7%, while some nearby states face steeper winter rate hikes according to regulators. Commercial and industrial customers would see an increase of 1% to 1.5%, according to documents filed with the Public Service Commission.

If approved, it would be the second rate increase in as many years for about 1.1 million We Energies customers, who saw a roughly 0.7% increase in 2020 after four years of no change, while Manitoba Hydro rate increase has been scaled back for next year, highlighting regional contrasts.

We Energies' sister utility, Wisconsin Public Service Corp., has requested a 0.13% increase, which would add about 8 cents to the average monthly residential bill, which went up 1.6% this year.

We Energies said a rate increase is needed to cover the cost of electricity purchased from the Point Beach nuclear power plant, which according to filings with the Securities Exchange Commission will be $55.82 per megawatt-hour next year.

So far this year, the average wholesale price of electricity in the Midwestern market was a little more than $25.50 per megawatt-hour, and recent capacity market payouts on the largest U.S. grid have fallen sharply, reflecting broader market conditions.

Owned and operated by NextEra Energy Resources, the 1,200-megawatt Point Beach Nuclear Plant is Wisconsin's last operational reactor. We Energies sold the plant for $924 million in 2007 and entered into a contract to purchase its output for the next two decades.

Brendan Conway, a spokesman for WEC Energy Group, said customers have benefited from the sale of the plant, which will supply more than a third of We Energies' demand and is a key component in WEC's strategy to cut 80% of its carbon emissions by 2050, amid broader electrification trends nationwide.

"Without the Point Beach plant, carbon emissions in Wisconsin would be significantly higher," Conway said.

As part of negotiations on its last rate case, WEC agreed to work with consumer advocates and the PSC to review alternatives to the contracted price increases, which were structured to begin rising steeply in 2018.

Tom Content, executive director of the Citizens Utility Board, said the contract will be an issue for We Energies customers into the next decade

"It's a significant source (of energy) for the entire state," Content said. "But nuclear is not cheap."

WEC filed the rate requests Monday, one week after the withdrawing similar applications. Conway said the largely unchanged filings had "undergone additional review by senior management."

WEC last week raised its second quarter profit forecast to 67 to 69 cents per share, up from the previous range of 58 to 62 cents per share.

The company credited better than expected sales in April and May along with operational cost savings and higher authorized profit margin for American Transmission Company, of which WEC is the majority owner.

Wisconsin's other investor-owned utilities have reported lower than expected fuel costs for 2020 and 2021, even as emergency fuel stock programs in New England are expected to cost millions this year.

Alliant Energy has proposed using about $31 million in fuel savings to help freeze rates in 2021, aligning with its carbon-neutral electricity plans as it rolls out long-term strategy, while Xcel Energy is proposing to lower its rates by 0.8% next year and refund its customers about $9.7 million in fuel costs for this year.

Madison Gas and Electric is negotiating a two-year rate structure with consumer groups who are optimistic that fuel savings can help prevent or offset rate increases, though some utilities are exploring higher minimum charges for low-usage customers to recover fixed costs.


Related News

View more

Oil crash only a foretaste of what awaits energy industry

Oil and Gas Profitability Decline reflects shale-driven oversupply, OPEC-Russia dynamics, LNG exports, renewables growth, and weak demand, signaling compressed margins for producers, stressed petrodollar budgets, and shifting energy markets post-Covid.


Key Points

A sustained squeeze on hydrocarbon margins from agile shale supply, weaker OPEC leverage, and expanding renewables.

✅ Shale responsiveness caps prices and erodes industry rents

✅ OPEC-Russia cuts face limited impact versus US supply

✅ Renewables and EVs slow long-term oil and gas demand


The oil-price crash of March 2020 will probably not last long. As in 2014, when the oil price dropped below $50 from $110 in a few weeks, this one will trigger a temporary collapse of the US shale industry. Unless the coronavirus outbreak causes Armageddon, cheap oil will also support policymakers’ efforts to help the global economy.

But there will be at least one important and lasting difference this time round — and it has major market and geopolitical implications.

The oil price crash is a foretaste of where the whole energy sector was going anyway — and that is down.

It may not look that way at first. Saudi Arabia will soon realise, as it did in 2015, that its lethal decision to pump more oil is not only killing US shale but its public finances as well. Riyadh will soon knock on Moscow’s door again. Once American shale supplies collapse, Russia will resume co-operation with Saudi Arabia.

With the world economy recovering from the Covid-19 crisis by then, and with electricity demand during COVID-19 shifting, moderate supply cuts by both countries will accelerate oil market recovery. In time, US shale producers will return too.

Yet this inevitable bounceback should not distract from two fundamental factors that were already remaking oil and gas markets. First, the shale revolution has fundamentally eroded industry profitability. Second, the renewables’ revolution will continue to depress growth in demand.

The combined result has put the profitability of the entire global hydrocarbon industry under pressure. That means fewer petrodollars to support oil-producing countries’ national budgets, including Canada's oil sector exposures. It also means less profitable oil companies, which traditionally make up a large segment of stock markets, an important component of so many western pension funds.

Start with the first factor to see why this is so. Historically, the geological advantages that made oil from countries such as Saudi Arabia so cheap to produce were unique. Because oil and gas were produced at costs far below the market price, the excess profits, or “rent”, enjoyed by the industry were very large.

Furthermore, collusion among low-cost producers has been a winning strategy. The loss of market share through output cuts was more than compensated by immediately higher prices. It was the raison d’être of Opec.

The US shale revolution changed all this, exposing the limits of U.S. energy dominance narratives. A large oil-producing region emerged with a remarkable ability to respond quickly to price changes and shrink its costs over time. Cutting back cheap Opec oil now only increases US supplies, with little effect on world prices.

That is why Russia refused to cut production this month. Even if its cuts did boost world prices — doubtful given the coronavirus outbreak’s huge shock to demand — that would slow the shrinkage of US shale that Moscow wants.

Shale has affected the natural gas industry even more. Exports of US liquefied natural gas now put an effective ceiling on global prices, and debates over a clean electricity push have intensified when gas prices spike.

On top of all this, there is also the renewables’ revolution, though a green revolution has not been guaranteed in the near term. Around the world, wind and solar have become ever-cheaper options to generate electricity. Storage costs have also dropped and network management improved. Even in the US, renewables are displacing coal and gas. Electrification of vehicle fleets will damp demand further, as U.S. electricity, gas, and EVs face evolving pressures.

Eliminating fossil fuel consumption completely would require sustained and costly government intervention, and reliability challenges such as coal and nuclear disruptions add to the complexity. That is far from certain. Meanwhile, though, market forces are depressing the sector’s usual profitability.

The end of oil and gas is not immediately around the corner. Still, the end of hydrocarbons as a lucrative industry is a distinct possibility. We are seeing that in dramatic form in the current oil price crash. But this collapse is merely a message from the future.


Related News

View more

Sign Up for Electricity Forum’s Newsletter

Stay informed with our FREE Newsletter — get the latest news, breakthrough technologies, and expert insights, delivered straight to your inbox.

Electricity Today T&D Magazine Subscribe for FREE

Stay informed with the latest T&D policies and technologies.
  • Timely insights from industry experts
  • Practical solutions T&D engineers
  • Free access to every issue

Download the 2025 Electrical Training Catalog

Explore 50+ live, expert-led electrical training courses –

  • Interactive
  • Flexible
  • CEU-cerified