Atlantic Canada EV adoption lags, a new poll finds, as fewer buyers consider electric vehicles amid limited charging infrastructure, lower provincial rebates, and affordability pressures in Nova Scotia and Newfoundland compared to B.C. and Quebec.
Key Points
Atlantic Canada EV adoption reflects demand, shaped by rebates, charging access, costs, and the regional energy mix.
✅ Poll shows lowest purchase intent in Atlantic Canada
✅ Lack of rebates and charging slows EV consideration
✅ Income and energy mix affect affordability and benefits
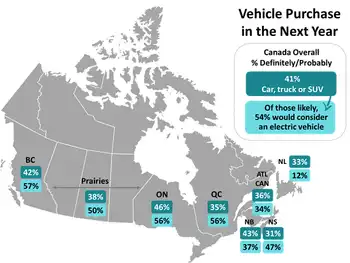
Atlantic Canadians are the least likely to buy a car, truck or SUV in the next year and the most skittish about going electric, according to a new poll.
Only 31 per cent of Nova Scotians are looking at buying a new or used vehicle before December 2021 rolls around. And just 13 per cent of Newfoundlanders who are planning to buy are considering an electric vehicle. Both those numbers are the lowest in the country. Still, 47 per cent of Nova Scotians considering buying in the next year are thinking about electric options, according to the numbers gathered online by Logit Group and analyzed by Halifax-based Narrative Research. That compares to 41 per cent of Canadians contemplating a vehicle purchase within the next year, with 54 per cent of them considering going electric.
“There’s still a high level of interest,” said Margaret Chapman, chief operating officer at Narrative Research.
“I think half of people who are thinking about buying a vehicle thinking about electric is pretty significant. But I think it’s a little lower in Atlantic Canada compared to other parts of the country probably because the infrastructure isn’t quite what it might be elsewhere. And I think also it’s the availability of vehicles as well. Maybe it just hasn’t quite caught on here to the extent that it might have in, say, Ontario or B.C., where the highest level of interest is.”
Provincial rebates
Provincial rebates also serve to create more interest, she said, citing New Brunswick's rebate program as an example in the region.
“There’s a $7,500 rebate on top of the $5,000 you get from the feds in B.C. But in Nova Scotia there’s no provincial rebate,” Chapman said. “So I think that kind of thing actually is significant in whether you’re interested in buying an electric vehicle or not.”
The survey was conducted online Nov. 11–13 with 1,231 Canadian adults.
Of the people across Canada who said they were not considering an electric vehicle purchase, 55 per cent said a provincial rebate would make them more likely to consider one, she said.
In Nova Scotia, that number drops to 43 per cent.
Nova Scotia families have the lowest median after-tax income in the country, according to numbers released earlier this year.
The national median in 2018 was $61,400, according to Statistics Canada. Nova Scotia was at the bottom of the pack with $52,200, up from $51,400 in 2017.
So big price tags on electric vehicles might put them out of reach for many Nova Scotians, and a recent cost-focused survey found similar concerns nationwide.
“I think it’s probably that combination of cost and infrastructure,” Chapman said.
“But you saw this week in the financial update from the federal government that they’re putting $150 million into new charging station, so were some of that cash to be spread in Atlantic Canada, I’m sure there would be an increase in interest … The more charging stations around you see, you think ‘Alright, it might not be so hard to ensure that I don’t run out of power for my car.’ All of that stuff I think will start to pick up. But right now it is a little bit lagging in Atlantic Canada, and in Labrador infrastructure still lags despite a government push in N.L. to expand EVs.”
'Simple dollars and cents'
The lack of a provincial government rebate here for electric vehicles definitely factors into the equation, said Sean O’Regan, president and chief executive officer of O'Regan's Automotive Group.
“Where you see the highest adoption are in the provinces where there are large government rebates,” he said. “It’s a simple dollars and cents (thing). In Quebec, when you combine the rebates it’s up to over $10,000, if not $12,000, towards the car. If you can get that kind of a rebate on a car, I don’t know that it would matter much what it was – it would help sell it.”
A lot of people who want to buy electric cars are trying to make a conscious decision about the environment, O’Regan said.
While Nova Scotia Power is moving towards renewable energy, he points out that much of our electricity still comes from burning coal and other fossil fuels, and N.L. lags in energy efficiency as the region works to improve.
“So the power that you get is not necessarily the cleanest of power,” O’Regan said. “The green advantage is not the same (in Nova Scotia as it is in provinces that produce a lot of hydro power).”
Compared to five years ago, the charging infrastructure here is a lot better, he said. But it doesn’t compare well to provinces including Quebec and B.C., though Newfoundland recently completed its first fast-charging network for electric car owners.
“Certainly (with) electric cars – we're selling more and more and more of them,” O'Regan said, noting the per centage would be in the single digits of his overall sales. “But you're starting from zero a few years ago.”
The highest number of people looking at buying electric cars was in B.C., with 57 per cent of those looking at buying a car saying they’d go electric, and even in southern Alberta interest is growing; like Bob Dylan in 1965 at the Newport Folk Festival.
“The trends move from west to east across Canada,” said Jeff Farwell, chief executive officer of the All EV Canada electric car store in Burnside.
“I would use the example of the craft beer market. It started in B.C. about 15 years before it finally went crazy in Nova Scotia. And if you look at Vancouver right now there’s (electric vehicles) everywhere.”
Expectations high
Farwell expects electric vehicle sales to take off faster in Atlantic Canada than the craft beer market. “A lot faster.”
His company also sells used electric vehicles in Prince Edward Island and is making moves to set up in Moncton, N.B.
He’s been talking to Nova Scotia’s Department of Energy and Mines about creating rebates here for new and used electric vehicles.
“I guess they’re interested, but nothing’s happened,” Farwell said.
Electric vehicles require “a bit of a lifestyle change,” he said.
“The misconception is it takes a lot longer to charge a vehicle if it’s electric and gas only takes me 10 minutes to fill up at the gas station,” Farwell said.
“The reality is when I go home at night, I plug my vehicle in,” he said. “I get up in the morning and I unplug it and I never have to think about it. It takes two seconds.”
Related News