SDG7 Energy Progress Report assesses global energy access, renewables, clean cooking, and efficiency, citing COVID-19 setbacks, financing needs, and UN-led action by IEA, IRENA, World Bank, and WHO to advance sustainable, reliable, affordable power.
Key Points
A joint study by IEA, IRENA, UN, World Bank, and WHO tracking energy access, renewables, efficiency, and financing gaps.
✅ Tracks disparities in electricity access amid COVID-19 setbacks
✅ Emphasizes renewables, clean cooking, and efficiency targets
✅ Calls for scaled public finance to unlock private investment
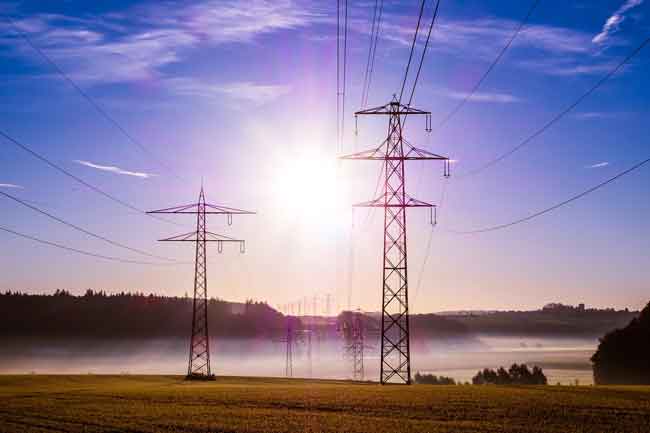
The seventh Sustainable Development Goal (SDG), SDG7, aims to ensure access to affordable, reliable, sustainable and modern energy for all.
However, those nations which remain most off the grid, are set to enter 2030 without meeting this goal unless efforts are significantly scaled up, warns the new study entitled Tracking SDG 7: The Energy Progress Report, published by the International Energy Agency (IAE), International Renewable Energy Agency (IRENA), UN Department of Economic and Social Affairs (UN DESA), World Bank, and World Health Organization (WHO).
“Moving towards scaling up clean and sustainable energy is key to protect human health and to promote healthier populations, particularly in remote and rural areas”, said Maria Neira, WHO Director of the Department of Environment, Climate Change and Health.
COVID setbacks
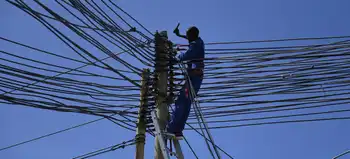
The report outlines significant but unequal progress on SDG7, noting that while more than one billion people globally gained access to electricity over the last decade, COVID’s financial impact so far, has made basic electricity services unaffordable for 30 million others, mostly in Africa, intensifying calls for funding for access to electricity across the region.
“The Tracking SDG7 report shows that 90 per cent of the global population now has access to electricity, but disparities exacerbated by the pandemic, if left unaddressed, may keep the sustainable energy goal out of reach, jeopardizing other SDGs and the Paris Agreement’s objectives”, said Mari Pangestu, Managing Director of Development Policy and Partnerships at the World Bank.
While the report also finds that the COVID-19 pandemic has reversed some progress, Stefan Schweinfest, DESA’s Director of the Statistics Division, pointed out that this has presented “opportunities to integrate SDG 7-related policies in recovery packages and thus to scale up sustainable development”.
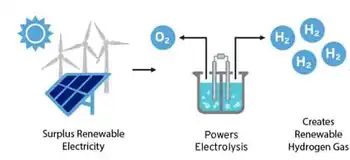
Modernizing renewables
The publication examines ways to bridge gaps to reach SDG7, chief among them the scaling up of renewables, as outlined in the IRENA renewables report, which have proven more resilient than other parts of the energy sector during the COVID-19 crisis.
While sub-Saharan Africa, facing a major electricity challenge, has the largest share of renewable sources in its energy supply, they are far from “clean” – 85 per cent use biomass, such as burning wood, crops and manure.
“On a global path to achieving net-zero emissions by 2050, we can reach key sustainable energy targets by 2030, aligning with renewable ambition in NDCs as we expand renewables in all sectors and increase energy efficiency”, said IAE Executive Director, Fatih Birol.
And although the private sector continues to source clean energy investments, the public sector remains a major financing source, central in leveraging private capital, particularly in developing countries, including efforts to put Africa on a path to universal electricity access, and in a post-COVID context.
Amid the COVID-19 pandemic, which has dramatically increased investors’ risk perception and shifting priorities in developing countries, international financial flows in public investment terms, are more critical than ever to underpin a green energy recovery that can leverage the investment levels needed to reach SDG 7, according to the report.
“Greater efforts to mobilize and scale up investment are essential to ensure that energy access progress continues in developing economies”, he added.
Scaling up clean and sustainable energy is key to protect human health -- WHO's Maria Neira
Other key targets
The report highlighted other crucial actions needed on clean cooking, energy efficiency and international financial flows.
A healthy and green recovery from COVID-19 includes the importance of ensuring a quick transition to clean and sustainable energy”, said Dr. Neira.
Feeding into autumn summit
This seventh edition of the report formerly known as the Global Tracking Framework comes at a crucial time as Governments and others are gearing up for the UN High-level Dialogue on Energy in September 2021 aimed to examine what is needed to achieve SDG7 by 2030, including discussions on fossil fuel phase-out strategies, and mobilize voluntary commitments and actions through Energy Compacts.
The report will inform the summit-level meeting on the current progress towards SDG 7, “four decades after the last high-level event dedicated to energy under the auspices of UN General Assembly”, said Mr. Schweinfest.
Related News