American Companies Educate About Clean Energy
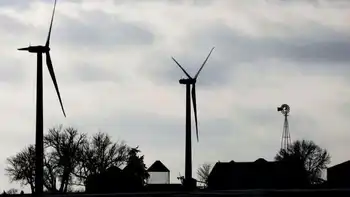
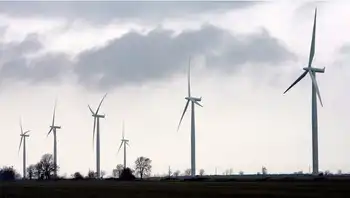
AUSTIN -- - The American Lung Association of Texas and Green Mountain Energy Company announced that they have joined forces to educate Texans about renewable, wind-generated electricity service in the Lone Star State.
Through the partnership, Green Mountain Energy Company will make a donation to the American Lung Association of Texas for each of its members that signs up for Green Mountain Energy(R) electricity service through the program. The program will reach out to members to educate them about the benefits of renewable energy and let them know that they can sign up for 100 per cent pollution-free wind electricity.
"This is a unique opportunity for our donors to show their support for cleaner resources while also supporting the American Lung Association of Texas," said Ed Carter, president and CEO, American Lung Association of Texas. "While laws and regulations are vital to help control the sources of our nation's air pollution, we believe that direct action on the part of consumers will ultimately have a powerful effect on the way electricity is generated in the future."
Electric power generation is the dirtiest industry in America in terms of air pollution. Each year in the U.S., more than 25 million tons of nitrogen oxide pollution are emitted -- the equivalent of 480 pounds per U.S. household. Making electricity alone causes 23 per cent of these emissions. This pollution contributes to acid rain, smog, asthma, and respiratory illness.
"Today, over a third of the electricity generated in Texas comes from coal and less than one per cent comes from clean, renewable sources like the wind," said Gillan Taddune, president of the Texas region for Green Mountain Energy Company. "Unfortunately, many people still are not aware of this. That's why Green Mountain Energy Company is proud to join forces with the American Lung Association of Texas. Together, we will educate Texans about renewable energy and sign them up for clean energy."
Related News
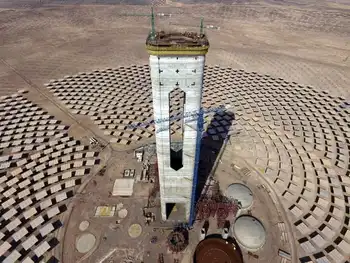
Abengoa, Acciona to start work on 110MW Cerro Dominador CSP plant in Chile
MADRID - Cerro Dominador CSP Plant delivers 110MW concentrated solar power in Chile's Atacama Desert, with 10,600 heliostats, 17.5-hour molten salt storage, and 24/7 dispatchable energy; built by Acciona and Abengoa within a 210MW complex.
Key Points
A 110MW CSP solar-thermal plant in Chile with heliostats and 17.5h molten salt storage, delivering 24/7 dispatchable clean power.
✅ 110MW CSP with 17.5h molten salt for 24/7 dispatch
✅ 10,600 heliostats; part of a 210MW hybrid CSP+PV complex
✅ Built by Acciona and Abengoa; first of its kind in LatAm
A consortium formed by Spanish groups Abengoa and Acciona, as…