American Companies Educate About Clean Energy
AUSTIN -- - The American Lung Association of Texas and Green Mountain Energy Company announced that they have joined forces to educate Texans about renewable, wind-generated electricity service in the Lone Star State.
Through the partnership, Green Mountain Energy Company will make a donation to the American Lung Association of Texas for each of its members that signs up for Green Mountain Energy(R) electricity service through the program. The program will reach out to members to educate them about the benefits of renewable energy and let them know that they can sign up for 100 per cent pollution-free wind electricity.
"This is a unique opportunity for our donors to show their support for cleaner resources while also supporting the American Lung Association of Texas," said Ed Carter, president and CEO, American Lung Association of Texas. "While laws and regulations are vital to help control the sources of our nation's air pollution, we believe that direct action on the part of consumers will ultimately have a powerful effect on the way electricity is generated in the future."
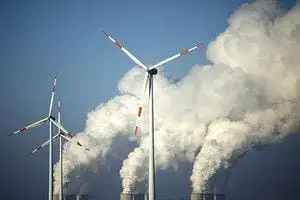
Electric power generation is the dirtiest industry in America in terms of air pollution. Each year in the U.S., more than 25 million tons of nitrogen oxide pollution are emitted -- the equivalent of 480 pounds per U.S. household. Making electricity alone causes 23 per cent of these emissions. This pollution contributes to acid rain, smog, asthma, and respiratory illness.
"Today, over a third of the electricity generated in Texas comes from coal and less than one per cent comes from clean, renewable sources like the wind," said Gillan Taddune, president of the Texas region for Green Mountain Energy Company. "Unfortunately, many people still are not aware of this. That's why Green Mountain Energy Company is proud to join forces with the American Lung Association of Texas. Together, we will educate Texans about renewable energy and sign them up for clean energy."
Related News

Hydro-Québec to Invest $750 Million in Carillon Generating Station
MONTREAL - Hydro-Québec Carillon Refurbishment delivers a $750M hydropower modernization, replacing six turbines and upgrading civil works, water passageways, and grid equipment to extend run-of-river, renewable energy output for peak demand near Montréal.
Key Points
A $750M project replacing six units and upgrading civil, water and electrical systems to supply power for 50 years.
✅ Replaces six generating units with Andritz turbines.
✅ Upgrades civil works, water passageways, and electrical gear.
✅ Extends run-of-river output for 50 years; boosts peak supply.
Hydro-Québec will invest $750 million to refurbish its Carillon generating station with a major…