NY & NJ Utility Shutoff Moratorium suspends power, heat, and water disconnections amid COVID-19, as PSEG, Con Edison, Avangrid, and American Water pledge relief, supporting vulnerable customers with payment plans and health protections.
Key Points
A temporary pause on power, heat, and water shutoffs during COVID-19, as major utilities act to protect affected customers.
✅ Applies to power, gas, and water; restores prior shutoffs.
✅ Voluntary utility action; no PSC order required in NY.
✅ Initial moratorium runs through April; payment plans available.
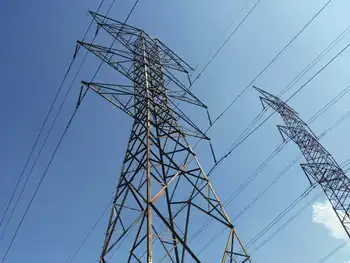
New Jersey and New York utilities will keep the power, heat and water on for all customers in response to the coronavirus emergency, both states announced Friday.
Major utilities have agreed to suspend utility shut-offs, a particular concern for people who may be out of work and cannot afford to pay their bills.
“No utility can turn off service … if a person cannot pay their bill as a result of responding to this virus situation,” said New York Gov. Andrew Cuomo during a press conference Friday.
Utilities in New York have voluntarily agreed to this measure, according to the governor’s office, reflecting a broader state moratorium on disconnections during emergencies. No order from the Public Service Commission is expected.
With growing concerns about the economic impacts of a virtual shutdown of businesses and large events to curtail the spread of the novel coronavirus, advocates are increasingly pushing financial relief for families amid pandemic energy insecurity pressures. There’s a campaign in New York to suspend evictions and foreclosures, with growing political support. A similar call has gone out in New Jersey.
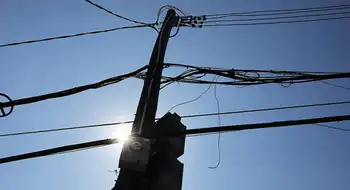
As the weather warms, shut-offs of electric and gas service due to nonpayment tend to pick up. If people are quarantined or out of work due to a widespread economic slowdown, some advocates say they shouldn’t have to worry about having the lights or heat turned off, especially as examples of unpaid utility bills straining cities have emerged elsewhere.
“We recognize that customers may experience financial difficulty as a result of the outbreak, whether they or a family member fall ill, are required to quarantine, or because their income is otherwise affected,” said Michael Jennings, a spokesperson for Public Service Enterprise Group — the parent company of Public Service Electric and Gas Company, New Jersey’s largest utility — in a statement.
The company’s policy will be in place at least through the end of April, as will Atlantic City Electric’s, and other utilities such as PG&E's pandemic response included a similar moratorium during the outbreak.
“Curtailing shut-offs is good public policy to make sure New Jersey residents aren’t left in the lurch as they’re dealing with coronavirus,” said Eric Miller, director of the Natural Resources Defense Council’s New Jersey energy policy program. “Not having a safe place to be because you don't have electricity, gas or water doesn’t do anything to help address the coronavirus.”
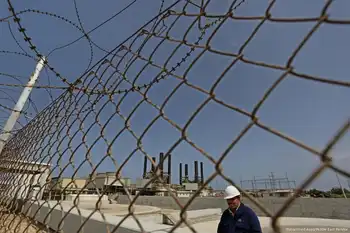
Water service has also drawn attention. Major cities, including Atlanta and Detroit, have suspended shut-offs to ensure residents have water to wash their hands, while Texas utilities waived fees to support customers as well. Seattle suspended water and electric shutoffs.
American Water, which operates in 16 states and has 650,000 customers in New Jersey and 350,000 in New York, has halted any shutoffs amid the coronavirus pandemic and will also restore service, and similarly Hydro One reconnected customers in Canada to maintain access. New York City does not shut off service for nonpayment, but does issue liens against people’s property.
“Everyone, regardless as to what industry, has to have a heightened responsibility that’s encompassed in compassion and take everything into consideration,” New Jersey state Sen. Teresa Ruiz (D-Essex) told POLITICO. “Now is not the time to be worrying about late payments or bills. We need to get past this, hopefully, to see what we’re facing and then deal with other things.”
PSEG Long Island, a subsidiary of PSEG that handles day-to-day operations for the Long Island Power Authority, was the first New York utility to announce it is also suspending shutoffs before the governor’s announcement. The moratorium will remain in place through the end of April.
Rich Berkley, with the Public Utility Law Project, which advocates for low-income customers in New York, said he’s been in touch with state officials to make sure the issue of utility bills is considered during the pandemic. New York already has requirements for utilities to offer deferred payment agreements before shutting off service, he noted.
“The state has to act to protect the most vulnerable households first,” he said. “To the extent that the state is declaring areas of emergency, this should be part of the remedies the state deploys.”
But he noted that not everyone will have trouble paying their utility bills if they’re under quarantine.
“Given the background of a collapsing stock and equity market, all of which matters to the utilities, and shifts in electricity demand during COVID-19, we have to be careful about blanket moratoriums [on shutoffs] in New York,” Berkley said.
Con Edison, the largest utility in the state serving most of New York City, had already informed the Department of Public Service it will suspend all shut-offs in the one-mile radius New Rochelle containment area, spokesperson Michael Clendenin said on Thursday. The moratorium on shutoffs now includes its entire New York City and Westchester County territory.
Avangrid, which owns New York State Electric & Gas and Rochester Gas & Electric, serving broad swathes of upstate New York, will suspend shut-offs due to unpaid bills for 30 days, spokesperson Michael Jamison said.
Related News