Temperatures drop pushing power usage up

By Knoxville News Sentinel


Electrical Testing & Commissioning of Power Systems

Our customized live online or in‑person group training can be delivered to your staff at your location.

  • Live Online
  • 12 hours Instructor-led
  • Group Training Available
Regular Price:
$599
Coupon Price:
$499
Reserve Your Seat Today
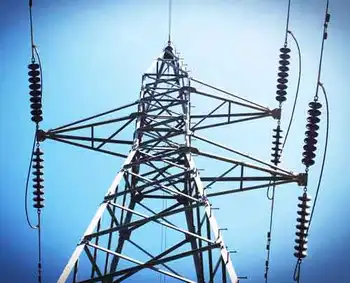
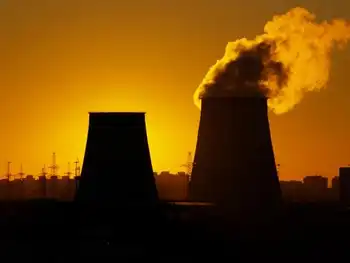
A winter storm that moved through the Knoxville area recently may have canceled school, closed offices and caused other inconveniences, but it did not result in major problems for utilities.

TVA reported December 13 that its peak load in the morning was about 29,900 megawatts at around 8 o'clock. At that time, demand peaked at around 31,400 megawatts during the morning hours.

TVA spokesman Mike Bradley said the average temperature across the federal utility's service area Chattanooga, Huntsville, Knoxville, Memphis, Nashville in the morning was about 18 degrees Fahrenheit.

Bradley described TVA's current power production as stable.

He said the last time winter demand reached 31,000 megawatts was in the first week of January, when peak demand exceeded 31,000 megawatts twice, on January 5 at about 31,100 megawatts and January 6 at about 31,300 megawatts.

According to TVA, the all-time record winter demand was set on January 16, 2009, at 32,572 megawatts when temperatures across the Tennessee Valley region averaged 9 degrees. The all-time record demand on the TVA power system was 33,482 megawatts on August 16, 2007, when temperatures averaged 102 degrees.

KUB spokeswoman Grace McNeilly said the snowfall and cold temperatures have cause few problems for electricity customers.

"We were fortunate," McNeilly said, saying there have been scattered power outages throughout the KUB service area but nothing widespread. "The snow was light and powdery in texture. It was not as wet, which can weigh down power lines and cause outages. Also, the winds, which can cause power outages as well, weren't as high."

According to KUB's website, 397 KUB customers reported a power outage and 377 reported outages December 13. The utility, which serves Knox and parts of seven surrounding counties, has about 200,000 electric customers.

McNeilly said KUB has been making preparations for winter weather and power outages that may occur, including crews to put on standby when a storm occurs, a system to categorize outages to restore power to the largest number of customers in the fastest time, and the use of contracted staff in the event of widespread power outages.

"We'll work to restore as quickly as we can the highest number of power customers as possible," McNeilly said.

Related News

China to build 2,000-MW Lawa hydropower station on Jinsha River

Lawa Hydropower Station approved on the Jinsha River, a Yangtze tributary, delivers 2,000 MW via four units; 784 ft dam, 12 sq mi reservoir, Sichuan-Tibet site, US$4.59b investment, Huadian stake, renewable energy generation.


Key Points

A 2,000 MW dam project on the Jinsha River with four units, a 784 ft barrier, and 8.36 billion kWh annual output.

✅ Sichuan-Tibet junction on the Jinsha River

✅ 2,000 MW capacity; four turbine-generator units

✅ 8.36 bn kWh/yr; US$4.59b total; Huadian 48% stake


China has approved construction of the 2,000-MW Lawa hydropower station, a Yangtze tributary hydropower project on the Jinsha River, multiple news agencies are reporting.

Lawa, at the junction of Sichuan province and the Tibet autonomous region, will feature a 784-foot-high dam and the reservoir will submerge about 12 square miles of land. The Jinsha River is a tributary of the Yangtze River, and the project aligns with green hydrogen development in China.

The National Development and Reform Commission of the People’s Republic of China, which also guides China's nuclear energy development as part of national planning, is reported to have said that four turbine-generator units will be installed, and the project is expected to produce about 8.36 billion kWh of electricity annually.

Total investment in the project is to be US$4.59 billion, and Huadian Group Co. Ltd. will have a 48% stake in the project, reflecting overseas power infrastructure activity, with minority stakes held by provincial firms, according to China Daily.

In other recent news in China, Andritz received an order in December 2018 to supply four 350-MW reversible pump-turbines and motor-generators, alongside progress in compressed air generation technologies, for the 1,400-MW ZhenAn pumped storage plant in Shaanxi province.


Related News

View more

Turning thermal energy into electricity

Near-Field Thermophotovoltaics captures radiated energy across a nanoscale gap, using thin-film photovoltaic cells and indium gallium arsenide to boost power density and efficiency, enabling compact Army portable power from emitters via radiative heat transfer.


Key Points

A nanoscale TPV method capturing near-field photons for higher power density at lower emitter temperatures.

✅ Nanoscale gap boosts radiative transfer and usable photon flux

✅ Thin-film InGaAs cells recycle sub-band-gap photons via reflector

✅ Achieved ~5 kW/m2 power density with higher efficiency


With the addition of sensors and enhanced communication tools, providing lightweight, portable power has become even more challenging, with concepts such as power from falling snow illustrating how diverse new energy-harvesting approaches are. Army-funded research demonstrated a new approach to turning thermal energy into electricity that could provide compact and efficient power for Soldiers on future battlefields.

Hot objects radiate light in the form of photons into their surroundings. The emitted photons can be captured by a photovoltaic cell and converted to useful electric energy. This approach to energy conversion is called far-field thermophotovoltaics, or FF-TPVs, and has been under development for many years; however, it suffers from low power density and therefore requires high operating temperatures of the emitter.

The research, conducted at the University of Michigan and published in Nature Communications, demonstrates a new approach, where the separation between the emitter and the photovoltaic cell is reduced to the nanoscale, enabling much greater power output than what is possible with FF-TPVs for the same emitter temperature.

This approach, which enables capture of energy that is otherwise trapped in the near-field of the emitter is called near-field thermophotovoltaics or NF-TPV and uses custom-built photovoltaic cells and emitter designs ideal for near-field operating conditions, alongside emerging smart solar inverters that help manage conversion and delivery.

This technique exhibited a power density almost an order of magnitude higher than that for the best-reported near-field-TPV systems, while also operating at six-times higher efficiency, paving the way for future near-field-TPV applications, including remote microgrid deployments in extreme environments, according to Dr. Edgar Meyhofer, professor of mechanical engineering, University of Michigan.

"The Army uses large amounts of power during deployments and battlefield operations and must be carried by the Soldier or a weight constrained system," said Dr. Mike Waits, U.S. Army Combat Capabilities Development Command's Army Research Laboratory. "If successful, in the future near-field-TPVs could serve as more compact and higher efficiency power sources for Soldiers as these devices can function at lower operating temperatures than conventional TPVs."

The efficiency of a TPV device is characterized by how much of the total energy transfer between the emitter and the photovoltaic cell is used to excite the electron-hole pairs in the photovoltaic cell, where insights from near-light-speed conduction research help contextualize performance limits in semiconductors. While increasing the temperature of the emitter increases the number of photons above the band-gap of the cell, the number of sub band-gap photons that can heat up the photovoltaic cell need to be minimized.

"This was achieved by fabricating thin-film TPV cells with ultra-flat surfaces, and with a metal back reflector," said Dr. Stephen Forrest, professor of electrical and computer engineering, University of Michigan. "The photons above the band-gap of the cell are efficiently absorbed in the micron-thick semiconductor, while those below the band-gap are reflected back to the silicon emitter and recycled."

The team grew thin-film indium gallium arsenide photovoltaic cells on thick semiconductor substrates, and then peeled off the very thin semiconductor active region of the cell and transferred it to a silicon substrate, informing potential interfaces with home battery systems for distributed use.

All these innovations in device design and experimental approach resulted in a novel near-field TPV system that could complement distributed resources in virtual power plants for resilient operations.

"The team has achieved a record ~5 kW/m2 power output, which is an order of magnitude larger than systems previously reported in the literature," said Dr. Pramod Reddy, professor of mechanical engineering, University of Michigan.

Researchers also performed state-of-the-art theoretical calculations to estimate the performance of the photovoltaic cell at each temperature and gap size, informing hybrid designs with backup fuel cell solutions that extend battery life, and showed good agreement between the experiments and computational predictions.

"This current demonstration meets theoretical predictions of radiative heat transfer at the nanoscale, and directly shows the potential for developing future near-field TPV devices for Army applications in power and energy, communication and sensors," said Dr. Pani Varanasi, program manager, DEVCOM ARL that funded this work.


Related News

View more

Which of the cleaner states imports dirty electricity?

Hourly Electricity Emissions Tracking maps grid balancing areas, embodied emissions, and imports/exports, revealing carbon intensity shifts across PJM, ERCOT, and California ISO, and clarifying renewable energy versus coal impacts on health and climate.


Key Points

An hourly method tracing generation, flows, and embodied emissions to quantify carbon intensity across US balancing areas.

✅ Hourly traces of imports/exports and generation mix

✅ Consumption-based carbon intensity by balancing area

✅ Policy insights for renewables, coal, health costs


In the United States, electricity generation accounts for nearly 30% of our carbon emissions. Some states have responded to that by setting aggressive renewable energy standards; others are hoping to see coal propped up even as its economics get worse. Complicating matters further is the fact that many regional grids are integrated, and as America goes electric the stakes grow, meaning power generated in one location may be exported and used in a different state entirely.

Tracking these electricity exports is critical for understanding how to lower our national carbon emissions. In addition, power from a dirty source like coal has health and environment impacts where it's produced, and the costs of these aren't always paid by the parties using the electricity. Unfortunately, getting reliable figures on how electricity is produced and where it's used is challenging, even for consumers trying to find where their electricity comes from in the first place, leaving some of the best estimates with a time resolution of only a month.

Now, three Stanford researchers—Jacques A. de Chalendar, John Taggart, and Sally M. Benson—have greatly improved on that standard, and they have managed to track power generation and use on an hourly basis. The researchers found that, of the 66 grid balancing areas within the United States, only three have carbon emissions equivalent to our national average, and they have found that imports and exports of electricity have both seasonal and daily changes. de Chalendar et al. discovered that the net results can be substantial, with imported electricity increasing California's emissions/power by 20%.

Hour by hour
To figure out the US energy trading landscape, the researchers obtained 2016 data for grid features called balancing areas. The continental US has 66 of these, providing much better spatial resolution on the data than the larger grid subdivisions. This doesn't cover everything—several balancing areas in Canada and Mexico are tied in to the US grid—and some of these balancing areas are much larger than others. The PJM grid, serving Pennsylvania, New Jersey, and Maryland, for example, is more than twice as large as Texas' ERCOT, in a state that produces and consumes the most electricity in the US.

Despite these limitations, it's possible to get hourly figures on how much electricity was generated, what was used to produce it, and whether it was used locally or exported to another balancing area. Information on the generating sources allowed the researchers to attach an emissions figure to each unit of electricity produced. Coal, for example, produces double the emissions of natural gas, which in turn produces more than an order of magnitude more carbon dioxide than the manufacturing of solar, wind, or hydro facilities. These figures were turned into what the authors call "embodied emissions" that can be traced to where they're eventually used.

Similar figures were also generated for sulfur dioxide and nitrogen oxides. Released by the burning of fossil fuels, these can both influence the global climate and produce local health problems.

Huge variation
The results were striking. "The consumption-based carbon intensity of electricity varies by almost an order of magnitude across the different regions in the US electricity system," the authors conclude. The low is the Bonneville Power grid region, which is largely supplied by hydropower; it has typical emissions below 100kg of carbon dioxide per megawatt-hour. The highest emissions come in the Ohio Valley Electric region, where emissions clear 900kg/MW-hr. Only three regional grids match the overall grid emissions intensity, although that includes the very large PJM (where capacity auction payouts recently fell), ERCOT, and Southern Co balancing areas.

Most of the low-emissions power that's exported comes from the Pacific Northwest's abundant hydropower, while the Rocky Mountains area exports electricity with the highest associated emissions. That leads to some striking asymmetries. Local generation in the hydro-rich Idaho Power Company has embodied emissions of only 71kg/MW-hr, while its imports, coming primarily from Rocky Mountain states, have a carbon content of 625kg/MW-hr.

The reliance on hydropower also makes the asymmetry seasonal. Local generation is highest in the spring as snow melts, but imports become a larger source outside this time of year. As solar and wind can also have pronounced seasonal shifts, similar changes will likely be seen as these become larger contributors to many of these regional grids. Similar things occur daily, as both demand and solar production (and, to a lesser extent, wind) have distinct daily profiles.

The Golden State
California's CISO provides another instructive case. Imports represent less than 30% of its total electric use in 2016, yet California electricity imports provided 40% of its embodied emissions. Some of these, however, come internally from California, provided by the Los Angeles Department of Water and Power. The state itself, however, has only had limited tracking of imported emissions, lumping many of its sources as "other," and has been exporting its energy policies to Western states in ways that shape regional markets.

Overall, the 2016 inventory provides a narrow picture of the US grid, as plenty of trends are rapidly changing our country's emissions profile, including the rise of renewables and the widespread adoption of efficiency measures and other utility trends in 2017 that continue to evolve. The method developed here can, however, allow for annual updates, providing us with a much better picture of trends. That could be quite valuable to track things like how the rapid rise in solar power is altering the daily production of clean power.

More significantly, it provides a basis for more informed policymaking. States that wish to promote low-emissions power can use the information here to either alter the source of their imports or to encourage the sites where they're produced to adopt more renewable power. And those states that are exporting electricity produced primarily through fossil fuels could ensure that the locations where the power is used pay a price that includes the health costs of its production.


Related News

View more

U.S. Electricity Sales Projections Continue to Fall

US Electricity Demand Outlook examines EIA forecasts, GDP decoupling, energy efficiency, electrification, electric vehicles, grid load growth, and weather variability to frame long term demand trends and utility planning scenarios.


Key Points

An analysis of EIA projections showing demand decoupling from GDP, with EV adoption and efficiency shaping future grid load.

✅ EIA lowers load growth; demand decouples from GDP.

✅ Efficiency and sector shifts depress kWh sales.

✅ EV adoption could revive load and capacity needs.


Electricity producers and distributors are in an unusual business. The product they provide is available to all customers instantaneously, literally at the flip of a switch. But the large amount of equipment, both hardware and software to do this takes years to design, site and install.

From a long range planning perspective, just as important as a good engineering design is an accurate sales projections. For the US electric utility industry the most authoritative electricity demand projec-tions come from the Department of Energy’s Energy Information Administration (EIA). EIA's compre-hensive reports combine econometric analysis with judgment calls on social and economic trends like the adoption rate of new technologies that could affect future electricity demand, things like LED light-ing and battery powered cars, and the rise of renewables overtaking coal in generation.

Before the Great Recession almost a decade ago, the EIA projected annual growth in US electricity production at roughly 1.5 percent per year. After the Great Recession began, the EIA lowered its projections of US electricity consumption growth to below 1 percent. Actual growth has been closer to zero. While the EIA did not antici-pate the last recession or its aftermath, we cannot fault them on that.

After the event, though, the EIA also trimmed its estimates of economic growth. For the 2015-2030 period it now predicts 2.1 percent economic and 0.3 percent electricity growth, down from previously projections of 2.7 percent and 1.3 percent respectively. (See Figures 1 and 2.)


Table 1. EIA electric generation projections by year of forecast (kWh billions)


Table 2. EIA forecast of GDP by year of forecast (billion 2009 $)

Back in 2007, the EIA figured that every one percent increase in economic activity required a 0.48 percent in-crease in electric generation to support it. By 2017, the EIA calculated that a 1 percent growth in economic activity now only required a 0.14 percent increase in electric output. What accounts for such a downgrade or disconnect between electricity usage and economic growth? And what factors might turn the numbers 
around?

First, the US economy lost energy intensive heavy industry like smelting, steel mills and refineries; patterns in China's electricity sector highlight how industrial shifts can reshape power demand. A more service oriented economy (think health care) relies more heavily on the movement of data or information and uses far less power than a manufacturing-oriented economy.

A small volcano in Argentina is about to fuel the next tech boom – and a little known company is going to be right at the center. Early investors stand to gain incredible profits and you can too. Read the report.

Second, internet shopping has hurt so-called "brick and mortar" retailers. Despite the departure of heavy industry, in years past a burgeoning US commercial sector increased its demand and usage of electricity to offset the industrial decline. But not anymore. Energy efficiency measures as well as per-haps greater concern about global warming and greenhouse gas emissions and have cut into electricity sales. “Do more with less” has the right ring to it.

But there may be other components to the ongoing decline in electricity usage. Academic studies show that electricity usage seems to increase with income along an S curve, and flattens out after a certain income level. That is, if you earn $1 billion per year you do not (or cannot) use ten times a much electricity as someone earning only $100 million.

But people at typical, middle income levels increase or decrease electricity usage when incomes rise or fall. The squeeze on middle income families was discussed often in the late presidential campaign. In recent decades an increasing percentage of income has gone to a small percentage of the population at the top of the income scale. This trend probably accounts for some weakness in residential sales. This suggests that government policy addressing income inequality would also boost electricity sales.

Population growth affects demand for electricity as well as the economy as a whole. The EIA has made few changes in its projections, showing 0.7 percent per year population growth in 2015- 2030 in both the 2007 and 2017 forecasts. Recent studies, however, have shown a drop in the birth rate to record lows. More troubling, from a national health perspective is that the average age of death may have stopped rising. Those two factors point to lower population growth, especially if the government also restricts immi-gration. Thus, the US may be approaching a period of rather modest population growth.

All of the above factors point to minimal sales growth for electricity producers in the US--perhaps even lower than the seemingly conservative EIA estimates. But the cloud on the horizon has a silver lining in the shape of an electric car. Both the United Kingdom and France have set dates to end of production of automobiles with internal combustion engines. Several European car makers have declared that 20 percent of their output will be electric vehicles by the early 2020s. If we adopt automobiles powered by electricity and not gasoline or diesel, electricity sales would increase by one third. For the power indus-try, electric vehicles represent the next big thing.

We don’t pretend to know how electric car sales will progress. But assume vehicle turnover rates re-main at the current 7 percent per year and electric cars account for 5 percent of sales in the first five years (as op-posed to 1 percent now), 20 percent in the next five years and 50 percent in the third five year period. Wildly optimistic assumptions? Maybe. By 2030, electric cars would constitute 28 percent of the vehicle fleet. They would add about 10 percent to kilowatt hour sales by that date, assuming that battery efficiencies do not improved by then. Those added sales would require increased electric generation output, with low-emissions sources expected to cover almost all the growth globally. They would also raise long term growth rates for 2015-2030 from the present 0.3 percent to 1.0 percent. The slow upturn in demand should give the electric companies time to gear up so to speak.

In the meantime, weather will continue to play a big role in electricity consumption. Record heat-induced demand peaks are being set here in the US even as surging global demand puts power systems under strain worldwide.

Can we discern a pattern in weather conditions 15 years out? Maybe we can, but that is one topic we don’t expect a government agency to tackle in public right now. Meantime, weather will affect sales more than anything else and we cannot predict the weather. Or can we?


Related News

View more

California lawmakers plan to overturn income-based utility charges

California income-based utility charges face bipartisan pushback as the PUC weighs fixed fees for PG&E, SDG&E, and Southern California Edison, reshaping rate design, electricity affordability, energy equity, and privacy amid proposed per-kWh reductions.


Key Points

PUC-approved fixed fees tied to household income for PG&E, SDG&E, and SCE, offset by lower per-kWh rates.

✅ Proposed fixed fees: $51 SCE, $73.31 SDG&E, $50.92 PG&E

✅ Critics warn admin, privacy, legal risks and higher bills for savers

✅ Backers say lower-income pay less; kWh rates cut ~33% in PG&E area


Efforts are being made across California's political landscape to derail a legislative initiative that introduced income-based utility charges for customers of Southern California Edison and other major utilities.

Legislators from both the Democratic and Republican parties have proposed bills aimed at nullifying the 2022 legislation that established a sliding scale for utility charges based on customer income, a decision made in a late-hour session and subsequently endorsed by Governor Gavin Newsom.

The plan, pending final approval from the state Public Utilities Commission (PUC) — all of whose current members were appointed by Governor Newsom — would enable utilities like Southern California Edison, San Diego Gas & Electric, and PG&E to apply new income-based charges as early as this July.

Among the state legislators pushing back against the income-based charge scheme are Democrats Jacqui Irwin and Marc Berman, along with Republicans Janet Nguyen, Kelly Seyarto, Rosilicie Ochoa Bogh, Scott Wilk, Brian Dahle, Shannon Grove, and Roger Niello.

A cadre of specialists, including economist Ahmad Faruqui who has advised all three utilities implicated in the fee proposal, have outlined several concerns regarding the PUC's pending decision.

Faruqui and his colleagues argue that the proposed charges are excessively high in comparison to national standards, reflecting soaring electricity prices across the state, potentially leading to administrative challenges, legal disputes, and negative unintended outcomes, such as penalizing energy-conservative consumers.

Advocates for the income-based fee model, including The Utility Reform Network (TURN) and the National Resources Defense Council, argue it would result in higher charges for wealthier consumers and reduced fees for those with lower incomes. They also believe that the utilities plan to decrease per kilowatt-hour rates as part of a broader rate structure review to balance out the new fees.

However, even supporters like TURN and the Natural Resources Defense Council acknowledge that the income-based fee model is not a comprehensive solution to making soaring electricity bills more affordable.

If implemented, California would have the highest income-based utility fees in the country, with averages far surpassing the national average of $11.15, as reported by EQ Research:

  • Southern California Edison would charge $51.
  • San Diego Gas & Electric would levy $73.31.
  • PG&E would set fees at $50.92.

The proposal has raised concerns among state legislators about the additional financial burden on Californians already struggling with high electricity costs.

Critics highlight several practical challenges, including the PUC's task of assessing customers' income levels, a process fraught with privacy concerns, potential errors, and constitutional questions regarding access to tax information.

Economists have pointed out further complications, such as the difficulty in accurately assessing incomes for out-of-state property owners and the variability of customers' incomes over time.

The proposed income-based charges would differ by income bracket within the PG&E service area, for example, with lower-income households facing lower fixed charges and higher-income households facing higher charges, alongside a proposed 33% reduction in electricity rates to help mitigate the fixed charge impact.

Yet, the economists warn that most customers, particularly low-usage customers, could end up paying more, essentially rewarding higher consumption and penalizing efficiency.

This legislative approach, they caution, could inadvertently increase costs for moderate users across all income brackets, a sign of major changes to electric bills that could emerge, challenging the very goals it aims to achieve by promoting energy inefficiency.


Related News

View more

Duke Energy Florida to build its largest battery storage projects yet

Duke Energy Florida battery storage will add 22 MW across Trenton, Cape San Blas and Jennings, improving grid reliability, outage resilience, enabling peak shaving and deferring distribution upgrades to increase efficiency and customer value.


Key Points

Three lithium battery projects totaling 22 MW to improve Florida grid reliability, outage resilience and efficiency.

✅ 22 MW across Trenton, Cape San Blas and Jennings sites

✅ Enhances outage resilience and grid reliability

✅ Defers costly distribution upgrades and improves efficiency


Duke Energy Florida (DEF) has announced three battery energy storage projects, totaling 22 megawatts, that will improve overall reliability and support critical services during power outages.

Duke Energy, the nation's largest electric utility, unveils its new logo. (PRNewsFoto/Duke Energy) (PRNewsfoto/Duke Energy)

Collectively, the storage facilities will enhance grid operations, increase efficiencies and improve overall reliability for surrounding communities, with virtual power plant programs offering a model for coordinating distributed resources.

They will also provide important backup generation during power outages, a service that is becoming increasingly important with the number and intensity of storms that have recently impacted the state.

As the grid manager and operator, DEF can maximize the versatility of battery energy storage systems (BESS) to include multiple customer and electric system benefits such as balancing energy demand, managing intermittent resources, increasing energy security and deferring traditional power grid upgrades.

These benefits help reduce costs for customers and increase operational efficiencies.

The 11-megawatt (MW) Trenton lithium-based battery facility will be located 30 miles west of Gainesville in Gilchrist County. The energy storage project will continue to improve power reliability using newer technologies.

The 5.5-MW Cape San Blas lithium-based battery facility will be located approximately 40 miles southeast of Panama City in Gulf County. The project will provide additional power capacity to meet our customers' rising energy demand in the area. This project is an economical alternative to replacing distribution equipment necessary to accommodate local load growth.

The 5.5-MW Jennings lithium-based battery facility will be located 1.5 miles south of the Florida-Georgia border in Hamilton County. The project will continue to improve power reliability through energy storage as an alternative solution to installing new and more costly distribution equipment.

Currently the company plans to complete all three projects by the end of 2020.

"These battery projects provide electric system benefits that will help improve local reliability for our customers and provide significant energy services to the power grid," said Catherine Stempien, Duke Energy Florida state president. "Duke Energy Florida will continue to identify opportunities in battery storage technology which will deliver efficiency improvements to our customers."


Additional renewables projects

As part of DEF's commitment to renewables, the company is investing an estimated $1 billion to construct or acquire a total of 700 MW of cost-effective solar power facilities and 50 MW of battery storage through 2022.

Duke Energy is leading the industry deployment of battery technology, with SDG&E's Emerald Storage project underscoring broader adoption across the sector today. Last fall, the company and University of South Florida St. Petersburg unveiled a Tesla battery storage system that is connected to a 100-kilowatt (kW) solar array – the first of its kind in Florida.

This solar-battery microgrid system manages the energy captured by the solar array, situated on top of the university's parking garage, and similar low-income housing microgrid financing efforts are expanding access. The solar array was constructed three years ago through a $1 million grant from Duke Energy. The microgrid provides a backup power source during a power outage for the parking garage elevator, lights and electric vehicle charging stations. Click here to learn more.

In addition to expanding its battery storage technology and solar investments, DEF is investing in transportation electrification to support the growing U.S. adoption of electric vehicles (EV), including EV charging infrastructure, 530 EV charging stations and a modernized power grid to deliver the diverse and reliable energy solutions customers want and need.


Related News

View more

Sign Up for Electricity Forum’s Newsletter

Stay informed with our FREE Newsletter — get the latest news, breakthrough technologies, and expert insights, delivered straight to your inbox.

Electricity Today T&D Magazine Subscribe for FREE

Stay informed with the latest T&D policies and technologies.
  • Timely insights from industry experts
  • Practical solutions T&D engineers
  • Free access to every issue

Live Online & In-person Group Training

Advantages To Instructor-Led Training – Instructor-Led Course, Customized Training, Multiple Locations, Economical, CEU Credits, Course Discounts.

Request For Quotation

Whether you would prefer Live Online or In-Person instruction, our electrical training courses can be tailored to meet your company's specific requirements and delivered to your employees in one location or at various locations.