Japan May Expand Deregulation
TOKYO -- - An advisory panel to the industry minister called for deregulating retail power rates for small- and mid-scale commercial electricity users in fiscal 2004, ministry officials said.=
The proposed deregulation by a subcommittee of the Advisory Committee for Natural Resources and Energy will affect 60 per cent of total demand for electricity.
Currently, power rates for large-lot commercial users of 2,000 kilowatts or more are decontrolled. Demand from these users, such as big manufacturing plants and office buildings, accounts for nearly 30% of total power demand.
The subcommittee urged allowing electric power companies to set retail prices themselves for users of more than 50 kilowatts but less than 2,000 kilowatts.
The Ministry of Economy, Trade and Industry plans to adopt a schedule for deregulating power rates for such users later this month and submit legislation for necessary legal revisions to the ordinary Diet session to be convened in January.
To promote competition, the ministry will seek to create a nationwide wholesale market and a neutral body that will work out trading rules, monitor whether the rules are followed, and settle disputes.
Regarding deregulation for households and other power users of less than 50 kilowatts, the ministry is as yet unlikely to make a clear schedule.
Related News
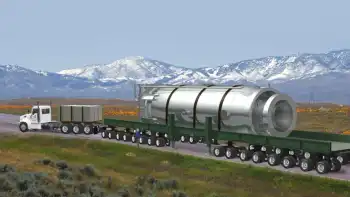
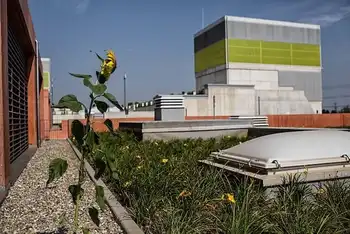
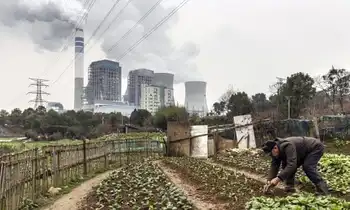
Modular nuclear reactors a 'long shot' worth studying, says Yukon gov't
WHITEHORSE - Yukon SMR Feasibility Study examines small modular reactors as low-emissions nuclear power for Yukon's grid and remote communities, comparing costs, safety, waste, and reliability with diesel generation, renewables, and energy efficiency.
Key Points
An official assessment of small modular reactors as low-emission power options for Yukon's grid and remote sites.
✅ Compares SMR costs vs diesel, hydro, wind, and solar
✅ Evaluates safety, waste, fuel logistics, decommissioning
✅ Considers remote community loads and grid integration
The Yukon government is looking for ways to reduce the territory's emissions, and wondering if nuclear power is one way to…