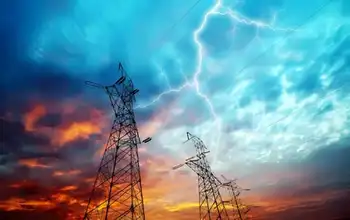
Hidden Hydro Charges Galloping Our Way
TORONTO -- - Hidden hydro charges called rate riders will be galloping into every home and small business in Ontario thanks to the privatization and deregulation monster of the Conservative government, NDP Leader Howard Hampton says.
"This government continues to rob our pocketbooks to pay for the hydro folly it created," Hampton said. "When will they figure out that the only sensible course is a not-for-profit public power system."
The government's Bill 210 contains a clause allowing municipal utilities to impose 'rate riders,' extra charges to consumers to pay the estimated $500 million in deregulation administrative costs of local utilities. The rate riders would apply as soon as hydro rate caps are lifted.
"Neither consumers nor utilities should be saddled with these costs. They should be recovered from the profits of Ontario Power Generation or Hydro One," Hampton said.
The Bill also allows utilities to recover the cost of issuing the $75 rebate cheques. Again, the moment the caps come off, utilities can add those charges to hydro bills, but only if they mail out the cheques by the end of 2002.
"The Conservatives created this hydro fiasco and now want the innocent victims to pay for it. That's unacceptable," Hampton said.
Related News
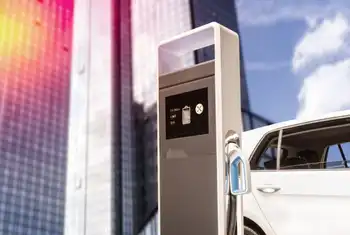
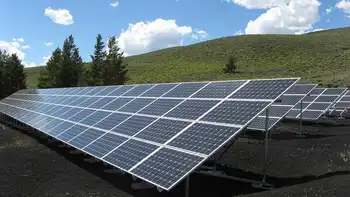
How vehicle-to-building charging can save costs, reduce GHGs and help balance the grid: study
OTTAWA - Ontario EV Battery Storage ROI leverages V2B, V2G, two-way charging, demand response, and second-life batteries to monetize peak pricing, cut GHG emissions, and unlock up to $38,000 in lifetime value for commuters and buildings.
Key Points
The economic return from V2B/V2G two-way charging and second-life storage using EV batteries within Ontario's grid.
✅ Monetize peak pricing via workplace V2B discharging
✅ Earn up to $8,400 per EV over vehicle life
✅ Reduce gas generation and GHGs with demand response
The payback that usually comes to mind when people buy an electric vehicle is to drive an…