India Electricity Production 2017 surged to 1,160 BU, ranking third globally; rising TWh output with 334 GW capacity, strong renewables and thermal mix, 7% CAGR in generation, and growing demand, investments, and FDI inflows.
Key Points
India's 2017 power output reached 1,160 BU, third globally, supported by 334 GW capacity, rising renewables, and 7% CAGR.
✅ 1,160 BU generated; third after China and the US
✅ Installed capacity 334 GW; 65% thermal, rising renewables
✅ Generation CAGR ~7%; demand, FDI, investments rising
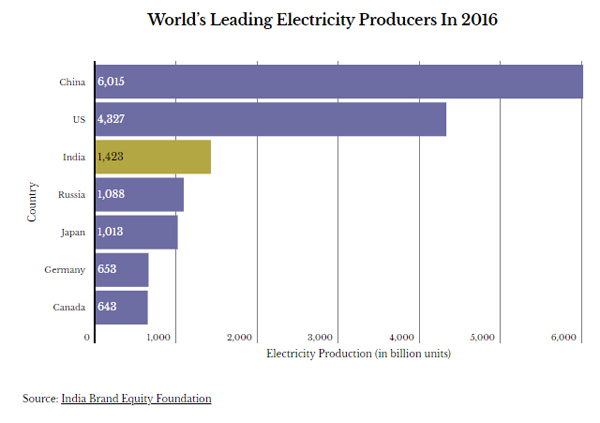
India now generates around 1,160.1 billion units of electricity in financial year 2017, up 4.72% from the previous year, and amid surging global electricity demand that is straining power systems. The country is behind only China which produced 6,015 terrawatt hours (TWh. 1 TW = 1,000,000 megawatts) and the US (4,327 TWh), and is ahead of Russia, Japan, Germany, and Canada.
India’s electricity production grew 34% over seven years to 2017, and the country now produces more energy than Japan and Russia, which had 27% and 8.77% more electricity generation capacity installed, respectively, than India seven years ago.
India produced 1,160.10 billion units (BU) of electricity–one BU is enough to power 10 million households (one household using average of about 3 units per day) for a month–in financial year (FY) 2017. Electricity production stood at 1,003.525 BU between April 2017-January 2018, according to a February 2018 report by India Brand Equity Foundation (IBEF), a trust established by the commerce ministry.
#google#
With a production of 1,423 BU in FY 2016, India was the third largest producer and the third largest consumer of electricity in the world, behind China (6,015 BU) and the United States (4,327 BU).
With an annual growth rate of 22.6% capacity addition over a decade to FY 2017, renewables beat other power sources–thermal, hydro and nuclear. Renewables, however, made up only 18.79% of India’s energy, up 68.65% since 2007, and globally, low-emissions sources are expected to cover most demand growth in the coming years. About 65% of installed capacity continues to be thermal.
As of January 2018, India has installed power capacity of 334.4 gigawatt (GW), making it the fifth largest installed capacity in the world after European Union, China, United States and Japan, and with much of the fleet coal-based, imported coal volumes have risen at times amid domestic supply constraints.
The government is targeting capacity addition of around 100 GW–the current power production of United Kingdom–by 2022, as per the IBEF report.
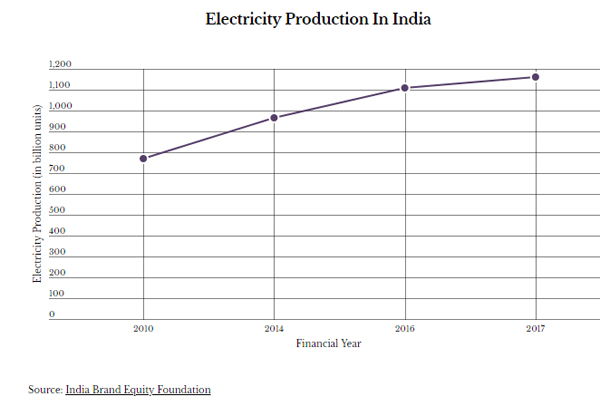
Electricity generation grew at 7% annually
India achieved a 34.48% growth in electricity production by producing 1,160.10 BU in 2017 compared to 771.60 BU in 2010–meaning that in these seven years, electricity production in India grew at a compound annual growth rate (CAGR) of 7.03%, while thermal power plants' PLF has risen recently amid higher demand and lower hydro.
Generation capacity grew at 10% annually
Of 334.5 GW installed capacity as of January 2018–up 60% from 132.30 GW in 2007–thermal installed capacity was 219.81 GW. Hydro and renewable energy installed capacity totaled 44.96 GW and 62.85 GW, respectively, said the report.
The CAGR in installed capacity over a decade to 2017 was 10.57% for thermal power, 22.06% for renewable energy–the fastest among all sources of power–2.51% for hydro power and 5.68% for nuclear power.
Growing demand, higher investments will drive future growth
Growing population and increasing penetration of electricity connections, along with increasing per-capita usage would provide further impetus to the power sector, said the report.
Power consumption is estimated to increase from 1,160.1 BU in 2016 to 1,894.7 BU in 2022, as per the report, though electricity demand fell sharply in one recent period.
Increasing investment remained one of the driving factors of power sector growth in the country.
Power sector has a 100% foreign direct investment (FDI) permit, which boosted FDI inflows in the sector.
Total FDI inflows in the power sector reached $12.97 billion (Rs 83,713 crore) during April 2000 to December 2017, accounting for 3.52% of FDI inflows in India, the report said.
Related News