PG&E dividend halt for wildfire mitigation directs cash from shareholders to tree clearing, wildfire risk reduction, and probation compliance under Judge William Alsup, amid bankruptcy, Camp Fire liabilities, and power line vegetation management mandates.
Key Points
A court-ordered dividend halt funding vegetation clearance and wildfire mitigation as PG&E meets probation terms.
✅ Judge Alsup bars dividends until mitigation targets met
✅ 375,000 trees cleared near power lines in high-risk zones
✅ Measures tied to probation amid bankruptcy and liabilities
A U.S. judge said on Tuesday that PG&E may not resume paying dividends and must use the money to fund its plan for cutting down trees to reduce the risk of wildfires in California, stopping short of more costly measures he proposed earlier this year.
The new criminal probation terms for PG&E are modest compared with ones the judge had in mind in January and that PG&E said could have cost upwards of $150 billion.
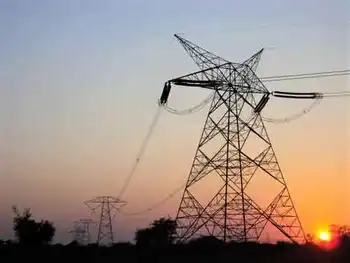
The terms will, however, keep PG&E under the supervision of Judge William Alsup of the U.S. District Court for the Northern District of California and hold the company, which also is in Chapter 11 bankruptcy and whose bankruptcy plan has drawn support from wildfire victims, to its target for clearing areas around its power lines of some 375,000 trees this year.
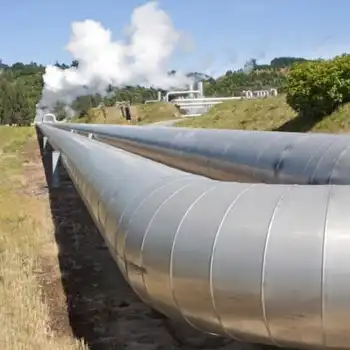
PG&E's probation stems from its felony conviction after a deadly 2010 natural gas pipeline blast in San Bruno, California, near San Francisco, that killed eight people and injured 58 others.
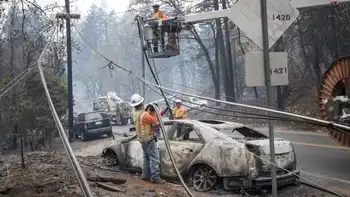
PG&E filed for bankruptcy protection on Jan. 29 in anticipation of liabilities from wildfires, including a catastrophic 2018 blaze, the Camp Fire, for which PG&E later pleaded guilty to 85 counts in state court. It killed 86 people in the deadliest and most destructive wildfire in California history.
At a January hearing, Alsup, who is overseeing PG&E's probation, said he felt compelled to propose additional probation terms in the aftermath of Camp Fire. San Francisco-based PG&E expects its equipment will be found to have caused the blaze.
The probation process is separate from San Francisco-based PG&E's bankruptcy filing and from operational measures such as its pandemic response and shutoff moratorium implemented to protect customers.
As the company faces $30 billion in wildfire liabilities and bankruptcy proceedings and has opened a wildfire assistance program for affected residents, the energy company is expected to name as its new chief executive Bill Johnson, a source said on Tuesday. Johnson has been the CEO of the Tennessee Valley Authority since 2013 and is retiring on Friday.
Additional probation terms imposed by Alsup on Tuesday will require PG&E to meet goals in a wildfire mitigation plan it unveiled in February.
The goals include removing 375,000 dead, dying or hazardous trees from areas at high risk of wildfires in 2019, compared with 160,000 last year.
The judge said PG&E will not be able to pay shareholders until it complies with his new probation terms.
Shares fell 2% on Tuesday to close at $17.66 on the New York Stock Exchange and are down 63% since November 2018 due to concerns about the company's bankruptcy and wildfire liabilities, though the utility has said rates are set to stabilize in 2025 as part of its long-term plan. The shares traded as low as $5.07 in January.
PG&E in December 2017 suspended its quarterly cash dividend, while continuing to pay significant property taxes to California counties, citing uncertainty about liabilities from wildfires in October of that year that struck Northern California.
PG&E paid $798 million in dividends in 2017 and $925 million in 2016, a period in which the company did a poor job of clearing areas around its power lines of hazardous trees, according to Alsup.
Money meant for shareholders should have been spent on efforts to reduce wildfire risks in recent years, Alsup said at Tuesday's hearing.
"PG&E has started way more than its share of these fires," Alsup said.
"I want to see the people of California safe," the judge added.
Lawyers for PG&E did not contest the new terms, which the company considers more feasible than terms Alsup proposed in January.
To comply with the terms Alsup proposed in January, PG&E said it would have to remove 100 million trees. The company added that shutting power lines during high winds as Alsup proposed would not be feasible because the lines traverse rural areas to service cities and suburbs.
Idling lines could also affect the power grid in other states, PG&E said.
Alsup on Tuesday said he was still considering his proposal to require PG&E to shut down power lines during windy weather to prevent tree branches from making contact and sparking wildfires linked to power lines in the region.
Related News