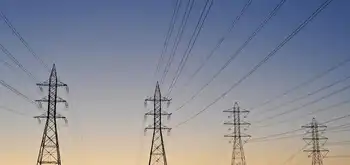
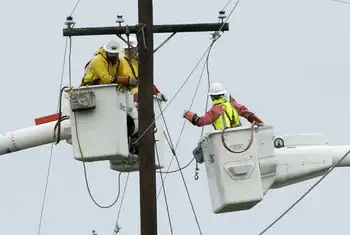
Loss of wind causes Texas power grid emergency

By Reuters


Protective Relay Training - Basic

Our customized live online or in‑person group training can be delivered to your staff at your location.

  • Live Online
  • 12 hours Instructor-led
  • Group Training Available
Regular Price:
$699
Coupon Price:
$599
Reserve Your Seat Today
A drop in wind generation late on February 26, coupled with colder weather, triggered an electric emergency that caused the Texas grid operator to cut service to some large customers, the grid agency said.

Electric Reliability Council of Texas (ERCOT) said a decline in wind energy production in west Texas occurred at the same time evening electric demand was building as colder temperatures moved into the state.

The grid operator went directly to the second stage of an emergency plan at 6:41 PM CST (0041 GMT), ERCOT said in a statement.

System operators curtailed power to interruptible customers to shave 1,100 megawatts of demand within 10 minutes, ERCOT said. Interruptible customers are generally large industrial customers who are paid to reduce power use when emergencies occur.

No other customers lost power during the emergency, ERCOT said. Interruptible customers were restored in about 90 minutes and the emergency was over in three hours.

ERCOT said the grid's frequency dropped suddenly when wind production fell from more than 1,700 megawatts, before the event, to 300 MW when the emergency was declared.

In addition, ERCOT said multiple power suppliers fell below the amount of power they were scheduled to produce on February 26. That, coupled with the loss of wind generated in West Texas, created problems moving power to the west from North Texas.

ERCOT declares a stage 1 emergency when power reserves fall below 2,300 MW. A stage 2 emergency is called when reserves fall below 1,750 MW.

At the time of the emergency, ERCOT demand increased from 31,200 MW to a peak of 35,612 MW, about half the total generating capacity in the region, according to the agency's Web site.

Texas produces the most wind power of any state and the number of wind farms is expected to increase dramatically as new transmission lines are built to transfer power from the western half of the state to more populated areas in the north.

Earlier on Feb. 26, grid problems led to a blackout in Florida that cut power to about 1 million electric customers across that state for as much as four hours.

Related News

A New Era for Churchill Falls: Newfoundland and Labrador Secures Billions in Landmark Deal with Quebec

Churchill Falls NL-Quebec Agreement boosts hydropower revenues, revises power purchase pricing, expands transmission lines, and integrates Indigenous rights, enabling renewable energy growth, domestic supply, exports, and interprovincial collaboration on infrastructure and utility modernization.


Key Points

A renegotiated hydropower deal reallocating power and advancing projects with Indigenous benefits in NL and Quebec.

✅ Raises Hydro-Quebec price for Churchill Falls electricity

✅ Increases NL power share for domestic use and exports

✅ Commits joint projects and Indigenous participation safeguards


St. John's, Newfoundland and Labrador - In a historic development, Newfoundland and Labrador (NL) and Quebec have reached a tentative agreement over the controversial Churchill Falls hydroelectric project, amid Quebec's electricity ambitions and longstanding regional sensitivities, potentially unlocking hundreds of billions of dollars for the Atlantic province. The deal, announced jointly by Premier Andrew Furey and Quebec Premier François Legault, aims to rectify the decades-long imbalance in the original 1969 contract, which saw NL receive significantly less revenue than Quebec for the province's vast hydropower resources.

The core of the new agreement involves a substantial increase in the price that Hydro-Québec pays for electricity generated at Churchill Falls. This price hike, retroactive to January 1, 2025, is expected to generate billions in additional revenue for NL over the next several decades. The deal also includes provisions for:

  • Increased power allocation for NL: The province will gain a larger share of the electricity generated at Churchill Falls, allowing for increased domestic consumption and potential export opportunities through the sale and trade of power across regional markets.
  • Joint infrastructure development: Both provinces will collaborate on new energy projects, in line with Hydro-Québec's $185-billion plan to reduce fossil fuel reliance, including potential expansions to the Churchill Falls generating station and the development of new transmission lines.
  • Indigenous involvement: The agreement acknowledges the importance of Indigenous rights and seeks to ensure that Indigenous communities in both provinces benefit from the project.

This landmark deal represents a significant victory for NL, which has long argued that the original 1969 contract was grossly unfair. The province has been seeking to renegotiate the terms of the agreement for decades, citing the low price paid for electricity and the significant economic benefits that have accrued to Quebec.

Key Implications:

  • Economic Transformation: The influx of revenue from the new Churchill Falls agreement has the potential to significantly transform the economy of NL, though the legacy of Muskrat Falls costs tempers expectations before plans are finalized. The province can invest in critical infrastructure projects, such as healthcare, education, and transportation, as well as support economic diversification initiatives.
  • Energy Independence: The increased access to electricity will enhance NL's energy security and reduce its reliance on fossil fuels. This shift towards renewable energy aligns with the province's climate change goals, and in the context of Quebec's no-nuclear stance could attract new investment in sustainable industries.
  • Interprovincial Relations: The successful negotiation of this complex agreement demonstrates the potential for constructive collaboration between provinces on major infrastructure projects, as seen in recent NB Power-Hydro-Québec agreements to import more electricity. It sets a precedent for future interprovincial partnerships on issues of shared interest.

Challenges and Considerations:

  • Implementation: The successful implementation of the agreement will require careful planning and coordination between the two provinces.
  • Environmental Impact: The expansion of hydroelectric generation at Churchill Falls must be carefully assessed for its potential environmental impacts, including the effects on local ecosystems and Indigenous communities.
  • Public Consultation: It is crucial that the governments of NL and Quebec engage in meaningful public consultation throughout the implementation process to ensure that the benefits of the agreement are shared equitably across both provinces.

The Churchill Falls agreement marks a turning point in the history of energy development in Canada. It demonstrates the potential for provinces to work together to achieve mutually beneficial outcomes, even as Nova Scotia shifts toward wind and solar after stepping back from the Atlantic Loop, while also addressing historical inequities and ensuring a more equitable distribution of the benefits of natural resources.


Related News

View more

Pandemic causes drop in electricity demand across the province: Manitoba Hydro

Manitoba Electricity Demand Drop reflects COVID-19 effects, lowering peak demand about 6% as businesses and offices close, impacting the regional grid; recession-like patterns emerge while Winnipeg water consumption stays steady and peak usage shifts later.


Key Points

An observed 6% decline in Manitoba peak electricity during COVID-19 due to closures; Winnipeg water use remains steady.

✅ Daily peak load down roughly 6% provincewide

✅ Business and office shutdowns drive lower consumption

✅ Winnipeg peak water time shifts to 9 a.m., volume steady


The COVID-19 pandemic has caused a drop in the electricity demand across the province, according to Manitoba Hydro, mirroring the Ontario electricity usage decline reported elsewhere in Canada.

On Tuesday, Manitoba Hydro said it has tracked overall electrical use, which includes houses, farms and businesses both large and small, while also cautioning customers about pandemic-related scam calls in recent weeks.

Hydro said it has seen about a six per cent reduction in the daily peak electricity demand, adding this is due to the many businesses and downtown offices which are temporarily closed, even as residential electricity use has increased in many regions.


"Currently, the impact on Manitoba electricity demand appears to be consistent with what we saw during the 2008 recession," Bruce Owen, the media relations officer for Manitoba Hydro, noting a similar Ottawa demand decline during the pandemic, said in an email to CTV News.

Owen added this trend of reduced electricity demand is being seen across North America, with BC Hydro pandemic load patterns reported and the regional grid in the American Midwest – an area where Manitoba Hydro is a member.

While electricity demand is down, BC Hydro expects holiday usage to rise and water usage in Winnipeg has remained the same.

The City of Winnipeg said it has not seen any change in overall water consumption, but as Hydro One kept peak rates in Ontario, peak demand times have moved from 7 – 8 a.m. to 9 a.m.


Related News

View more

Was there another reason for electricity shutdowns in California?

PG&E Wind Shutdown and Renewable Reliability examines PSPS strategy, wildfire risk, transmission line exposure, wind turbine cut-out speeds, grid stability, and California's energy mix amid historic high-wind events and supply constraints across service areas.


Key Points

An overview of PG&E's PSPS decisions, wildfire mitigation, and how wind cut-out limits influence grid reliability.

✅ Wind turbines reach cut-out near 55 mph, reducing generation.

✅ PSPS mitigates ignition from damaged transmission infrastructure.

✅ Baseload diversity improves resilience during high-wind events.


According to the official, widely reported story, Pacific Gas & Electric (PG&E) initiated power shutoffs across substantial portions of its electric transmission system in northern California as a precautionary measure.

Citing high wind speeds they described as “historic,” the utility claims that if it didn’t turn off the grid, wind-caused damage to its infrastructure could start more wildfires.

Perhaps that’s true. Perhaps. This tale presumes that the folks who designed and maintain PG&E’s transmission system are unaware of or ignored the need to design it to withstand severe weather events, and that the Federal Energy Regulatory Commission (FERC) and North American Electric Reliability Corp. (NERC) allowed the utility to do so.

Ignorance and incompetence happens, to be sure, but there’s much about this story that doesn’t smell right—and it’s disappointing that most journalists and elected officials are apparently accepting it without question.

Take, for example, this statement from a Fox News story about the Kincade Fires: “A PG&E meteorologist said it’s ‘likely that many trees will fall, branches will break,’ which could damage utility infrastructure and start a fire.”

Did you ever notice how utilities cut wide swaths of trees away when transmission lines pass through forests? There’s a reason for that: When trees fall and branches break, the grid can still function, and even as the electric rhythms of New York City shifted during COVID-19, operators planned for variability.

So, if badly designed and poorly maintained infrastructure isn’t the reason PG&E cut power to millions of Californians, what might have prompted them to do so? Could it be that PG&E’s heavy reliance on renewable energy means they don’t have the power to send when a “historic” weather event occurs, especially as policymakers weigh the postponed closure of three power plants elsewhere in California?


Wind Speed Limits

The two most popular forms of renewable energy come with operating limitations, which is why some energy leaders urge us to keep electricity options open when planning the grid. With solar power, the constraint is obvious: the availability of sunlight. One doesn’t generate solar power at night and energy generation drops off with increasing degrees of cloud cover during the day.

The main operating constraint of wind power is, of course, wind speed, and even in markets undergoing 'transformative change' in wind generation, operators adhere to these technical limits. At the low end of the scale, you need about a 6 or 7 miles-per-hour wind to get a turbine moving. This is called the “cut-in speed.” To generate maximum power, about a 30 mph wind is typically required. But, if the wind speed is too high, the wind turbine will shut down. This is called the “cut-out speed,” and it’s about 55 miles per hour for most modern wind turbines.

It may seem odd that wind turbines have a cut-out speed, but there’s a very good reason for it. Each wind turbine rotor is connected to an electric generator housed in the turbine nacelle. The connection is made through a gearbox that is sized to turn the generator at the precise speed required to produce 60 Hertz AC power.

The blades of the wind turbine are airfoils, just like the wings of an airplane. Adjusting the pitch (angle) of the blades allows the rotor to maintain constant speed, which, in turn, allows the generator to maintain the constant speed it needs to safely deliver power to the grid. However, there’s a limit to blade pitch adjustment. When the wind is blowing so hard that pitch adjustment is no longer possible, the turbine shuts down. That’s the cut-out speed.

Now consider how California’s power generation profile has changed. According to Energy Information Administration data, the state generated 74.3 percent of its electricity from traditional sources—fossil fuels and nuclear, amid debates over whether to classify nuclear as renewable—in 2001. Hydroelectric, geothermal, and biomass-generated power accounted for most of the remaining 25.7 percent, with wind and solar providing only 1.98 percent of the total.

By 2018, the state’s renewable portfolio had jumped to 43.8 percent of total generation, with clean power increasing and wind and solar now accounting for 17.9 percent of total generation. That’s a lot of power to depend on from inherently unreliable sources. Thus, it wouldn’t be at all surprising to learn that PG&E didn’t stop delivering power out of fear of starting fires, but because it knew it wouldn’t have power to deliver once high winds shut down all those wind turbines


Related News

View more

UK low-carbon electricity generation stalls in 2019

UK low-carbon electricity 2019 saw stalled growth as renewables rose slightly, wind expanded, nuclear output fell, coal hit record lows, and net-zero targets demand faster deployment to cut CO2 intensity below 100gCO2/kWh.


Key Points

Low-carbon sources supplied 54% of UK power in 2019, up just 1TWh; wind grew, nuclear fell, and coal dropped to 2%.

✅ Wind up 8TWh; nuclear down 9TWh amid outages

✅ Fossil fuels 43% of generation; coal at 2%

✅ Net-zero needs 15TWh per year added to 2030


The amount of electricity generated by low-carbon sources in the UK stalled in 2019, Carbon Brief analysis shows.

Low-carbon electricity output from wind, solar, nuclear, hydro and biomass rose by just 1 terawatt hour (TWh, less than 1%) in 2019. It represents the smallest annual increase in a decade, where annual growth averaged 9TWh. This growth will need to double in the 2020s to meet UK climate targets while replacing old nuclear plants as they retire.

Some 54% of UK electricity generation in 2019 came from low-carbon sources, including 37% from renewables and 20% from wind alone, underscoring wind's leading role in the power mix during key periods. A record-low 43% was from fossil fuels, with 41% from gas and just 2% from coal, also a record low. In 2010, fossil fuels generated 75% of the total.

Carbon Brief’s analysis of UK electricity generation in 2019 is based on figures from BM Reports and the Department for Business, Energy and Industrial Strategy (BEIS). See the methodology at the end for more on how the analysis was conducted.

The numbers differ from those published earlier in January by National Grid, which were for electricity supplied in Great Britain only (England, Wales and Scotland, but excluding Northern Ireland), including via imports from other countries.

Low-carbon low
In 2019, the UK became the first major economy to target net-zero greenhouse gas emissions by 2050, increasing the ambition of its legally binding Climate Change Act.

To date, the country has cut its emissions by around two-fifths since 1990, with almost all of its recent progress coming from the electricity sector.

Emissions from electricity generation have fallen rapidly in the decade since 2010 as coal power has been almost phased out and even gas output has declined. Fossil fuels have been displaced by falling demand and by renewables, such as wind, solar and biomass.

But Carbon Brief’s annual analysis of UK electricity generation shows progress stalled in 2019, with the output from low-carbon sources barely increasing compared to a year earlier.

The chart below shows low-carbon generation in each year since 2010 (grey bars) and the estimated level in 2019 (red). The pale grey bars show the estimated future output of existing low-carbon sources after old nuclear plants retire and the pale red bars show the amount of new generation needed to keep electricity sector emissions to less than 100 grammes of CO2 per kilowatt hour (gCO2/kWh), the UK’s nominal target for the sector.

 Annual electricity generation in the UK by fuel, terawatt hours, 2010-2019. Top panel: fuel by fuel. Bottom panel: cumulative total generation from all sources. Source: BEIS energy trends, BM Reports and Carbon Brief analysis. Chart by Carbon Brief using Highcharts.
As the chart shows, the UK will require significantly more low-carbon electricity over the next decade as part of meeting its legally binding climate goals.

The nominal 100gCO2/kWh target for 2030 was set in the context of the UK’s less ambitious goal of cutting emissions to 80% below 1990 levels by 2050. Now that the country is aiming to cut emissions to net-zero by 2050, that 100gCO2/kWh indicator is likely to be the bare minimum.

Even so, it would require a rapid step up in the pace of low-carbon expansion, compared to the increases seen over the past decade. On average, low-carbon generation has risen by 9TWh each year in the decade since 2010 – including a rise of just 1TWh in 2019.

Given scheduled nuclear retirements and rising demand expected by the Committee on Climate Change (CCC) – with some electrification of transport and heating – low-carbon generation would need to increase by 15TWh each year until 2030, just to meet the benchmark of 100gCO2/kWh.

For context, the 3.2 gigawatt (GW) Hinkley C new nuclear plant being built in Somerset will generate around 25TWh once completed around 2026. The world’s largest offshore windfarm, the 1.2GW Hornsea One scheme off the Yorkshire coast, will generate around 5TWh each year.

The new Conservative government is targeting 40GW of offshore wind by 2030, up from today’s figure of around 8GW. If policies are put in place to meet this goal, then it could keep power sector emissions below 100gCO2/kWh, depending on the actual performance of the windfarms built.

However, new onshore wind and solar, further new nuclear or other low-carbon generation, such as gas with carbon capture and storage (CCS), is likely to be needed if demand is higher than expected, or if the 100gCO2/kWh benchmark is too weak in the context of net-zero by 2050.

The CCC says it is “likely” to “reflect the need for more rapid deployment” of low-carbon towards net-zero emissions in its advice on the sixth UK carbon budget for 2033-2037, due in September.

Trading places
Looking more closely at UK electricity generation in 2019, Carbon Brief’s analysis shows why there was so little growth for low-carbon sources compared to the previous year.

There was another increase for wind power in 2019 (up 8TWh, 14%), with record wind generation as several large new windfarms were completed including the 1.2GW Hornsea One project in October and the 0.6GW Beatrice offshore windfarm in Q2 of 2019. But this was offset by a decline for nuclear (down 9TWh, 14%), due to ongoing outages for reactors at Hunterston in Scotland and Dungeness in Kent.

(Analysis of data held by trade organisation RenewableUK suggests some 0.6GW of onshore wind capacity also started operating in 2019, including the 0.2GW Dorenell scheme in Moray, Scotland.)

As a result of these movements, the UK’s windfarms overtook nuclear for the first time ever in 2019, becoming the country’s second-largest source of electricity generation, and earlier, wind and solar together surpassed nuclear in the UK as momentum built. This is shown in the figure below, with wind (green line, top panel) trading places with nuclear (purple) and gas (dark blue) down around 25% since 2010 but remaining the single-largest source.

 Annual electricity generation in the UK by fuel, terawatt hours, 2010-2019. Top panel: fuel by fuel. Bottom panel: cumulative total generation from all sources. Source: BEIS energy trends, BM Reports and Carbon Brief analysis. Chart by Carbon Brief using Highcharts.
The UK’s currently suspended nuclear plants are due to return to service in January and March, according to operator EDF, the French state-backed utility firm. However, as noted above, most of the UK’s nuclear fleet is set to retire during the 2020s, with only Sizewell B in Suffolk due to still be operating by 2030. Hunterston is scheduled to retire by 2023 and Dungeness by 2028.

Set against these losses, the UK has a pipeline of offshore windfarms, secured via “contracts for difference” with the government, at a series of auctions. The most recent auction, in September 2019, saw prices below £40 per megawatt hour – similar to current wholesale electricity prices.

However, the capacity contracted so far is not sufficient to meet the government’s target of 40GW by 2030, meaning further auctions – or some other policy mechanism – will be required.

Coal zero
As well as the switch between wind and nuclear, 2019 also saw coal fall below solar for the first time across a full year, echoing the 2016 moment when wind outgenerated coal across the UK, after it suffered another 60% reduction in electricity output. Just six coal plants remain in the UK, with Aberthaw B in Wales and Fiddlers Ferry in Cheshire closing in March.

Coal accounted for just 2% of UK generation in 2019, a record-low coal share since centralised electricity supplies started to operate in 1882. The fuel met 40% of UK needs as recently as 2012, but has plummeted thanks to falling demand, rising renewables, cheaper gas and higher CO2 prices.

The reduction in average coal generation hides the fact that the fuel is now often not required at all to meet the UK’s electricity needs. The chart below shows the number of days each year when coal output was zero in 2019 (red line) and the two previous years (blue).

 Cumulative number of days when UK electricity generation from renewable sources has been higher than that from fossil fuels. Source: BEIS energy trends, BM Reports and Carbon Brief analysis. Chart by Carbon Brief using Highcharts.
The 83 days in 2019 with zero coal generation amount to nearly a quarter of the year and include the record-breaking 18-day stretch without the fuel.

Great Britain has been running for a record TWO WEEKS without using coal to generate electricity – the first time this has happened since 1882.

The country’s grid has been coal-free for 45% of hours in 2019 so far.https://www.carbonbrief.org/countdown-to-2025-tracking-the-uk-coal-phase-out …

Coal generation was set for significant reductions around the world in 2019 – including a 20% reduction for the EU as a whole – according to analysis published by Carbon Brief in November.

Notably, overall UK electricity generation fell by another 9TWh in 2019 (3%), bringing the total decline to 58TWh since 2010. This is equivalent to more than twice the output from the Hinkley C scheme being built in Somerset. As Carbon Brief explained last year, falling demand has had a similar impact on electricity-sector CO2 emissions as the increase in output from renewables.

This is illustrated by the fact that the 9TWh reduction in overall generation translated into a 9TWh (6%) cut in fossil-fuel generation during 2019, with coal falling by 10TWh and gas rising marginally.

Increasingly renewable
As fossil-fuel output and overall generation have declined, the UK’s renewable sources of electricity have continued to increase. Their output has risen nearly five-fold in the past decade and their share of the UK total has increased from 7% in 2010 to 37% in 2019.

As a result, the UK’s increasingly renewable grid is seeing more minutes, hours and days during which the likes of wind, solar and biomass collectively outpace all fossil fuels put together, and on some days wind is the main source as well.

The chart below shows the number of days during each year when renewables generated more electricity than fossil fuels in 2019 (red line) and each of the previous four years (blue lines). In total, nearly two-fifths of days in 2019 crossed this threshold.

 Cumulative number of days when the UK has not generated any electricity from coal. Source: BEIS energy trends, BM Reports and Carbon Brief analysis. Chart by Carbon Brief using Highcharts.
There were also four months in 2019 when renewables generated more of the UK’s electricity than fossil fuels: March, August, September and December. The first ever such month came in September 2018 and more are certain to follow.

National Grid, which manages Great Britain’s high-voltage electricity transmission network, is aiming to be able to run the system without fossil fuels by 2025, at least for short periods. At present, it sometimes has to ask windfarm operators to switch off and gas plants to start running in order to keep the electricity grid stable.

Note that biomass accounted for 11% of UK electricity generation in 2019, nearly a third of the total from all renewables. Some two-thirds of the biomass output is from “plant biomass”, primarily wood pellets burnt at Lynemouth in Northumberland and the Drax plant in Yorkshire. The remainder was from an array of smaller sites based on landfill gas, sewage gas or anaerobic digestion.

The CCC says the UK should “move away” from large-scale biomass power plants, once existing subsidy contracts for Drax and Lynemouth expire in 2027.

Using biomass to generate electricity is not zero-carbon and in some circumstances could lead to higher emissions than from fossil fuels. Moreover, there are more valuable uses for the world’s limited supply of biomass feedstock, the CCC says, including carbon sequestration and hard-to-abate sectors with few alternatives.

Methodology
The figures in the article are from Carbon Brief analysis of data from BEIS Energy Trends chapter 5 and chapter 6, as well as from BM Reports. The figures from BM Reports are for electricity supplied to the grid in Great Britain only and are adjusted to include Northern Ireland.

In Carbon Brief’s analysis, the BM Reports numbers are also adjusted to account for electricity used by power plants on site and for generation by plants not connected to the high-voltage national grid. This includes many onshore windfarms, as well as industrial gas combined heat and power plants and those burning landfill gas, waste or sewage gas.

By design, the Carbon Brief analysis is intended to align as closely as possible to the official government figures on electricity generated in the UK, reported in BEIS Energy Trends table 5.1.

Briefly, the raw data for each fuel is in most cases adjusted with a multiplier, derived from the ratio between the reported BEIS numbers and unadjusted figures for previous quarters.

Carbon Brief’s method of analysis has been verified against published BEIS figures using “hindcasting”. This shows the estimates for total electricity generation from fossil fuels or renewables to have been within ±3% of the BEIS number in each quarter since Q4 2017. (Data before then is not sufficient to carry out the Carbon Brief analysis.)

For example, in the second quarter of 2019, a Carbon Brief hindcast estimates gas generation at 33.1TWh, whereas the published BEIS figure was 34.0TWh. Similarly, it produces an estimate of 27.4TWh for renewables, against a BEIS figure of 27.1TWh.

National Grid recently shared its own analysis for electricity in Great Britain during 2019 via its energy dashboard, which differs from Carbon Brief’s figures.


Related News

View more

Cryptocurrency firm in Plattsburgh fights $1 million electric charge

Coinmint Plattsburgh Dispute spotlights cryptocurrency mining, hydropower electricity rates, a $1M security deposit, Public Service Commission rulings, municipal utility policies, and seasonal migration to Massena data centers as Bitcoin price volatility pressures operations.


Key Points

Legal and energy-cost dispute over crypto mining, a $1,019,503 deposit, and operations in Plattsburgh and Massena.

✅ PSC allows higher rates and requires large security deposits.

✅ Winter electricity spikes drove a $1M deposit calculation.

✅ Coinmint shifted capacity to Massena data centers.


A few years ago, there was a lot of buzz about the North Country becoming the next Silicon Valley of cryptocurrency, even as Maine debated a 145-mile line that could reshape regional power flows. One of the companies to flock here was Coinmint. The cryptomining company set up shop in Plattsburgh in 2017 and declared its intentions to be a good citizen.

Today, Coinmint is fighting a legal battle to avoid paying the city’s electric utility more than $1 million owed for a security deposit. In addition to that dispute, a local property manager says the firm was evicted from one of its Plattsburgh locations.

Companies like Coinmint chose to come to the North Country because of the relatively low electricity prices here, thanks in large part to the hydropower dam on the St. Lawrence River in Massena, and regionally, projects such as the disputed electricity corridor have drawn attention to transmission costs and access. Coinmint operates its North Country Data Center facilities in Plattsburgh and Massena. In both locations, racks of computer servers perform complex calculations to generate cryptocurrency, such as bitcoin.

When cryptomining began to take off in Plattsburgh, the cost of one bitcoin was skyrocketing. That brought hype around the possibility of big business and job creation in the North Country. But cryptomininers like Coinmint were using massive amounts of energy in the winter of 2017-2018, and that season, electric bills of everyday Plattsburgh residents spiked.

Many cryptomining firms operate in a state of flux, beholden to the price of Bitcoin and other cryptocurrencies, even as the end to the 'war on coal' declaration did little to change utilities' choices. When the price of one bitcoin hit $20,000 in 2017, it fell by 30% just days later. That’s one reason why the price of electricity is so critical for companies like Coinmint to turn a profit. 

Plattsburgh puts the brakes on “cryptocurrency mining”
In early 2018, Plattsburgh passed a moratorium on cryptocurrency mining operations, after residents complained of higher-than-usual electric bills.

“Your electric bill’s $100, then it’s at $130. Why? It’s because these guys that are mining the bitcoins are riding into town, taking advantage of a situation,” said resident Andrew Golt during a 2018 public hearing.

Coinmint aimed to assuage the worries of residents and other businesses. “At the end of the day we want to be a good citizen in whatever communities we’re in,” Coinmint spokesman Kyle Carlton told NCPR at that 2018 meeting.

“We’re open to working with those communities to figure out whatever solutions are going to work.”

The ban was lifted in Feb. 2019. However, since it didn’t apply to companies that were already mining cryptocurrency in Plattsburgh, Coinmint has operated in the city all along.

Coinmint challenges attempt to protect ratepayers
New rules passed by the New York Public Service Commission in March 2018 allow municipal power authorities including Plattsburgh’s to charge big energy users such as Coinmint higher electricity rates, amid customer backlash in other utility deals. The new rules also require them to put down a security deposit to ensure their bills get paid.

But Coinmint disputes that deposit charge. The company has been embroiled in a legal fight for nearly a year against Plattsburgh Municipal Lighting Department (PMLD) in an attempt to avoid paying the electric utility’s security deposit bill of $1,019,503. That bill is based on an estimate of what would cover two months of electricity use if a company were to leave town without paying its electric bills.

Coinmint would not discuss the dispute on the record with NCPR. Legal documents show the firm argues the deposit charge is inflated, based on a flawed calculation resulting in a charge hundreds of thousands of dollars higher than what it should be.

“Essentially they’re arguing that they should only have to put up some average of their monthly bills without accounting for the fact that winter bills are significantly higher than the average,” said Ken Podolny, an attorney representing the Plattsburgh utility.

The company took legal action in February 2019 against PMLD in the hopes New York’s energy regulator, the Public Service Commission, would agree with Coinmint that the deposit charge was too high. An informal commission hearing officer disagreed, and ruled in October the charge was calculated correctly.

Coinmint appealed the ruling in November and a hearing on the appeal could come as soon as February.

Less than a week after Coinmint lost its initial challenge of the deposit charge, the company made a splashy announcement trumpeting its plans to “migrate its Plattsburgh, New York infrastructure to its Massena, New York location for the 2019-2020 winter season.”

The announcement made no mention of the appeal or the recent ruling against Coinmint. The company attributed its new plan to “exceptionally-high” electricity rates in Plattsburgh, as hydropower transmission projects elsewhere in New England faced their own controversies. 

"We recognize some in the Plattsburgh community have blamed our operation for pushing rates higher for everyone so, while we disagree with that assessment, we hope this seasonal migration will have a positive impact on rates for all our neighbors,” said Coinmint cofounder Prieur Leary in the press statement.

“In the event that doesn't happen, we trust the community will look for the real answers for these high costs." Prieur Leary has since been removed from the corporate team page on the company’s website.

The company still operates in Plattsburgh at one of its locations in the city. As for staff, while at least two Coinmint employees have moved from Plattsburgh to Massena, where the company operates a data center inside a former Alcoa aluminum plant, it is unclear how many people in total have made the move.

Coinmint left its second Plattsburgh location in 2019. The company would not discuss that move on the record, yet the circumstances of the departure are murky.

The local property manager of the industrial park site told NCPR, “I have no comment on our evicted tenant Coinmint.” The property owner, California’s Karex Property Management Services, also would not comment regarding the situation, noting that “all staff have been told to not discuss anything regarding our past tenant Coinmint.”

Today, Bitcoin and other cryptocurrencies are worth a fraction of what they were back in 2017 when Coinmint came to the North Country, and now, amid a debate over Bitcoin's electricity use shaping market sentiment, the future of the entire industry here remains uncertain.


Related News

View more

Canadian Manufacturers and Exporters Congratulates the Ontario Government for Taking Steps to Reduce Electricity Prices

Ontario Global Adjustment Deferral offers COVID-19 electricity bill relief to industrial and commercial consumers not on the RPP, aligning GA to March levels for Class A and Class B manufacturers to improve cash flow.


Key Points

A temporary GA deferral easing electricity costs for Ontario industrial and commercial users not on the RPP.

✅ Sets Class B GA at $115/MWh; Class A gets equal percentage cut.

✅ Applies April-June 2020; automatic bill adjustments and credits.

✅ Deferred charges repaid over 12 months starting January 2021.


Manufacturers welcome the Government of Ontario's decision to defer a portion of Global Adjustment (GA) charges as part of support for industrial and commercial electricity consumers that do not participate in the Regulated Price Plan.

"Manufacturers are pleased the government listened to Canadian Manufacturers & Exporters (CME) member recommendations and is taking action to reduce Ontario electricity bills immediately," said Dennis Darby, President & CEO of CME.

"The majority of manufacturers have identified cash flow as their top concern during the crisis, "added Darby. "The GA system would have caused a nearly $2 billion cost surge to Ontario manufacturers this year. This new initiative by the government is on top of the billions in support already provided to help manufacturers weather this unprecedented storm, while other provinces accelerate British Columbia's clean energy shift to drive long-term competitiveness. All these measures are a great start in helping businesses of all sizes stay afloat during the crisis and, keeping Ontarians employed."

"We call on the Ontario government to continue to consider the impact of electricity costs on the manufacturing sector, even after the COVID-19 crisis is resolved," stated Darby. "High prices are putting Ontario manufacturers at a significant competitive disadvantage and, discourages investments." A recent report from London Economics International (LEI) found that when compared to jurisdictions with similar manufacturing industries, Ontario's electricity prices can be up to 75% more expensive, underscoring the importance of planning for Toronto's growing electricity needs to maintain affordability.

To provide companies with temporary immediate relief on their electricity bills, the Ontario government is deferring a portion of Global Adjustment (GA) charges for industrial and commercial electricity consumers that do not participate in the Regulated Price Plan (RPP), starting from April 2020, as some regions saw reduced electricity demand from widespread remote work during the pandemic. The GA rate for smaller industrial and commercial consumers (i.e., Class B) has been set at $115 per megawatt-hour, which is roughly in line with the March 2020 value. Large industrial and commercial consumers (i.e., Class A) will receive the same percentage reduction in GA charges as Class B consumers.

The Ontario government intends to keep this relief in place through the end of June 2020, alongside investments like smart grid technology in Sault Ste. Marie to support reliability, subject to necessary extensions and approvals to implement this initiative.

Industrial and commercial electricity consumers will automatically see this relief reflected on their bills. Consumers who have already received their April bill should see an adjustment on a future bill.

Related initiatives include developing cyber standards for electricity sector IoT devices to strengthen system security.

The government intends to bring forward subsequent amendments that would, if approved, recover the deferred GA charges (excluding interest) from industrial and commercial electricity consumers, as Toronto prepares for a surge in electricity demand amid continued growth, over a 12-month period beginning in January 2021.


Related News

View more

Sign Up for Electricity Forum’s Newsletter

Stay informed with our FREE Newsletter — get the latest news, breakthrough technologies, and expert insights, delivered straight to your inbox.

Electricity Today T&D Magazine Subscribe for FREE

Stay informed with the latest T&D policies and technologies.
  • Timely insights from industry experts
  • Practical solutions T&D engineers
  • Free access to every issue

Download the 2025 Electrical Training Catalog

Explore 50+ live, expert-led electrical training courses –

  • Interactive
  • Flexible
  • CEU-cerified