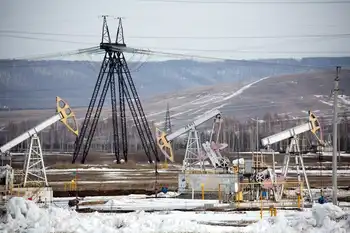
What is the true cost of power?

By Wall Street Journal


Electrical Testing & Commissioning of Power Systems

Our customized live online or in‑person group training can be delivered to your staff at your location.

  • Live Online
  • 12 hours Instructor-led
  • Group Training Available
Regular Price:
$599
Coupon Price:
$499
Reserve Your Seat Today
The debate in Washington D.C. over supporting clean energy is growing more partisan and acrimonious with each passing day. The debate centers on the cost of renewable energy, which critics charge is still more expensive than traditional energy sources despite decades of research and tens of billions of dollars in federal support.

But as the wrangling heats up in Washington, it’s worth remembering that the main reason clean energy is more expensive than dirty old energy is because the electricity game is not played on a level field. Critics of government support for clean energy decry “market manipulation,” when in reality what’s manipulated is the current state of affairs.

A case in point from today’s L.A. Times, on the “promise and peril” of President Obama’s clean-energy push:

“Success hinges on whether Obama can nurture alternative energy sources to the point where they cost no more than fossil fuels, an effort that most experts say will require heavy doses of brainpower, cash and market manipulation…. By the end of this year, the Energy Department’s spending on 35 years of clean-energy research will exceed the total inflation-adjusted cost of the Apollo program, which sent Americans to the moon, and the Manhattan Project, which developed the nuclear bomb — an estimated $117 billion combined…. That research, economists say, has made wind, solar and other alternative sources of energy cheaper. But fossil fuels remain cheaper yet.”

Simply put, fossil fuels remain cheaper because not all their costs are tallied — and that means pollution. Traditional power plants spew particulates into the air as well as carbon dioxide, but historically the cost of that pollution was not included in the pricetag for, say, operating a coal-fired plant.

When those costs are included, dirty old coal suddenly gets a lot more expensive. Even the most modern coal plants, fitted with all kinds of gizmos to scrub the air of dirty emissions, still cost more. In comparison, zero-emissions energy like wind power and solar power donÂ’t carry any significant hidden costs.

European researchers who have spent years exploring those so-called external costs figure regular old coal plants actually cost an additional 9-17 cents per kilowatt hour (7-13 European cents) — that’s an extra two or three times the average cost of electricity in the U.S. Even the cleanest of coal plants still costs an extra 2 cents per kilowatt hour.

And that, coincidentally, is the amount of subsidy support that wind power gets from the federal government to help close the cost gap. “When the external cost resulting from local and global impacts are included, the electric power system changes become more radical,” the European researchers concluded.

Bridging that cost gap is the whole thinking behind a cap-and-trade scheme that would put a pricetag on carbon emissions, which would make a whole suite of energy alternatives — from nuclear power to “clean coal” — cost competitive, depending on just how pricey carbon emissions really are.

And that is another reason that the quickest — if not the politically easiest — path to boosting clean energy will come through a national cap-and-trade scheme, rather than ramped-up federal “brainpower” or another Manhattan project.

Related News

The City of Vancouver is hosting an ABB FIA Formula E World Championship race next year, organizers have announced

Vancouver Formula E 2022 delivers an all-electric, net-zero motorsport event in False Creek, featuring sustainability initiatives, clean mobility showcases, concerts, and tourism boosts, with major economic impact, jobs, and a climate action conference.


Key Points

A net-zero, all-electric race in False Creek, uniting EV motorsport with sustainability, concerts, and local jobs.

✅ Net-zero, all-electric FIA championship round in Canada

✅ False Creek street circuit with concerts and green mobility expo

✅ Projected $80M impact and thousands of local jobs


The City of Vancouver is hosting an ABB FIA Formula E World Championship race next year, organizers have announced, aligning with the city's EV-ready policy to accelerate adoption.

The all-electric race is being held in the city's False Creek neighbourhood over the 2022 July long weekend as green energy investments accelerate nationwide, according to promoter OSS Group Inc.

Earlier this year, Vancouver city council voted unanimously in support of a multi-day Formula E event that would include a conference on climate change and sustainability amid predicted EV-demand bottlenecks in B.C.

"Formula E is a win on so many levels, from being a net-zero event that supports sustainable transportation to being a huge boost for our hard-hit tourism sector, our residents, who can access rebates for home and workplace charging, and our local economy," Coun. Sarah Kirby-Yung said in a news release Thursday.

As the region advances sustainable mobility, B.C.'s EV charging expansion continues to lead the country.

The promoter said the Formula E race will bring $80 million in economic value and thousands of jobs to the city, with infrastructure like new EV chargers at YVR also underway, but did not provide any details on how it came to those estimates.

More details on the events surrounding the race, including planned concerts and other EV showcases like Everything Electric, are expected to be announced in the fall.

The last time a Formula E World Championship event came to Canada was the Montreal ePrix in 2017. Montreal Mayor Valerie Plante later cancelled planned Formula E events for 2018 and 2019, citing cost overruns and sponsorship troubles.


Related News

View more

Two new electricity interconnectors planned for UK

Ofgem UK Electricity Interconnectors will channel subsea cables, linking Europe, enabling energy import/export, integrating offshore wind via multiple-purpose interconnectors, boosting grid stability, capacity, and investment under National Grid analysis to 2030 targets.


Key Points

Subsea links between the UK and Europe that trade power, integrate offshore wind, and reinforce grid capacity.

✅ Two new subsea interconnector bids open in 2025

✅ Pilot for multiple-purpose links to offshore wind clusters

✅ National Grid to assess optimal routes, capacity, and locations


Ofgem has opened bids to build two electricity interconnectors between the UK and continental Europe as part of the broader UK grid transformation now underway.

The energy regulator said this would “bring forward billions of pounds of investment” in the subsea cables, such as the Lake Erie Connector, which can import cheaper energy when needed and export surplus power from the UK when it is available.

Developers will be invited to submit bids to build the interconnectors next year. Ofgem will additionally run a pilot scheme for ‘multiple-purpose interconnectors’, which are used to link clusters of offshore wind farms and related innovations like an offshore vessel chargepoint to an interconnector.

This forms part of the UK Government drive to more than double capacity by 2030, and to manage rising electric-vehicle demand, as discussed in EV grid impacts, in support of its target of quadrupling offshore wind capacity by the same date.

Interconnectors provide some 7 per cent of UK electricity demand. The UK so far has seven electricity interconnectors linked to Ireland, France, Belgium, the Netherlands and Norway, while projects like the Ireland-France connection illustrate broader European grid integration.

Balfour Beatty won a £90m contract for onshore civil engineering works on the Viking Link Norway interconnector, which is due to come into operation in 2023, while London Gateway's all-electric berth highlights related port electrification.

It said that interconnector developers have in the past been allowed to propose their preferred design, connection location and sea route to the connecting country. Ofgem has now said it may decide to consider only those projects that meet its requirements based on an analysis of location and capacity needs by National Grid.

Ofgem has not specified that the new interconnectors must link to any specific place or country, but may do so later, as priorities like the Cyprus electricity highway illustrate emerging directions.


Related News

View more

BloombergNEF: World offshore wind costs 'drop 32% per cent'

Global Renewable LCOE Trends reveal offshore wind costs down 32%, with 10MW turbines, lower CAPEX and OPEX, and parity for solar PV and onshore wind in Europe, China, and California, per BloombergNEF analysis.


Key Points

Benchmarks showing falling LCOE for offshore wind, onshore wind, and solar PV, driven by larger turbines and lower CAPEX

✅ Offshore wind LCOE $78/MWh; $53-64/MWh in DK/NL excl. transmission

✅ Onshore wind $47/MWh; solar PV $51/MWh, best $26-36/MWh

✅ Cost drivers: 10MW turbines, lower CAPEX/OPEX, weak China demand


World offshore wind costs have fallen 32% from just a year ago and 12% compared with the first half of 2019, according to a BNEF long-term outlook from BloombergNEF.

In its latest Levelized Cost of Electricity (LCOE) Update, BloombergNEF said its current global benchmark LCOE estimate for offshore wind is $78 a megawatt-hour.

“New offshore wind projects throughout Europe, including the UK's build-out, now deploy turbines with power ratings up to 10MW, unlocking CAPEX and OPEX savings,” BloombergNEF said.

In Denmark and the Netherlands, it expects the most recent projects financed to achieve $53-64/MWh excluding transmission.

New solar and onshore wind projects have reached parity with average wholesale power prices in California and parts of Europe, while in China levelised costs are below the benchmark average regulated coal price, according to BloombergNEF.

The company's global benchmark levelized cost figures for onshore wind and PV projects financed in the last six months are at $47 and $51 a megawatt-hours, underscoring that renewables are now the cheapest new electricity option in many regions, down 6% and 11% respectively compared with the first half of 2019.

BloombergNEF said for wind this is mainly down to a fall in the price of turbines – 7% lower on average globally compared with the end of 2018.

In China, the world’s largest solar market, the CAPEX of utility-scale PV plants has dropped 11% in the last six months, reaching $0.57m per MW.

“Weak demand for new plants in China has left developers and engineering, procurement and construction firms eager for business, and this has put pressure on CAPEX,” BloombergNEF said.

It added that estimates of the cheapest PV projects financed recently – in India, Chile and Australia – will be able to achieve an LCOE of $27-36/MWh, assuming competitive returns for their equity investors.

Best-in-class onshore wind farms in Brazil, India, Mexico and Texas can reach levelized costs as low as $26-31/MWh already, the research said.

Programs such as the World Bank wind program are helping developing countries accelerate wind deployment as costs continue to drop.

BloombergNEF associate in the energy economics team Tifenn Brandily said: “This is a three- stage process. In phase one, new solar and wind get cheaper than new gas and coal plants on a cost-of- energy basis.

“In phase two, renewables reach parity with power prices. In phase three, they become even cheaper than running existing thermal plants.

“Our analysis shows that phase one has now been reached for two-thirds of the global population.

“Phase two started with California, China and parts of Europe. We expect phase three to be reached on a global scale by 2030.

“As this all plays out, thermal power plants will increasingly be relegated to a balancing role, looking for opportunities to generate when the sun doesn’t shine or the wind doesn’t blow.”


Related News

View more

Price Spikes in Ireland Fuel Concerns Over Dispatachable Power Shortages in Europe

ISEM Price Volatility reflects Ireland-Northern Ireland grid balancing pressures, driven by dispatchable power shortages, day-ahead market dynamics, renewable shortfalls, and interconnector constraints, affecting intraday trading, operational reserves, and cross-border electricity flows.


Key Points

ISEM price volatility is Irish power price swings from grid balancing stress and limited dispatchable capacity.

✅ One-off spike linked to plant outage and low renewables

✅ Day-ahead market settling; intraday trading integration pending

✅ Interconnectors and reserves vital to manage adequacy


Irish grid-balancing prices soared to €3,774 ($4,284) per megawatt-hour last month amid growing concerns over dispatchable power capacity across Europe.

The price spike, triggered by an alert regarding generation losses, came only four months after Ireland and Northern Ireland launched an Integrated Single Electricity Market (ISEM) designed to make trading more competitive and improve power distribution across the island.

Evie Doherty, senior consultant for Ireland at Cornwall Insight, a U.K.-based energy consultancy, said significant price volatility was to be expected while ISEM is still settling down, aligning with broader 2019 grid edge trends seen across markets.

When the U.K. introduced a single market for Great Britain, called British Electricity Trading and Transmission Arrangements, in 2005, it took at least six months for volatility to subside, Doherty said.

In the case of ISEM, “it will take more time to ascertain the exact drivers behind the high prices,” she said. “We are being told that the day-ahead market is functioning as expected, but it will take time to really be able to draw conclusions on efficiency.”

Ireland and Northern Ireland have been operating with a single market “very successfully” since 2007, said Doherty. Although each jurisdiction has its own regulatory authority, they make joint decisions regarding the single market.

ISEM, launched in October 2018, was designed to help include Ireland and Northern Ireland day-ahead electricity prices in a market pricing system called the European Union Pan-European Hybrid Electricity Market Integration Algorithm.

In time, ISEM should also allow the Irish grids to participate in European intraday markets, and recent examples like Ukraine's grid connection underline the pace of integration efforts across Europe. At present, they are only able to do so with Great Britain. “The idea was to...integrate energy use and create more efficient flows between jurisdictions,” Doherty said.

EirGrid, the Irish transmission system operator, has reported that flows on its interconnector with Northern Ireland are more efficient than before, she said.

The price spike happened when the System Operator for Northern Ireland issued an alert for an unplanned plant outage at a time of low renewable output and constraints on the north-south tie-line with Ireland, according to a Cornwall Insight analysis.


Not an isolated event

Although it appears to have been a one-off event, there are increasing worries that a shortage of dispatchable power could lead to similar situations elsewhere across Europe, as seen in Nordic grid constraints recently.

Last month, newspaper Frankfurter Allgemeine Zeitung (FAZ) reported that German industrial concerns had been forced to curtail more than a gigawatt of power consumption to maintain operational reserves on the grid in December, after renewable production fell short of expectations and harsh weather impacts strained systems elsewhere.

Paul-Frederik Bach, a Danish energy consultant, has collected data showing that this was not an isolated incident. The FAZ report said German aluminum smelters had been forced to cut back on energy use 78 times in 2018, he noted.

Energy availability was also a concern last year in Belgium, where six out of seven nuclear reactors had been closed for maintenance. The closures forced Belgium to import 23 percent of its electricity from neighboring countries, Bach reported.

In a separate note, Bach revealed that 11 European countries that were net importers of energy had boosted their imports by 26 percent between 2017 and 2018. It is important to note that electricity imports do not necessarily imply a shortage of power, he stated.

However, it is also true that many European grid operators are girding themselves for a future in which dispatchable power is scarcer than today.

EirGrid, for example, expects dispatchable generation and interconnection capacity to drop from 10.6 gigawatts in 2018 to 9 gigawatts in 2027.

The Swedish transmission system operator Svenska Kraftnät, meanwhile, is forecasting winter peak power deficits could rise from 400 megawatts currently to 2.5 gigawatts in 2020-21.

Research conducted by the European Network of Transmission System Operators for Electricity, suggests power adequacy will fall across most of Europe up to 2025, although perhaps not to a critical degree.

The continent’s ability to deal with the problem will be helped by having more efficient trading systems, Bach told GTM. That means developments such as ISEM could be a step in the right direction, despite initial price volatility.

In the long run, however, Europe will need to make sure market improvements are accompanied by investments in HVDC technology and interconnectors and reserve capacity. “Somewhere there must be a production of electricity, even when there is no wind,” said Bach. 


Related News

View more

Warren Buffett’s Secret To Cheap Electricity: Wind

Berkshire Hathaway Energy Wind Power drives cheap electricity rates in Iowa via utility-scale wind turbines, integrated transmission, battery storage, and grid management, delivering renewable energy, stable pricing, and long-term rate freezes through 2028.


Key Points

A vertically integrated wind utility lowering Iowa rates via owned generation, transmission, and advanced grid control.

✅ Owned wind assets meet Iowa residential demand

✅ Integrated transmission lowers costs and losses

✅ Rate freeze through 2028 sustains cheap power


In his latest letter to Berkshire Hathaway shareholders, Warren Buffett used the 20th anniversary of Berkshire Hathaway Energy to tout its cheap electricity bills for customers.

When Berkshire purchased the majority share of BHE in 2000, the cost of electricity for its residential customers in Iowa was 8.8 cents per kilowatt-hour (kWh) on average. Since then, these electricity rates have risen at a paltry <1% per year, with a freeze on rate hikes through 2028. As anyone who pays an electricity bill knows, that is an incredible deal.  

As Buffett himself notes with alacrity, “Last year, the rates [BHE’s competitor in Iowa] charged its residential customers were 61% higher than BHE’s. Recently, that utility received a rate increase that will widen the gap to 70%.”


The Winning Strategy

So, what’s Buffett’s secret to cheap electricity? Wind power.

“The extraordinary differential between our rates and theirs is largely the result of our huge accomplishments in converting wind into electricity,” Buffett explains. 

Wind turbines in Iowa that BHE owns and operates are expected to generate about 25.2 million megawatt-hours (MWh) of electricity for its customers, as projects like Building Energy operations begin to contribute. By Buffett’s estimations, that will be enough to power all of its residential customers’ electricity needs in Iowa.  


The company has plans to increase its renewable energy generation in other regions as well. This year, BHE Canada is expected to start construction on a 117.6MW wind farm in Alberta, Canada with its partner, Renewable Energy Systems, that will provide electricity to 79,000 homes in Canada’s oil country.

Observers note that Alberta is a powerhouse for both green energy and fossil fuels, underscoring the region's unique transition.

But I would argue that the secret to BHE’s success perhaps goes deeper than transitioning to sources of renewable energy. There are plenty of other utility companies that have adopted wind and solar power as an energy source. In the U.S., where renewable electricity surpassed coal in 2022, at least 50% of electricity customers have the option to buy renewable electricity from their power supplier, according to the Department of Energy. And some states, such as New York, have gone so far as to allow customers to pick from providers who generate their electricity.

What differentiates BHE from a lot of the competition in the utility space is that it owns the means to generate, store, transmit and supply renewable power to its customers across the U.S., U.K. and Canada, with lessons from the U.K. about wind power informing policy.

In its financial filings for 2019, the company reported that it owns 33,600MW of generation capacity and has 33,400 miles of transmission lines, as well as a 50% interest in Electric Transmission Texas (ETT) that has approximately 1,200 miles of transmission lines. This scale and integration enables BHE to be efficient in the distribution and sale of electricity, including selling renewable energy across regions.

BHE is certainly not alone in building renewable-energy fueled electricity dominions. Its largest competitor, NextEra, built 15GW of wind capacity and has started to expand its utility-scale solar installations. Duke Energy owns and operates 2,900 MW of renewable energy, including wind and solar. Exelon operates 40 wind turbine sites across the U.S. that generate 1,500 MW.


Integrated Utilities Power Ahead

It’s easy to see why utility companies see wind as a competitive source of electricity compared to fossil fuels. As I explained in my previous post, Trump’s Wrong About Wind, the cost of building and generating wind energy have fallen significantly over the past decade. Meanwhile, improvements in battery storage and power management through new technological advancements have made it more reliable (Warren Buffett bet on that one too).

But what is also striking is that integrated power and transmission enables these utility companies to make those decisions; both in terms of sourcing power from renewable energy, as well as the pricing of the final product. Until wind and solar power are widespread, these utility companies are going to have an edge of the more fragmented ends of the industry who can’t make these purchasing or pricing decisions independently. 

Warren Buffett very rarely misses a beat. He’s not the Oracle of Omaha for nothing. Berkshire Hathaway’s ownership of BHE has been immensely profitable for its shareholders. In the year ended December 31, 2019, BHE and its subsidiaries reported net income attributable to BHE shareholders of $2.95 billion.

There’s no question that renewable energy will transform the utility industry over the next decade. That change will be led by the likes of BHE, who have the power to invest, control and manage their own energy generation assets.


Related News

View more

Which of the cleaner states imports dirty electricity?

Hourly Electricity Emissions Tracking maps grid balancing areas, embodied emissions, and imports/exports, revealing carbon intensity shifts across PJM, ERCOT, and California ISO, and clarifying renewable energy versus coal impacts on health and climate.


Key Points

An hourly method tracing generation, flows, and embodied emissions to quantify carbon intensity across US balancing areas.

✅ Hourly traces of imports/exports and generation mix

✅ Consumption-based carbon intensity by balancing area

✅ Policy insights for renewables, coal, health costs


In the United States, electricity generation accounts for nearly 30% of our carbon emissions. Some states have responded to that by setting aggressive renewable energy standards; others are hoping to see coal propped up even as its economics get worse. Complicating matters further is the fact that many regional grids are integrated, and as America goes electric the stakes grow, meaning power generated in one location may be exported and used in a different state entirely.

Tracking these electricity exports is critical for understanding how to lower our national carbon emissions. In addition, power from a dirty source like coal has health and environment impacts where it's produced, and the costs of these aren't always paid by the parties using the electricity. Unfortunately, getting reliable figures on how electricity is produced and where it's used is challenging, even for consumers trying to find where their electricity comes from in the first place, leaving some of the best estimates with a time resolution of only a month.

Now, three Stanford researchers—Jacques A. de Chalendar, John Taggart, and Sally M. Benson—have greatly improved on that standard, and they have managed to track power generation and use on an hourly basis. The researchers found that, of the 66 grid balancing areas within the United States, only three have carbon emissions equivalent to our national average, and they have found that imports and exports of electricity have both seasonal and daily changes. de Chalendar et al. discovered that the net results can be substantial, with imported electricity increasing California's emissions/power by 20%.

Hour by hour
To figure out the US energy trading landscape, the researchers obtained 2016 data for grid features called balancing areas. The continental US has 66 of these, providing much better spatial resolution on the data than the larger grid subdivisions. This doesn't cover everything—several balancing areas in Canada and Mexico are tied in to the US grid—and some of these balancing areas are much larger than others. The PJM grid, serving Pennsylvania, New Jersey, and Maryland, for example, is more than twice as large as Texas' ERCOT, in a state that produces and consumes the most electricity in the US.

Despite these limitations, it's possible to get hourly figures on how much electricity was generated, what was used to produce it, and whether it was used locally or exported to another balancing area. Information on the generating sources allowed the researchers to attach an emissions figure to each unit of electricity produced. Coal, for example, produces double the emissions of natural gas, which in turn produces more than an order of magnitude more carbon dioxide than the manufacturing of solar, wind, or hydro facilities. These figures were turned into what the authors call "embodied emissions" that can be traced to where they're eventually used.

Similar figures were also generated for sulfur dioxide and nitrogen oxides. Released by the burning of fossil fuels, these can both influence the global climate and produce local health problems.

Huge variation
The results were striking. "The consumption-based carbon intensity of electricity varies by almost an order of magnitude across the different regions in the US electricity system," the authors conclude. The low is the Bonneville Power grid region, which is largely supplied by hydropower; it has typical emissions below 100kg of carbon dioxide per megawatt-hour. The highest emissions come in the Ohio Valley Electric region, where emissions clear 900kg/MW-hr. Only three regional grids match the overall grid emissions intensity, although that includes the very large PJM (where capacity auction payouts recently fell), ERCOT, and Southern Co balancing areas.

Most of the low-emissions power that's exported comes from the Pacific Northwest's abundant hydropower, while the Rocky Mountains area exports electricity with the highest associated emissions. That leads to some striking asymmetries. Local generation in the hydro-rich Idaho Power Company has embodied emissions of only 71kg/MW-hr, while its imports, coming primarily from Rocky Mountain states, have a carbon content of 625kg/MW-hr.

The reliance on hydropower also makes the asymmetry seasonal. Local generation is highest in the spring as snow melts, but imports become a larger source outside this time of year. As solar and wind can also have pronounced seasonal shifts, similar changes will likely be seen as these become larger contributors to many of these regional grids. Similar things occur daily, as both demand and solar production (and, to a lesser extent, wind) have distinct daily profiles.

The Golden State
California's CISO provides another instructive case. Imports represent less than 30% of its total electric use in 2016, yet California electricity imports provided 40% of its embodied emissions. Some of these, however, come internally from California, provided by the Los Angeles Department of Water and Power. The state itself, however, has only had limited tracking of imported emissions, lumping many of its sources as "other," and has been exporting its energy policies to Western states in ways that shape regional markets.

Overall, the 2016 inventory provides a narrow picture of the US grid, as plenty of trends are rapidly changing our country's emissions profile, including the rise of renewables and the widespread adoption of efficiency measures and other utility trends in 2017 that continue to evolve. The method developed here can, however, allow for annual updates, providing us with a much better picture of trends. That could be quite valuable to track things like how the rapid rise in solar power is altering the daily production of clean power.

More significantly, it provides a basis for more informed policymaking. States that wish to promote low-emissions power can use the information here to either alter the source of their imports or to encourage the sites where they're produced to adopt more renewable power. And those states that are exporting electricity produced primarily through fossil fuels could ensure that the locations where the power is used pay a price that includes the health costs of its production.


Related News

View more

Sign Up for Electricity Forum’s Newsletter

Stay informed with our FREE Newsletter — get the latest news, breakthrough technologies, and expert insights, delivered straight to your inbox.

Electricity Today T&D Magazine Subscribe for FREE

Stay informed with the latest T&D policies and technologies.
  • Timely insights from industry experts
  • Practical solutions T&D engineers
  • Free access to every issue

Live Online & In-person Group Training

Advantages To Instructor-Led Training – Instructor-Led Course, Customized Training, Multiple Locations, Economical, CEU Credits, Course Discounts.

Request For Quotation

Whether you would prefer Live Online or In-Person instruction, our electrical training courses can be tailored to meet your company's specific requirements and delivered to your employees in one location or at various locations.