Bill would require Commerce to measure transmission grid adequacy

By Finance and Commerce


NFPA 70b Training - Electrical Maintenance

Our customized live online or in‑person group training can be delivered to your staff at your location.

  • Live Online
  • 12 hours Instructor-led
  • Group Training Available
Regular Price:
$599
Coupon Price:
$499
Reserve Your Seat Today
State Sen. Yvonne Prettner Solon has introduced a bill that would require the Department of Commerce to issue an annual electric grid adequacy report, giving legislators a chance to assess the state’s transmission needs – and to measure progress toward the goal of generating more power from renewable sources such as wind and solar.

The measure has been referred to the Senate Energy, Utilities, Technology and Communications committee.

Prettner Solon, a DFLer from Duluth, chairs that committee.

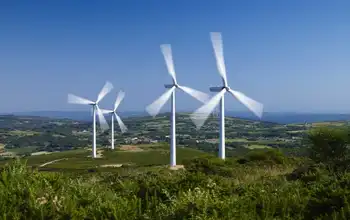
Language in the bill, Measure S.F. 526, states that the report must identify barriers to meeting transmission needs and recommendations, including legislation, necessary to overcome those barriers. The state wants to see 25 percent of power generated from renewable sources by the year 2025, and for that to happen, transmission lines must be extended to the wind farms and dams where much of the regionÂ’s renewable energy will be generated.

The billÂ’s introduction comes at a time when Duluth-based Minnesota Power is discussing a 15-year agreement to purchase 250 megawatts of hydro power from Winnipeg-based Manitoba Hydro-Electric.

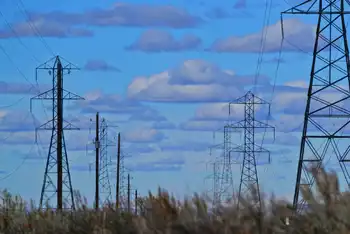
That power purchase agreement includes the routing of a 230-kilovolt transmission line from Canada to Duluth, according to Glenn Schneider, public affairs manager for Manitoba Hydro.

The Canada-based utility is also negotiating with Maple Grove-based Great River Energy, Minneapolis-based Xcel Energy Inc. and Wisconsin Public Service Corp. to buy electricity, Schneider said.

Manitoba Hydro-Electric plans to boost hydro power capacity over the next 12 years by building a number of dams along a 400-mile stretch of the Nelson River as it flows from Lake Winnipeg to Hudson Bay.

Government approval is required for the 230-kilovolt transmission line into Minnesota, which could be a part of the first transmission adequacy report to state lawmakers pending passage of Prettner SolonÂ’s bill.

Introduction of the transmission bill comes amid a flurry of electric transmission news, which coincides with todayÂ’s scheduled stakeholder meeting of the Upper Midwest Development Initiative (UMTDI) in St. Paul.

Formed in 2008, UMTDI is a five-state effort to encourage regional electric transmission development. Utilities in the region are interested in the regional effort because it could help promote development of transmission lines to deliver power from thinly-populated areas where wind energy is generated to consumer markets.

Last September, Novi, Mich.-based ITC Holdings Corp., which owns thousands of miles of transmission lines in the Midwest, applauded the efforts of UMTDI.

At that time, Joseph Welch, president and chief executive officer of ITC Holdings Corp., said, “There is a critical need for further transmission development in the Upper Midwest if we want to harvest the region’s strong wind energy potential.”

ITC Holdings Corp. announced plans to build the Green Power Express, a 3,000 mile grid of extra high-voltage transmission lines in seven states that costs up to $12 billion.

That announcement preceded the Senate approval of a federal economic stimulus package, includes funding for rebuilding the nationÂ’s transmission infrastructure.

Joining ITC Holdings Corp. as partners on the Green Power Express project are Minneapolis-based National Wind LLC; Baxter, Minn.-based Denali Energy; NextEra Energy, the wind energy development unit of Florida Power & Light; Iberdrola Renewables; Boulder, Colo.-based RES Americas, which maintains a Minneapolis office; Wind Capital Group; and Montgomery Power Partners.

The projectÂ’s web site, www.thegreenpowerexpress.com, states that the network of 765-kilovolt lines could be built by 2020, and is capable of delivering 12 megawatts of electricity from wind farms to energy consumers.

Related News

Tens of Thousands Left Without Power as 'Bomb Cyclone' Strikes B.C. Coast

British Columbia Bomb Cyclone disrupts coastal travel with severe wind gusts, heavy rainfall, widespread power outages, ferry cancellations, flooding, and landslides across Vancouver Island, straining emergency services and transport networks during the early holiday season.


Key Points

A rapidly intensifying storm hitting B.C.'s coast, causing damaging winds, heavy rain, power outages, and ferry delays.

✅ Wind gusts over 100 km/h and well above normal rainfall

✅ Power outages, flooded roads, and downed trees across the coast

✅ Ferry cancellations isolating communities and delaying supplies


A powerful storm, dubbed a "bomb cyclone," recently struck the British Columbia coast, wreaking havoc across the region. This intense weather system led to widespread disruptions, including power outages affecting tens of thousands of residents and the cancellation of ferry services, crucial for travel between coastal communities. The bomb cyclone is characterized by a rapid drop in pressure, resulting in extremely strong winds and heavy rainfall. These conditions caused significant damage, particularly along the coast and on Vancouver Island, where flooding and landslides led to fallen trees blocking roads, further complicating recovery efforts.

The storm's ferocity was especially felt in coastal areas, where wind gusts reached over 100 km/h, and rainfall totals were well above normal. The Vancouver region, already susceptible to storms during the winter months, faced dangerous conditions as power lines were downed, and transportation networks struggled to stay operational. Emergency services were stretched thin, responding to multiple weather-related incidents, including fallen trees, damaged infrastructure, and local flooding.

The ferry cancellations further isolated communities, especially those dependent on these services for essential supplies and travel. With many ferry routes out of service, residents had to rely on alternative transportation methods, which were often limited. The storm's timing, close to the start of the holiday season, also created additional challenges for those trying to make travel arrangements for family visits and other festive activities.

As cleanup efforts got underway, authorities warned that recovery would take time, particularly due to the volume of downed trees and debris. Crews worked to restore power and clear roads, while local governments urged people to stay indoors and avoid unnecessary travel, and BC Hydro's winter payment plan provided billing relief during outages. For those without power, the storm brought cold temperatures, and record electricity demand in 2021 showed how cold snaps strain the grid, making it crucial for families to find warmth and supplies.

In the aftermath of the bomb cyclone, experts highlighted the increasing frequency of such extreme weather events, driven in part by climate change and prolonged drought across the province. With the potential for more intense storms in the future, the region must be better prepared for these rapid weather shifts. Authorities are now focused on bolstering infrastructure to withstand such events, as all-time high demand has strained the grid recently, and improving early warning systems to give communities more time to prepare.

In the coming weeks, as British Columbia continues to recover, lessons learned from this storm will inform future responses to similar weather systems. For now, residents are advised to remain vigilant and prepared for any additional weather challenges, with recent blizzard and extreme cold in Alberta illustrating how conditions can deteriorate quickly.


Related News

View more

Wind and solar make more electricity than nuclear for first time in UK

UK Renewables Surpass Nuclear Milestone as wind farms and solar panels outpace atomic output, cutting greenhouse gas emissions. BEIS data show low-carbon power generation rising while onshore wind subsidies and auction timelines face policy debate.


Key Points

It is the quarter when UK wind and solar generated more electricity than nuclear, signaling cleaner, low-carbon growth.

✅ BEIS reports wind and solar at 18.33 TWh vs nuclear 16.69 TWh

✅ Energy sector emissions fell 8% as coal use dropped

✅ Calls grow to reopen onshore wind support via CFD auctions


Wind farms and solar panels, with wind leading the power mix during key periods, produced more electricity than the UK’s eight nuclear power stations for the first time at the end of last year, official figures show.

Britain’s greenhouse gas emissions also continued to fall, dropping 3% in 2017, as coal use fell and the use of renewables climbed, though low-carbon generation stalled in 2019 according to later data.

Energy experienced the biggest drop in emissions of any UK sector, of 8%, while pollution from transport and businesses stayed flat.

Energy industry chiefs said the figures showed that the government should rethink its ban on onshore wind subsidies, a move that ministers have hinted could happen soon.

Lawrence Slade, chief executive of the big six lobby group Energy UK, said: “We need to keep up the pace ... by ensuring that the lowest cost renewables are no longer excluded from the market.”

Across the whole year, low-carbon sources of power – wind, solar, biomass and nuclear – provided a record 50.4% of electricity, up from 45.7% in 2016, when wind beat coal for the first time.

But in the fourth quarter of 2017, high wind speeds, new renewables installations and lower nuclear output saw wind and solar becoming the second biggest source of power for the first time.

Wind and solar generated 18.33 terawatt hours (TWh), with nuclear on 16.69TWh, and the UK later set a new record for wind power during 2019, the figures published by the Department for Business, Energy and Industrial Strategy show.

But renewables still have a long way to go to catch up with gas, the UK’s top source of electricity at 36.12TWh, which saw its share of generation fall slightly, though at times wind became the main source as capacity expanded.

Greenpeace said the figures showed the government should capitalise on its lead in renewables and “stop wasting time and money propping up nuclear power”.

Horizon Nuclear Power, a subsidiary of the Japanese conglomerate Hitachi, is in talks with Whitehall officials for a financial support package from the government, which it says it needs by midsummer.

By contrast, large-scale solar and onshore wind projects are not eligible for support, after the Conservative government cut subsidies in 2015.

However the energy minister, Claire Perry, recently told House Magazine that “we will have another auction that brings forward wind and solar, we just haven’t yet said when”.


Related News

View more

"It's freakishly cold": Deep freeze slams American energy sector

Texas Deep Freeze Energy Crisis strains grids as polar vortex triggers rolling blackouts, record natural gas and electricity prices, refinery shutdowns, WTI gains, and scarcity pricing across Texas, Oklahoma, SPP, and Mexico.


Key Points

A polar vortex slamming Texas energy: outages, record power prices, gas spikes, and reduced oil output.

✅ Record gas trades near $500/mmBtu; power hits $6,000/MWh

✅ WTI tops $60 as Texas shuts in ~1 million bpd

✅ Rolling blackouts across SPP; ERCOT scarcity pricing


A deep freeze is roiling electricity markets in more than a dozen U.S. states, leading to record-setting prices for electricity and natural gas, knocking oil production off line and shutting down some of North America’s largest refineries.

“It’s freakishly cold,” said Eric Fell, a senior natural gas analyst with Wood Mackenzie in Houston, where record cold temperatures and snow have blanketed the city, caused rolling power outages, shut down refineries and sent both natural gas and electricity prices soaring.

'It’s freakishly cold': Deep freeze slams North American energy sector

The polar vortex has led to freezing temperatures in every county in Texas, the largest energy-producing state in the U.S., and caused massive disruptions across the North American energy complex, triggering Texas power outages as far south as Mexico.

As the plunge in temperatures forced oil companies to shut in an estimated one million barrels of oil production in Texas on Monday, the West Texas Intermediate benchmark price rose above the US$60 per barrel threshold for the first time in a year to settle up 1 per cent, or US65 cents, at US$60.12 per barrel.

President Joe Biden declared an emergency on Monday, unlocking federal assistance to Texas.

People carry groceries from a local gas station on Monday in Austin, Texas. Winter storm Uri has brought historic cold weather to Texas, causing traffic delays and power outages. 

Frozen wind farms are just a small piece of Texas’s power grid woes right now.

Fell said regional natural gas and electricity prices in Oklahoma and Texas broke U.S. records over the weekend.

On Friday, Oklahoma gas transmission prices averaged US$350 per million British thermal units and Fell said one trade went as high as US$600 per mmBtu. In parts of the Texas panhandle and elsewhere, prices jumped to US$200, “all of which individually would have been new records,” Fell said, noting the previous record was US$160.

On Monday, natural gas for physical delivery in the U.S. was trading for as much as US$500 per mmBtu as demand for the heating and power plant fuel soared.  Spot gas has been trading for hundreds of dollars across the central U.S. since Thursday with a surge in heating demand triggering widespread blackouts and sending electricity prices soaring. The fuel normally trades in the region for less than US$3 per mmBtu.

Similarly, electricity prices in Texas surged to US$6,000 per megawatt hour on Monday, as U.S. power companies grapple with supply-chain constraints, which Fell said is “100 times the normal price.”

“You’re seeing scarcity pricing in power and gas. The only thing that’s different this time is it’s staying there – it’s not just an hour or two hours, it’s the whole day,” he said.

The blast of Arctic cold, which has blanketed Canada and much of the U.S., has created a massive draw on natural gas supplies, used both for home heating and industrial uses like electricity generation.

Little Rock, Ark.-based Southwest Power Pool, which coordinates electricity distribution for parts of 14 states including Oklahoma Kansas, Nebraska and even as far north as North Dakota, announced rolling blackouts across its network on Monday as a result of the power outages.

“In our history as a grid operator, this is an unprecedented event and marks the first time SPP has ever had to call for controlled interruptions of service” SPP’s executive vice-president and chief operating officer Lanny Nickell said in a release, adding the move was “a last resort” to “prevent circumstances from getting worse.”

The frigid conditions have led to a surge in natural gas prices across the continent, including in Alberta where the AECO benchmark price jumped to a seven-year high of $6.36 per thousand cubic feet last week, a price not seen since 2014.

Energy systems in Texas and Oklahoma, which are major energy exporters to other U.S. states, are built to withstand severe heat – not extreme cold. The result is a disruption to the gas supply at exactly the time the U.S. energy system is demanding those molecules.

“Given how far south it’s gone into Texas, this is where you have a lot of gas production that isn’t properly winterized,” said Jeremy McCrea, an analyst with Raymond James covering the natural gas industry.


Related News

View more

Cost of US nuclear generation at ten-year low

US Nuclear Generating Costs 2017 show USD33.50/MWh for nuclear energy, the lowest since 2008, as capital expenditures, fuel costs, and operating costs declined after license renewals and uprates, supporting a reliable, low-carbon grid.


Key Points

The 2017 US nuclear average was USD33.50/MWh, lowest since 2008, driven by reduced capital, fuel, and operating costs.

✅ Average cost USD33.50/MWh, lowest since 2008

✅ Capital, fuel, O&M costs fell sharply since 2012 peak

✅ License renewals, uprates, market reforms shape competitiveness


Average total generating costs for nuclear energy in 2017 in the USA were at their lowest since 2008, according to a study released by the Nuclear Energy Institute (NEI), amid a continuing nuclear decline debate in other regions.

The report, Nuclear Costs in Context, found that in 2017 the average total generating cost - which includes capital, fuel and operating costs - for nuclear energy was USD33.50 per megawatt-hour (MWh), even as interest in next-generation nuclear designs grows among stakeholders. This is 3.3% lower than in 2016 and more than 19% below 2012's peak. The reduction in costs since 2012 is due to a 40.8% reduction in capital expenditures, a 17.2% reduction in fuel costs and an 8.7% reduction in operating costs, the organisation said.

The year-on-year decline in capital costs over the past five years reflects the completion by most plants of efforts to prepare for operation beyond their initial 40-year licence. A few major items - a series of vessel head replacements; steam generator replacements and other upgrades as companies prepared for continued operation, and power uprates to increase output from existing plants - caused capital investment to increase to a peak in 2012. "As a result of these investments, 86 of the [USA's] 99 operating reactors in 2017 have received 20-year licence renewals and 92 of the operating reactors have been approved for uprates that have added over 7900 megawatts of electricity capacity. Capital spending on uprates and items necessary for operation beyond 40 years has moderated as most plants are completing these efforts," it says.

Since 2013, seven US nuclear reactors have shut down permanently, with the Three Mile Island debate highlighting wider policy questions, and another 12 have announced their permanent shutdown. The early closure for economic reasons of reliable nuclear plants with high capacity factors and relatively low generating costs will have long-term economic consequences, the report warns: replacement generating capacity, when needed, will produce more costly electricity, fewer jobs that will pay less, and, for net-zero emissions objectives, more pollution, it says.

NEI Vice President of Policy Development and Public Affairs John Kotek said the "hardworking men and women of the nuclear industry" had done an "amazing job" reducing costs through the institute's Delivering the Nuclear Promise campaign and other initiatives, in line with IAEA low-carbon lessons from the pandemic. "As we continue to face economic headwinds in markets which do not properly compensate nuclear plants, the industry has been doing its part to reduce costs to remain competitive," he said.

"Some things are in urgent need of change if we are to keep the nation's nuclear plants running and enjoy their contribution to a reliable, resilient and low-carbon grid. Namely, we need to put in place market reforms that fairly compensate nuclear similar to those already in place in New York, Illinois and other states," Kotek added.

Cost information in the study was collected by the Electric Utility Cost Group with prior years converted to 2017 dollars for accurate historical comparison.


Related News

View more

Invest in Hydropower to Tackle Coronavirus and Climate Crisis Impacts

Hydropower Covid-19 Resilience highlights clean, reliable energy and flexible grid services, with pumped storage, automation, and affordability supporting climate action, decarbonization, and recovery through sustainable infrastructure, policy incentives, and capacity upgrades.


Key Points

Hydropower Covid-19 Resilience is the sector's ability to ensure clean, reliable, flexible power during crises.

✅ Record 4,306 TWh in 2019, avoiding 80-100 Mt CO2e emissions.

✅ 1,308 GW installed; 15.6 GW added; flexibility and storage in demand.

✅ Policy, tax incentives, and fast-track approvals to spur projects.


The Covid-19 pandemic has underlined hydropower's resilience and critical role in delivering clean, reliable and affordable energy, especially in times of crisis, as highlighted by IAEA lessons for low-carbon electricity. This is the conclusion of two new reports published by the International Hydropower Association (IHA).

The 2020 Hydropower Status Report presents latest worldwide installed capacity and generation data, showcasing the sector's contribution to global carbon reduction efforts, with low-emissions sources projected to cover almost all demand increases in the next three years. It is published alongside a Covid-19 policy paper featuring recommendations for governments, financial institutions and industry to respond to the current health and economic crisis.

"Preventing an emergency is far better than responding to one," says Roger Gill, President of IHA, highlighting the need to incentivise investments in renewable infrastructure, a view echoed by Fatih Birol during the crisis. "The events of the past few months must be a catalyst for stronger climate action, including greater development of sustainable hydropower."

Now in its seventh edition, the Hydropower Status Report shows electricity generation hit a record 4,306 terawatt hours (TWh) in 2019, the single greatest contribution from a renewable energy source in history, aligning with the outlook that renewables to surpass coal by 2025.

The annual rise of 2.5 per cent (106 TWh) in hydroelectric generation - equivalent to the entire electricity consumption of Pakistan - helped to avoid an estimated additional 80-100 million metric tonnes of greenhouse gases being emitted last year.

The report also highlights:

* Global hydropower installed capacity reached 1,308 gigawatts (GW) in 2019, as 50 countries completed greenfield and upgrade projects, including pumped storage and repowering old dams in some regions.

* A total of 15.6 GW in installed capacity was added in 2019, down on the 21.8 GW recorded in 2018. This represents a rise of 1.2 per cent, which is below the estimated 2.0 per cent growth rate required for the world to meet Paris Agreement carbon reduction targets.

* India has overtaken Japan as the fifth largest world hydropower producer with its total installed capacity now standing at over 50 GW. The countries with the highest increases in were Brazil (4.92 GW), China (4.17 GW) and Laos (1.89 GW).

* Hydropower's flexibility services have been in high demand during the Covid-19 crisis, even as global demand dipped 15% globally, while plant operations have been less affected due to the degree of automation in modern facilities.

* Hydropower developments have not been immune to economic impacts however, with the industry facing widespread uncertainty and liquidity shortages which have put financing and refinancing of some projects at risk.

In a companion policy paper, IHA sets out the immediate impacts of the crisis on the sector, noting how European responses to Covid-19 have accelerated the electricity system transition, as well as recommendations to assist governments and financial institutions and enhance hydropower's contribution to the recovery.

The recommendations include:

  • Increasing the ambition of renewable energy and climate change targets which incorporate the role of sustainable hydropower development.
  • Supporting sustainable hydropower through introducing appropriate financial measures such as tax incentives to ensure viable and shovel-ready projects can commence.
  • Fast-tracking planning approvals to ensure the development and modernisation of hydropower projects can commence as soon as possible, in line with internationally recognised sustainability guidelines.
  • Safeguarding investment by extending deadlines for concession agreements and other awarded projects.
  • Given the increasing need for long-duration energy storage such as pumped storage, working with regulators and system operators to develop appropriate compensation mechanisms for hydropower's flexibility services.


Related News

View more

How Energy Use Has Evolved Throughout U.S. History

U.S. Energy Transition traces the shift from coal and oil to natural gas, nuclear power, and renewables like wind and solar, driven by efficiency, grid modernization, climate goals, and economic innovation.


Key Points

The U.S. Energy Transition is the shift from fossil fuels to cleaner power, driven by tech, policy, and markets.

✅ Shift from coal and oil to gas, nuclear, wind, and solar

✅ Enabled by grid modernization, storage, and efficiency

✅ Aims to cut emissions while ensuring reliability and affordability


The evolution of energy use in the United States is a dynamic narrative that reflects technological advancements, economic shifts, environmental awareness, and societal changes over time. From the nation's early reliance on wood and coal to the modern era dominated by oil, natural gas, and renewable sources, the story of energy consumption in the U.S. is a testament to innovation and adaptation.

Early Energy Sources: Wood and Coal

In the early days of U.S. history, energy needs were primarily met through renewable resources such as wood for heating and cooking. As industrialization took hold in the 19th century, coal emerged as a dominant energy source, fueling steam engines and powering factories, railways, and urban growth. The widespread availability of coal spurred economic development and shaped the nation's infrastructure.

The Rise of Petroleum and Natural Gas

The discovery and commercialization of petroleum in the late 19th century transformed the energy landscape once again. Oil quickly became a cornerstone of the U.S. economy, powering transportation, industry, and residential heating, and informing debates about U.S. energy security in policy circles. Concurrently, natural gas emerged as a significant energy source, particularly for heating and electricity generation, as pipelines expanded across the country.

Electricity Revolution

The 20th century witnessed a revolution in electricity generation and consumption, and understanding where electricity comes from helps contextualize how systems evolved. The development of hydroelectric power, spurred by projects like the Hoover Dam and Tennessee Valley Authority, provided clean and renewable energy to millions of Americans. The widespread electrification of rural areas and the proliferation of appliances in homes and businesses transformed daily life and spurred economic growth.

Nuclear Power and Energy Diversification

In the mid-20th century, nuclear power emerged as a promising alternative to fossil fuels, promising abundant energy with minimal greenhouse gas emissions. Despite concerns about safety and waste disposal, nuclear power plants became a significant part of the U.S. energy mix, providing a stable base load of electricity, even as the aging U.S. power grid complicates integration of variable renewables.

Renewable Energy Revolution

In recent decades, the U.S. has seen a growing emphasis on renewable energy sources such as wind, solar, and geothermal power, yet market shocks and high fuel prices alone have not guaranteed a rapid green revolution, prompting broader policy and investment responses. Advances in technology, declining costs, and environmental concerns have driven investments in clean energy infrastructure and policies promoting renewable energy adoption. States like California and Texas lead the nation in wind and solar energy production, demonstrating the feasibility and benefits of transitioning to sustainable energy sources.

Energy Efficiency and Conservation

Alongside shifts in energy sources, improvements in energy efficiency and conservation have played a crucial role in reducing per capita energy consumption and greenhouse gas emissions. Energy-efficient appliances, building codes, and transportation innovations have helped mitigate the environmental impact of energy use while reducing costs for consumers and businesses, and weather and economic factors also influence demand; for example, U.S. power demand fell in 2023 on milder weather, underscoring the interplay between efficiency and usage.

Challenges and Opportunities

Looking ahead, the U.S. faces both challenges and opportunities in its energy future, as recent energy crisis effects ripple across electricity, gas, and EVs alike. Addressing climate change requires further investments in renewable energy, grid modernization, and energy storage technologies. Balancing energy security, affordability, and environmental sustainability remains a complex task that requires collaboration between government, industry, and society.

Conclusion

The evolution of energy use throughout U.S. history reflects a continuous quest for innovation, economic growth, and environmental stewardship. From wood and coal to nuclear power and renewables, each era has brought new challenges and opportunities in meeting the nation's energy needs. As the U.S. transitions towards a cleaner and more sustainable energy future, leveraging technological advancements and embracing policy solutions, amid debates over U.S. energy dominance, will be essential in shaping the next chapter of America's energy story.


Related News

View more

Sign Up for Electricity Forum’s Newsletter

Stay informed with our FREE Newsletter — get the latest news, breakthrough technologies, and expert insights, delivered straight to your inbox.

Electricity Today T&D Magazine Subscribe for FREE

Stay informed with the latest T&D policies and technologies.
  • Timely insights from industry experts
  • Practical solutions T&D engineers
  • Free access to every issue

Live Online & In-person Group Training

Advantages To Instructor-Led Training – Instructor-Led Course, Customized Training, Multiple Locations, Economical, CEU Credits, Course Discounts.

Request For Quotation

Whether you would prefer Live Online or In-Person instruction, our electrical training courses can be tailored to meet your company's specific requirements and delivered to your employees in one location or at various locations.