40 clean energy jobs come to Satcon Power

By Electricity Forum


High Voltage Maintenance Training Online

Our customized live online or in‑person group training can be delivered to your staff at your location.

  • Live Online
  • 12 hours Instructor-led
  • Group Training Available
Regular Price:
$599
Coupon Price:
$499
Reserve Your Seat Today
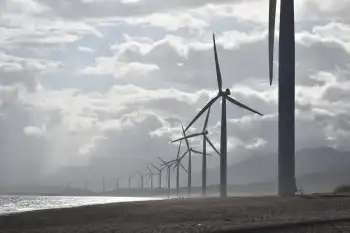
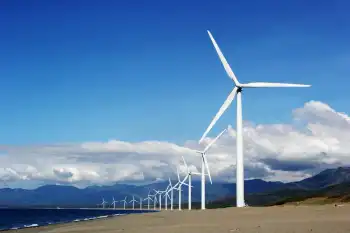
Ontario's clean energy economy and the growing global demand from clean energy projects has helped Satcon Power Systems Canada, Ltd. create 40 jobs, growing their Burlington workforce by a third in less than a year.

Satcon has expanded their workforce to 158 people to help meet the demand for solar equipment in Ontario, across North America and in countries like China, France, Germany, Italy, Greece and the Czech Republic.

Satcon is one of more than 20 companies that have announced they are setting up or expanding plants to manufacture parts for the solar and wind industry, creating new jobs in Ontario.

Ontario's Energy Plan is aimed at getting Ontario off dirty, smog-producing coal and on to cleaner energy sources like wind, solar and bio-energy. The Plan also includes relief for families, through the new Ontario Clean Energy Benefit that is taking 10 per cent off electricity bills every month.

Related News

Nelson, B.C. Gets Charged Up on a New EV Fast-Charging Station

Nelson DC Fast-Charging EV Station delivers 50-kilowatt DCFC service at the community complex, expanding EV infrastructure in British Columbia with FortisBC, faster than Level 2 chargers, supporting clean transportation, range confidence, and highway corridor travel.


Key Points

A 50 kW public DC fast charger in Nelson, BC, run by FortisBC, providing rapid EV charging at the community complex.

✅ 50 kW DCFC cuts charge time to about 30 minutes

✅ $9 per half hour session; convenient downtown location

✅ Funded by NRCan, BC government, and FortisBC


FortisBC and the City of Nelson celebrated the opening of Nelson's first publicly available direct current fast-charging (DCFC) electric vehicle (EV) station on Friday.

"Adopting EV's is one of many ways for individuals to reduce carbon emissions," said Mayor John Dooley, City of Nelson. "We hope that the added convenience of this fast-charging station helps grow EV adoption among our community, and we appreciate the support from FortisBC, the province and the federal government."

The new station, located at the Nelson and District Community Complex, provides a convenient and faster charge option right in the heart of the commercial district and makes Nelson more accessible for both local and out-of-town EV drivers. The 50-kilowatt station is expected to bring a compact EV from zero to 80 per cent charged in about a half an hour, as compared to the four Level-2 charging stations located in downtown Nelson that require from three to four hours. The cost for a half hour charge at the new DC fast-charging station is $9 per half hour.

This fast-charging station was made possible through a partnership between FortisBC, the City of Nelson, Nelson Hydro, the Province of British Columbia and Natural Resources Canada. As part of the partnership, the City of Nelson is providing the location and FortisBC will own and manage the station.

This is the latest of 12 fast-charging stations FortisBC has built over the last year with support from municipalities and all levels of government, and adds to the five FortisBC-owned Kootenay stations that were opened as part of the accelerate Kootenays initiative in 2018.

All 12 stations were 50 per cent funded by Natural Resources Canada, 25 per cent by BC Ministry of Energy, Mines and Petroleum Resources and the remaining 25 per cent by FortisBC. The funding is provided by Natural Resources Canada's Electric Vehicle and Alternative Fuel Infrastructure Deployment Initiative, which aims to establish a coast-to-coast network of fast-chargers along the national highway system, natural gas refueling stations along key freight corridors and hydrogen refueling stations in major metropolitan areas. It is part of the Government of Canada's more than $180-billion Investing in Canada infrastructure plan. The Government of British Columbia is also contributing $300,000 towards the fast-chargers through its Clean Energy Vehicle Public Fast Charging Program.

This station brings the total DCFC chargers FortisBC owns and operates to 17 stations across 14 communities in the southern interior. FortisBC continues to look for opportunities to expand this network as part of its 30BY30 goal of reducing emissions from its customers by 30 per cent by 2030. For more information about the FortisBC electric vehicle fast-charging network, visit: fortisbc.com/electricvehicle.

"Electric vehicles play a key role in building a cleaner future. We are pleased to work with partners like FortisBC and the City of Nelson to give Canadians greener options to drive where they need to go, " said The Honourable Seamus O'Regan, Canada's Minister of Natural Resources.

"Nelson's first public fast-charging EV station increases EV infrastructure in the city, making it easier than ever to make the switch to cleaner transportation. Along with a range of rebates and financial incentives available to EV drivers, it is now more convenient and affordable to go electric and this station is a welcome addition to our EV charging infrastructure," said Michelle Mungall, BC's Minister of Jobs, Economic Development and Competitiveness, and MLA for Nelson Creston.

"Building the necessary DC fast-charging infrastructure, such as the Lillooet fast-charging site in British Columbia, close to highways and local amenities where drivers need them most is a critical step in growing electric vehicle adoption. Collaborations like this are proving to be an effective way to achieve this, and I'd like to thank all the program partners for their commitment in opening this important station, " said Mark Warren, Director of Business Innovation, FortisBC.


Related News

View more

Sustainable Marine now delivering electricity to Nova Scotia grid from tidal energy

Sustainable Marine tidal energy delivers in-stream power to Nova Scotia's grid from Grand Passage, proving low-impact, renewable generation and advancing a floating tidal array at FORCE and Minas Passage in the Bay of Fundy.


Key Points

The first in-stream tidal project supplying clean power to Nova Scotia's grid, proven at Grand Passage.

✅ First to deliver in-stream tidal power to Canada's grid

✅ Demonstration at Grand Passage informs FORCE deployments

✅ Low-impact design and environmental monitoring validated


Sustainable Marine has officially powered up its tidal energy operation in Canada and is delivering clean electricity to the power system in Nova Scotia, on the country’s Atlantic coast, as the province moves to increase wind and solar projects in the years ahead. The company’s system in Grand Passage is the first to deliver in-stream tidal power to the grid in Canada, following provincial approval to harness Bay of Fundy tides that is spurring further development.

The system start-up is the culmination of more than a decade of research, development and testing, including lessons from Scottish tidal projects in recent years and a powerful tidal turbine feeding onshore grids, managing the technical challenges associated with operating in highly energetic environments and proving the ultra-low environmental impact of the tidal technology.

Sustainable Marine is striving to deliver the world’s first floating tidal array at FORCE (Fundy Ocean Research Centre for Energy). This project will be delivered in phases, drawing upon the knowledge gained and lessons learned in Grand Passage, and insights from offshore wind pilots like France’s first offshore wind turbine in Europe. In the coming months the company will continue to operate the platform at its demonstration site at Grand Passage, gradually building up power production, while New York and New England clean energy demand continues to rise, to further prove the technology and environmental monitoring systems, before commencing deployments in the Minas Passage – renowned as the Everest of tidal energy.

The Bay of Fundy’s huge tidal energy resource contains more than four times the combined flow of every freshwater river in the world, with the potential to generate approximately 2,500 MW of green energy, underscoring why independent electricity planning will be important for integrating marine renewables.


Related News

View more

Which of the cleaner states imports dirty electricity?

Hourly Electricity Emissions Tracking maps grid balancing areas, embodied emissions, and imports/exports, revealing carbon intensity shifts across PJM, ERCOT, and California ISO, and clarifying renewable energy versus coal impacts on health and climate.


Key Points

An hourly method tracing generation, flows, and embodied emissions to quantify carbon intensity across US balancing areas.

✅ Hourly traces of imports/exports and generation mix

✅ Consumption-based carbon intensity by balancing area

✅ Policy insights for renewables, coal, health costs


In the United States, electricity generation accounts for nearly 30% of our carbon emissions. Some states have responded to that by setting aggressive renewable energy standards; others are hoping to see coal propped up even as its economics get worse. Complicating matters further is the fact that many regional grids are integrated, and as America goes electric the stakes grow, meaning power generated in one location may be exported and used in a different state entirely.

Tracking these electricity exports is critical for understanding how to lower our national carbon emissions. In addition, power from a dirty source like coal has health and environment impacts where it's produced, and the costs of these aren't always paid by the parties using the electricity. Unfortunately, getting reliable figures on how electricity is produced and where it's used is challenging, even for consumers trying to find where their electricity comes from in the first place, leaving some of the best estimates with a time resolution of only a month.

Now, three Stanford researchers—Jacques A. de Chalendar, John Taggart, and Sally M. Benson—have greatly improved on that standard, and they have managed to track power generation and use on an hourly basis. The researchers found that, of the 66 grid balancing areas within the United States, only three have carbon emissions equivalent to our national average, and they have found that imports and exports of electricity have both seasonal and daily changes. de Chalendar et al. discovered that the net results can be substantial, with imported electricity increasing California's emissions/power by 20%.

Hour by hour
To figure out the US energy trading landscape, the researchers obtained 2016 data for grid features called balancing areas. The continental US has 66 of these, providing much better spatial resolution on the data than the larger grid subdivisions. This doesn't cover everything—several balancing areas in Canada and Mexico are tied in to the US grid—and some of these balancing areas are much larger than others. The PJM grid, serving Pennsylvania, New Jersey, and Maryland, for example, is more than twice as large as Texas' ERCOT, in a state that produces and consumes the most electricity in the US.

Despite these limitations, it's possible to get hourly figures on how much electricity was generated, what was used to produce it, and whether it was used locally or exported to another balancing area. Information on the generating sources allowed the researchers to attach an emissions figure to each unit of electricity produced. Coal, for example, produces double the emissions of natural gas, which in turn produces more than an order of magnitude more carbon dioxide than the manufacturing of solar, wind, or hydro facilities. These figures were turned into what the authors call "embodied emissions" that can be traced to where they're eventually used.

Similar figures were also generated for sulfur dioxide and nitrogen oxides. Released by the burning of fossil fuels, these can both influence the global climate and produce local health problems.

Huge variation
The results were striking. "The consumption-based carbon intensity of electricity varies by almost an order of magnitude across the different regions in the US electricity system," the authors conclude. The low is the Bonneville Power grid region, which is largely supplied by hydropower; it has typical emissions below 100kg of carbon dioxide per megawatt-hour. The highest emissions come in the Ohio Valley Electric region, where emissions clear 900kg/MW-hr. Only three regional grids match the overall grid emissions intensity, although that includes the very large PJM (where capacity auction payouts recently fell), ERCOT, and Southern Co balancing areas.

Most of the low-emissions power that's exported comes from the Pacific Northwest's abundant hydropower, while the Rocky Mountains area exports electricity with the highest associated emissions. That leads to some striking asymmetries. Local generation in the hydro-rich Idaho Power Company has embodied emissions of only 71kg/MW-hr, while its imports, coming primarily from Rocky Mountain states, have a carbon content of 625kg/MW-hr.

The reliance on hydropower also makes the asymmetry seasonal. Local generation is highest in the spring as snow melts, but imports become a larger source outside this time of year. As solar and wind can also have pronounced seasonal shifts, similar changes will likely be seen as these become larger contributors to many of these regional grids. Similar things occur daily, as both demand and solar production (and, to a lesser extent, wind) have distinct daily profiles.

The Golden State
California's CISO provides another instructive case. Imports represent less than 30% of its total electric use in 2016, yet California electricity imports provided 40% of its embodied emissions. Some of these, however, come internally from California, provided by the Los Angeles Department of Water and Power. The state itself, however, has only had limited tracking of imported emissions, lumping many of its sources as "other," and has been exporting its energy policies to Western states in ways that shape regional markets.

Overall, the 2016 inventory provides a narrow picture of the US grid, as plenty of trends are rapidly changing our country's emissions profile, including the rise of renewables and the widespread adoption of efficiency measures and other utility trends in 2017 that continue to evolve. The method developed here can, however, allow for annual updates, providing us with a much better picture of trends. That could be quite valuable to track things like how the rapid rise in solar power is altering the daily production of clean power.

More significantly, it provides a basis for more informed policymaking. States that wish to promote low-emissions power can use the information here to either alter the source of their imports or to encourage the sites where they're produced to adopt more renewable power. And those states that are exporting electricity produced primarily through fossil fuels could ensure that the locations where the power is used pay a price that includes the health costs of its production.


Related News

View more

Kenney holds the power as electricity sector faces profound change

Alberta Electricity Market Reform reshapes policy under the UCP, weighing a capacity market versus energy-only design, AESO reliability rules, renewables targets, coal phase-out, carbon pricing, consumer rates, and investment certainty before AUC decisions.


Key Points

Alberta Electricity Market Reform is the UCP plan to reassess capacity vs energy-only, renewables, and carbon pricing.

✅ Reviews capacity market timeline and AESO procurement

✅ Alters subsidies for renewables; slows wind and solar growth

✅ Adjusts industrial carbon levy; audits Balancing Pool losses


Hearings kicked off this week into the future of the province’s electricity market design, amid an electricity market reshuffle pledged by the province, but a high-stakes decision about the industry’s fate — affecting billions of dollars in investment and consumer costs — won’t be made inside the meeting room of the Alberta Utilities Commission.

Instead, it will take place in the office of Jason Kenney, as the incoming premier prepares to pivot away from the seismic reforms to Alberta’s electricity sector introduced by the Notley government.

The United Conservative Party has promised to adopt market-based policies, reflecting changes to how Alberta produces and pays for power, that will reset how the sector operates, from its approach to renewable energy and carbon pricing to re-evaluating the planned transition to an electricity “capacity market.”

“Every ball in electricity is up in the air right now,” Vittoria Bellissimo, of the Industrial Power Consumers Association of Alberta, said Tuesday during a break in the commission hearings.

Industry players are uncertain how quickly the UCP will change direction on power policies, but there’s little doubt Kenney’s government will take a strikingly different approach to the sector that keeps the lights on in Alberta.

“There’s some things they are going to change that are going to impact the electricity industry significantly,” said Duane Reid-Carlson, chief executive of consultancy EDC Associates.

“But I don’t think it’s going to be upheaval. I think the new government will proceed with caution because electricity is the foundation of our economy.”

Alberta’s electricity market has been turned on its head in recent years due to the recession, power prices dropping to near two-decade lows and several transformative policies initiated by the NDP.

The Notley government’s climate plan included an accelerated phase-out of all coal-fired generation and set targets for more renewable energy.

The most significant, but least-understood, move has been the planned shift to an electricity capacity market in 2021.

Under the strategy, generators will no longer solely be paid for the power produced and sold into the market; they will also receive payments for having electricity capacity available to the grid on demand.

The change was recommended by the Alberta Electric System Operator (AESO) as a way to reduce price volatility and provide more reliability than the current energy-only market, which some argue needs more competition to deliver better outcomes.

The independent system operator and industry officials have spent more than two years planning the transition since the switch was announced in late 2016. Proposed rules for the new system, outlining market changes, are now being discussed at the Alberta Utilities Commission hearings.

However, there is no ironclad guarantee the system remake will go ahead following the UCP’s election victory last week — amid calls to scrap the overhaul from a Calgary retailer — it plans to study the issue further — while other substantive electricity changes are already in store.

The UCP has promised to end “costly subsidies” to renewable energy developments and abandon the NDP’s pledge to have such energy sources make up 30 per cent of all power generation by 2030.

It will remove the planned phase-out of coal-fired electricity generation, although federal regulations for a 2030 prohibition remain in place.

It will also ask the auditor general to conduct a special audit of the massive losses sustained by the province’s Balancing Pool due to power purchase arrangements being handed back to the agency three years ago.

While Kenney has pledged to cancel the provincewide carbon tax, a levy on large industrial greenhouse gas emitters (such has power plants) will still be charged, although at a reduced rate of $20 a tonne.

The biggest unknown remains the power market’s structure, which underpins how the entire system operates.

The UCP has promised to consult on the shift to the capacity market and report back to Albertans within 90 days.

The complex issue may sound like an eye-glazer, but it will have a profound effect on industry investment, as well as how much consumers pay on their monthly electricity bills.

A number of industry players worry the capacity market will lead AESO to procure more power than is necessary, foisting unnecessary costs onto all Albertans.

“I still have concerns for what the impact on consumers is going to be,” said energy market consultant Sheldon Fulton. “I’d love to see the capacity market go away.”

An analysis by EDC Associates found the transition to a capacity market will procure additional electricity before it’s needed, requiring consumers to pay up to 40 per cent more — an extra $1.4 billion — for power in 2021-22 than under the existing market structure.

“I don’t think there’s any prejudged outcome,” said Blake Shaffer, former head trader at TransAlta Corp. and a fellow-in-residence at the C.D. Howe Institute.

“But it really matters about getting this right.”

Evan Bahry, executive director of the Independent Power Producers Society of Alberta, said the fact the UCP’s review was confined to just 90 days is helpful, as it avoids throwing the entire industry into a prolonged period of uncertainty.

As for the greening of Alberta’s power grid, amid growing attention to clean grids and storage, the demise of the NDP’s Renewable Electricity Program will likely slow down the rapid pace of wind and solar development. But it’s unlikely to stop the growth trend as costs continue to fall for such developments.

“Renewables over the last number of years have evolved to the point that they make sense on a subsidy-free basis,” said Dan Balaban, CEO of Greengate Power Corp., which has developed 480 MW of wind power in Alberta and Ontario.

“There is a path to clean electricity ahead.”

Chris Varcoe is a Calgary Herald columnist.


Related News

View more

UK electricity and gas networks making ‘unjustified’ profits

UK Energy Network Profits are under scrutiny as Ofgem price controls, Citizens Advice claims, and National Grid margins spark debate over monopolies, allowed returns, consumer bills, rebates, and future investment under tougher regulation.


Key Points

UK Energy Network Profits are returns set by Ofgem for regulated grid operators, shaping consumer bills and investment

✅ Ofgem sets allowed returns for monopoly networks via price controls

✅ Dispute over interest rates, bond yields, and risk premiums

✅ Reforms proposed: shorter controls, tougher investor incentives


Companies that run Britain’s electricity and gas networks, including National Grid, are making “eye-watering” profits at the expense of households, according to a well-known consumer group.

Citizens Advice believes £7.5bn in “unjustified” profits should be returned to consumers who pay for network costs via their electricity and gas bills, with parallels seen in a deferred BC Hydro costs report abroad, although its figures have been contested by the energy industry and regulator.

Ownership of electricity and gas networks came under the spotlight in the run-up to June’s general election, after the Labour party said in its manifesto it would bring both national and regional grid infrastructure to back into public ownership, amid wider debates about grid privatization concerns elsewhere, over time.

Electricity sector privatisation began in 1990 and the gas industry was privatised in 1986. Energy network companies — which own and operate the cables and wires that help deliver electricity and gas to homes and businesses — are in effect monopolies that are regulated by Ofgem. Ofgem evaluates what their costs, including the cost of capital to finance investments, might be over an eight-year “price control” period, similar to determinations like the OEB decision on Hydro One rates in Ontario, Canada. Citizens Advice claims many of the regulator’s calculations for the most recent price control went “considerably in networks’ financial favour”.

It believes assumptions Ofgem made about factors such as the future path of interest rates and returns on government bonds were too generous, with international contrasts like power theft challenges in India illustrating different risk contexts, as was the regulator’s assessment of the risk associated with operating a network company. 

These “generous” assumptions will lead to network companies making average profit margins of 19 per cent and an average return of 10 per cent for their investors at the expense of consumers, Citizens Advice claims in a report published on Wednesday, which recommends a shorter price control period to allow for more accurate forecasting.

“Decisions made by Ofgem have allowed gas and electricity network companies to make sky-high profits that we’ve found are not justified by their performance,” said Gillian Guy, chief executive of Citizens Advice. Ofgem defended its regulatory regime, saying it helped to cut costs, improve reliability and customer satisfaction. 

“Ofgem has already cut costs to consumers by 6 per cent in the current price control and secured a rebate of over £4.5bn from network companies and is engaging with the industry to deliver further savings, with some regions seeing Ontario electricity rate reductions for businesses as well,” said Dermot Nolan, chief executive of the energy regulator.

Mr Nolan insisted the next price controls would be “tougher for investors”. The current price controls for the gas and electricity transmission networks, plus gas distribution, run until 2021 and until 2023 for local electricity distribution networks.

“While we don’t agree with its modelling and the figures it has produced, the Citizens Advice report raises some important issues about network regulation which will be addressed in the next control,” Mr Nolan said.

The Energy Networks Association, a trade body, refuted the claims of Citizens Advice, insisting that costs had fallen by 17 per cent in real terms since privatisation. The current regulatory framework was established after a public consultation, it said, adding that today’s report repeated several old claims that had previously been rejected by the Competition and Markets Authority.

“Our energy networks are among the most reliable and lowest cost in the world and their performance has never been better. In the next six years energy network companies are forecasted to deliver £45bn of investment in the UK economy,” a spokesman for the networks association added. National Grid said that since 2013 it had generated savings of £460m for bill payers.


Related News

View more

UK low-carbon electricity generation stalls in 2019

UK low-carbon electricity 2019 saw stalled growth as renewables rose slightly, wind expanded, nuclear output fell, coal hit record lows, and net-zero targets demand faster deployment to cut CO2 intensity below 100gCO2/kWh.


Key Points

Low-carbon sources supplied 54% of UK power in 2019, up just 1TWh; wind grew, nuclear fell, and coal dropped to 2%.

✅ Wind up 8TWh; nuclear down 9TWh amid outages

✅ Fossil fuels 43% of generation; coal at 2%

✅ Net-zero needs 15TWh per year added to 2030


The amount of electricity generated by low-carbon sources in the UK stalled in 2019, Carbon Brief analysis shows.

Low-carbon electricity output from wind, solar, nuclear, hydro and biomass rose by just 1 terawatt hour (TWh, less than 1%) in 2019. It represents the smallest annual increase in a decade, where annual growth averaged 9TWh. This growth will need to double in the 2020s to meet UK climate targets while replacing old nuclear plants as they retire.

Some 54% of UK electricity generation in 2019 came from low-carbon sources, including 37% from renewables and 20% from wind alone, underscoring wind's leading role in the power mix during key periods. A record-low 43% was from fossil fuels, with 41% from gas and just 2% from coal, also a record low. In 2010, fossil fuels generated 75% of the total.

Carbon Brief’s analysis of UK electricity generation in 2019 is based on figures from BM Reports and the Department for Business, Energy and Industrial Strategy (BEIS). See the methodology at the end for more on how the analysis was conducted.

The numbers differ from those published earlier in January by National Grid, which were for electricity supplied in Great Britain only (England, Wales and Scotland, but excluding Northern Ireland), including via imports from other countries.

Low-carbon low
In 2019, the UK became the first major economy to target net-zero greenhouse gas emissions by 2050, increasing the ambition of its legally binding Climate Change Act.

To date, the country has cut its emissions by around two-fifths since 1990, with almost all of its recent progress coming from the electricity sector.

Emissions from electricity generation have fallen rapidly in the decade since 2010 as coal power has been almost phased out and even gas output has declined. Fossil fuels have been displaced by falling demand and by renewables, such as wind, solar and biomass.

But Carbon Brief’s annual analysis of UK electricity generation shows progress stalled in 2019, with the output from low-carbon sources barely increasing compared to a year earlier.

The chart below shows low-carbon generation in each year since 2010 (grey bars) and the estimated level in 2019 (red). The pale grey bars show the estimated future output of existing low-carbon sources after old nuclear plants retire and the pale red bars show the amount of new generation needed to keep electricity sector emissions to less than 100 grammes of CO2 per kilowatt hour (gCO2/kWh), the UK’s nominal target for the sector.

 Annual electricity generation in the UK by fuel, terawatt hours, 2010-2019. Top panel: fuel by fuel. Bottom panel: cumulative total generation from all sources. Source: BEIS energy trends, BM Reports and Carbon Brief analysis. Chart by Carbon Brief using Highcharts.
As the chart shows, the UK will require significantly more low-carbon electricity over the next decade as part of meeting its legally binding climate goals.

The nominal 100gCO2/kWh target for 2030 was set in the context of the UK’s less ambitious goal of cutting emissions to 80% below 1990 levels by 2050. Now that the country is aiming to cut emissions to net-zero by 2050, that 100gCO2/kWh indicator is likely to be the bare minimum.

Even so, it would require a rapid step up in the pace of low-carbon expansion, compared to the increases seen over the past decade. On average, low-carbon generation has risen by 9TWh each year in the decade since 2010 – including a rise of just 1TWh in 2019.

Given scheduled nuclear retirements and rising demand expected by the Committee on Climate Change (CCC) – with some electrification of transport and heating – low-carbon generation would need to increase by 15TWh each year until 2030, just to meet the benchmark of 100gCO2/kWh.

For context, the 3.2 gigawatt (GW) Hinkley C new nuclear plant being built in Somerset will generate around 25TWh once completed around 2026. The world’s largest offshore windfarm, the 1.2GW Hornsea One scheme off the Yorkshire coast, will generate around 5TWh each year.

The new Conservative government is targeting 40GW of offshore wind by 2030, up from today’s figure of around 8GW. If policies are put in place to meet this goal, then it could keep power sector emissions below 100gCO2/kWh, depending on the actual performance of the windfarms built.

However, new onshore wind and solar, further new nuclear or other low-carbon generation, such as gas with carbon capture and storage (CCS), is likely to be needed if demand is higher than expected, or if the 100gCO2/kWh benchmark is too weak in the context of net-zero by 2050.

The CCC says it is “likely” to “reflect the need for more rapid deployment” of low-carbon towards net-zero emissions in its advice on the sixth UK carbon budget for 2033-2037, due in September.

Trading places
Looking more closely at UK electricity generation in 2019, Carbon Brief’s analysis shows why there was so little growth for low-carbon sources compared to the previous year.

There was another increase for wind power in 2019 (up 8TWh, 14%), with record wind generation as several large new windfarms were completed including the 1.2GW Hornsea One project in October and the 0.6GW Beatrice offshore windfarm in Q2 of 2019. But this was offset by a decline for nuclear (down 9TWh, 14%), due to ongoing outages for reactors at Hunterston in Scotland and Dungeness in Kent.

(Analysis of data held by trade organisation RenewableUK suggests some 0.6GW of onshore wind capacity also started operating in 2019, including the 0.2GW Dorenell scheme in Moray, Scotland.)

As a result of these movements, the UK’s windfarms overtook nuclear for the first time ever in 2019, becoming the country’s second-largest source of electricity generation, and earlier, wind and solar together surpassed nuclear in the UK as momentum built. This is shown in the figure below, with wind (green line, top panel) trading places with nuclear (purple) and gas (dark blue) down around 25% since 2010 but remaining the single-largest source.

 Annual electricity generation in the UK by fuel, terawatt hours, 2010-2019. Top panel: fuel by fuel. Bottom panel: cumulative total generation from all sources. Source: BEIS energy trends, BM Reports and Carbon Brief analysis. Chart by Carbon Brief using Highcharts.
The UK’s currently suspended nuclear plants are due to return to service in January and March, according to operator EDF, the French state-backed utility firm. However, as noted above, most of the UK’s nuclear fleet is set to retire during the 2020s, with only Sizewell B in Suffolk due to still be operating by 2030. Hunterston is scheduled to retire by 2023 and Dungeness by 2028.

Set against these losses, the UK has a pipeline of offshore windfarms, secured via “contracts for difference” with the government, at a series of auctions. The most recent auction, in September 2019, saw prices below £40 per megawatt hour – similar to current wholesale electricity prices.

However, the capacity contracted so far is not sufficient to meet the government’s target of 40GW by 2030, meaning further auctions – or some other policy mechanism – will be required.

Coal zero
As well as the switch between wind and nuclear, 2019 also saw coal fall below solar for the first time across a full year, echoing the 2016 moment when wind outgenerated coal across the UK, after it suffered another 60% reduction in electricity output. Just six coal plants remain in the UK, with Aberthaw B in Wales and Fiddlers Ferry in Cheshire closing in March.

Coal accounted for just 2% of UK generation in 2019, a record-low coal share since centralised electricity supplies started to operate in 1882. The fuel met 40% of UK needs as recently as 2012, but has plummeted thanks to falling demand, rising renewables, cheaper gas and higher CO2 prices.

The reduction in average coal generation hides the fact that the fuel is now often not required at all to meet the UK’s electricity needs. The chart below shows the number of days each year when coal output was zero in 2019 (red line) and the two previous years (blue).

 Cumulative number of days when UK electricity generation from renewable sources has been higher than that from fossil fuels. Source: BEIS energy trends, BM Reports and Carbon Brief analysis. Chart by Carbon Brief using Highcharts.
The 83 days in 2019 with zero coal generation amount to nearly a quarter of the year and include the record-breaking 18-day stretch without the fuel.

Great Britain has been running for a record TWO WEEKS without using coal to generate electricity – the first time this has happened since 1882.

The country’s grid has been coal-free for 45% of hours in 2019 so far.https://www.carbonbrief.org/countdown-to-2025-tracking-the-uk-coal-phase-out …

Coal generation was set for significant reductions around the world in 2019 – including a 20% reduction for the EU as a whole – according to analysis published by Carbon Brief in November.

Notably, overall UK electricity generation fell by another 9TWh in 2019 (3%), bringing the total decline to 58TWh since 2010. This is equivalent to more than twice the output from the Hinkley C scheme being built in Somerset. As Carbon Brief explained last year, falling demand has had a similar impact on electricity-sector CO2 emissions as the increase in output from renewables.

This is illustrated by the fact that the 9TWh reduction in overall generation translated into a 9TWh (6%) cut in fossil-fuel generation during 2019, with coal falling by 10TWh and gas rising marginally.

Increasingly renewable
As fossil-fuel output and overall generation have declined, the UK’s renewable sources of electricity have continued to increase. Their output has risen nearly five-fold in the past decade and their share of the UK total has increased from 7% in 2010 to 37% in 2019.

As a result, the UK’s increasingly renewable grid is seeing more minutes, hours and days during which the likes of wind, solar and biomass collectively outpace all fossil fuels put together, and on some days wind is the main source as well.

The chart below shows the number of days during each year when renewables generated more electricity than fossil fuels in 2019 (red line) and each of the previous four years (blue lines). In total, nearly two-fifths of days in 2019 crossed this threshold.

 Cumulative number of days when the UK has not generated any electricity from coal. Source: BEIS energy trends, BM Reports and Carbon Brief analysis. Chart by Carbon Brief using Highcharts.
There were also four months in 2019 when renewables generated more of the UK’s electricity than fossil fuels: March, August, September and December. The first ever such month came in September 2018 and more are certain to follow.

National Grid, which manages Great Britain’s high-voltage electricity transmission network, is aiming to be able to run the system without fossil fuels by 2025, at least for short periods. At present, it sometimes has to ask windfarm operators to switch off and gas plants to start running in order to keep the electricity grid stable.

Note that biomass accounted for 11% of UK electricity generation in 2019, nearly a third of the total from all renewables. Some two-thirds of the biomass output is from “plant biomass”, primarily wood pellets burnt at Lynemouth in Northumberland and the Drax plant in Yorkshire. The remainder was from an array of smaller sites based on landfill gas, sewage gas or anaerobic digestion.

The CCC says the UK should “move away” from large-scale biomass power plants, once existing subsidy contracts for Drax and Lynemouth expire in 2027.

Using biomass to generate electricity is not zero-carbon and in some circumstances could lead to higher emissions than from fossil fuels. Moreover, there are more valuable uses for the world’s limited supply of biomass feedstock, the CCC says, including carbon sequestration and hard-to-abate sectors with few alternatives.

Methodology
The figures in the article are from Carbon Brief analysis of data from BEIS Energy Trends chapter 5 and chapter 6, as well as from BM Reports. The figures from BM Reports are for electricity supplied to the grid in Great Britain only and are adjusted to include Northern Ireland.

In Carbon Brief’s analysis, the BM Reports numbers are also adjusted to account for electricity used by power plants on site and for generation by plants not connected to the high-voltage national grid. This includes many onshore windfarms, as well as industrial gas combined heat and power plants and those burning landfill gas, waste or sewage gas.

By design, the Carbon Brief analysis is intended to align as closely as possible to the official government figures on electricity generated in the UK, reported in BEIS Energy Trends table 5.1.

Briefly, the raw data for each fuel is in most cases adjusted with a multiplier, derived from the ratio between the reported BEIS numbers and unadjusted figures for previous quarters.

Carbon Brief’s method of analysis has been verified against published BEIS figures using “hindcasting”. This shows the estimates for total electricity generation from fossil fuels or renewables to have been within ±3% of the BEIS number in each quarter since Q4 2017. (Data before then is not sufficient to carry out the Carbon Brief analysis.)

For example, in the second quarter of 2019, a Carbon Brief hindcast estimates gas generation at 33.1TWh, whereas the published BEIS figure was 34.0TWh. Similarly, it produces an estimate of 27.4TWh for renewables, against a BEIS figure of 27.1TWh.

National Grid recently shared its own analysis for electricity in Great Britain during 2019 via its energy dashboard, which differs from Carbon Brief’s figures.


Related News

View more

Sign Up for Electricity Forum’s Newsletter

Stay informed with our FREE Newsletter — get the latest news, breakthrough technologies, and expert insights, delivered straight to your inbox.

Electricity Today T&D Magazine Subscribe for FREE

Stay informed with the latest T&D policies and technologies.
  • Timely insights from industry experts
  • Practical solutions T&D engineers
  • Free access to every issue

Download the 2025 Electrical Training Catalog

Explore 50+ live, expert-led electrical training courses –

  • Interactive
  • Flexible
  • CEU-cerified