BC Hydro COVID-19 Site C updates detail monitoring, self-isolation at the work camp, Northern Health coordination, social distancing, reduced staffing, progress on diversion tunnels, Highway 29 realignment, and public reports to Peace River Regional District.
Key Points
Regular reports on COVID-19 monitoring, isolation protocols, staffing, and Site C work with Northern Health.
✅ Daily updates to Peace River Regional District
✅ Isolation rooms reserved in camp dorms
✅ Construction continues with social distancing
BC Hydro says it will begin giving regular updates to the public and the Peace River Regional District about its monitoring of the coronavirus COVID-19 at Site C, reflecting broader industry alerts such as a U.S. grid warning on pandemic risks.
BC Hydro met with the Peace River Regional District Sunday via phone call to discuss the forthcoming measures.
"We did a make a commitment to provide regular updates to Peace River Regional District member communities on an ongoing basis," said spokesman Dave Conway.
"(It's) certainly one of the things that we heard that they want and we heard that strongly and repeatedly."
Conway said updates could be posted as early as Monday on BC Hydro's website for the project.
As of March 23, there were sixteen people in self-isolation at the work camp just outside Fort St. John. Conway did not know how many of the workers have been tested for the virus, but said there are no confirmed cases on site. Provincial guidelines are being followed, he said.
"If they show any of the following symptoms, so sneezing, sore throat, muscle aches, headaches, coughs, or difficulty breathing, they're isolated for 14 days," Conway said.
"We're being very cautious of our application of the guidelines. We're asking anybody to self isolate if they have any slight symptoms."
BC Hydro has set aside one 30-room dorm at the camp for workers who need to isolate themselves, similar to measures in other jurisdictions where the power industry may house staff on-site to maintain operations, and has another four dorms with another 120 rooms that can be used as necessary. Conway could not immediately say whether additional rooms at hotels or at its apartment block have also been reserved.
There have been 700 workers home since a scale-back in construction was announced on March 18, and more workers are expected to be sent home this week. There were 940 people in camp on March 23, Conway said.
"To put that into perspective, the number of people staying in camp at this time of year, based on previous years, usually averages around 1,700," Conway said.
Brad Sperling, board chair for the Peace River Regional District, said BC Hydro has committed to formulating a strategy over the next few days to keep local government and public informed.
Electoral director Karen Goodings said she was pleased by that, and that it's important to everyone that BC Hydro works with Northern Health and adheres to provincial guidelines.
"The senior governments are critical to what measures will be undertaken not only on the project, including the camp, but also on the rules around transportation of workers and on addressing workplace conduct investigations at other utilities," Goodings wrote in an email.
On Sunday, the Site C leisure bus was seen at Totem Mall with two passengers on board.
Conway said the ongoing use of the shuttle is being monitored and evaluated, and is operating under social distancing and extra cleaning guidelines aligned with public transportation changes that have come under BC Transit.
The bus makes 10 trips per day from the camp, with an average of two passengers per trip, Conway said.
"We still have, of course, people in camp, and it's an opportunity for guests to get out and go for a walk and re-provision themselves for essentials for personal needs," Conway said.
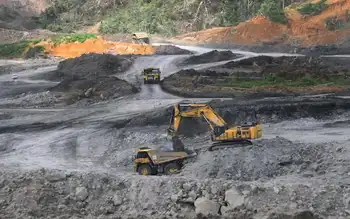
Construction of the river diversion tunnels continues to meet a fall deadline, while work also carries on to realign Highway 29, build the transmission line, and clear the valley and future reservoir. Other site security and environmental monitoring work also continues, as utilities confront a dangerous dam-climbing trend driven by social media.
BC Hydro has said measures have been put into place, amid concerns similar to those voiced by nuclear plant workers about precautions at industrial sites, to minimize the potential spread of the COVID-19 on site, such as closing the camp gym and theatre, eliminating self serve dining stations, as well as non-essential travel, tours, and meetings.
Some workers, however, have raised worries about the tight working conditions on site, noting field safety incidents that highlight risks in the sector.
The province announced Monday 48 new cases in B.C., including one more in the Northern Health region, bringing the region's total to five, while Saskatchewan's numbers show how the crisis has reshaped that province. Their precise whereabouts are not being reported by B.C. public health officials.
Related News