Invenergy sells half of future output to regional power grid

By McClatchy-Tribune


CSA Z462 Arc Flash Training - Electrical Safety Essentials

Our customized live online or in‑person group training can be delivered to your staff at your location.

  • Live Online
  • 6 hours Instructor-led
  • Group Training Available
Regular Price:
$249
Coupon Price:
$199
Reserve Your Seat Today
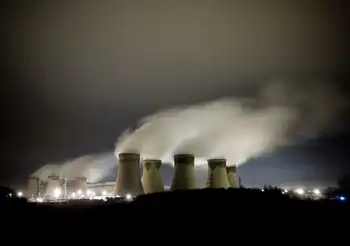
Invenergy has sold about half the output from a proposed natural gas-fired power plant in Burrillville to the New England power grid through an annual auction that wrapped up earlier this week.

Although Independent System Operator New England, the entity that manages the regional electric system, agreed to buy 485 megawatts from what has been dubbed the Clear River Energy Center, that amount falls far short of the facility's total projected generating capacity, which could amount to 1,000 megawatts.

John Niland, director of business development for Chicago-based Invenergy, described ISO-NE's decision to buy power from the proposed facility as a good sign for the $700 million project and said his firm would offer additional capacity in the auctions in coming years as older power plants are retired.

"It demonstrates that there certainly is a need for the project," Niland said in an interview.

But the Conservation Law Foundation, a regional environmental group that opposes the power plant, is pointing to the auction results that were released on Thursday as a signal that Invenergy overestimated the need for the massive new facility, which is currently going through permitting before state regulators.

With a clearing price this year that was 25 percent lower than last year's auction, demand for new generating capacity was not as high as some expected, said Jerry Elmer, a staff attorney in CLF's Providence office.

"That means there's no acute shortage of capacity," Elmer said. "And this plant is not as badly needed as Invenergy is telling the region." Selling power is a critical piece of developing any energy project. Despite selling only a portion of the Burrillville facility's generating capacity, Niland said that financing the project won't be a problem.

He would not say how much power his company offered in the auction and would not comment at length on the clearing price of $7.03 per kilowatt month.

"The price that was set is something that we can live with," he said. ISO-NE buys power three years in advance of when it's needed. The auction that ended on Monday secured capacity for 2019-2020. Of the 34,151 megawatts that was procured, about 1,400 megawatts came from new projects, including the Burrillville plant.

"Developers were drawn to the New England marketplace because the price of capacity supports construction of new resources," Gordon van Welie, president and CEO of ISO-NE, said in a statement.

Related News

U.S. Residents Averaged Fewer Power Outages in 2022

2022 U.S. Power Outage Statistics show lower SAIDI as fewer major events hit, with SAIFI trends, electric reliability, outage duration and frequency shaped by hurricanes, winter storms, vegetation, and utility practices across states.


Key Points

They report SAIDI and SAIFI for 2022, showing outage duration, frequency, and impacts of major weather events.

✅ 2022 SAIDI averaged 5.6 hours; SAIFI averaged 1.4 interruptions.

✅ Fewer major events lowered outage duration versus 2021.

✅ Hurricanes and winter storms drove long outages in several states.


In 2022, U.S. electricity consumers on average experienced about 5.5 hours of power disruptions, a decrease from nearly two hours compared to 2021. This information comes from the latest Annual Electric Power Industry Report. The reduction in yearly power interruptions primarily resulted from fewer significant events in 2022 compared to the previous year, and utility disaster planning continues to support grid resilience as severe weather persists.

Since 2013, excluding major events, the annual average duration of power interruptions has consistently hovered around two hours. Factors contributing to major power disruptions include weather-related incidents, vegetation interference near power lines, and specific utility practices, while pandemic-related grid operations influenced workforce planning more than outage frequency. To assess the reliability of U.S. electric utilities, two key indexes are utilized:

  • The System Average Interruption Duration Index (SAIDI) calculates the total length (in hours) an average customer endures non-brief power interruptions over a year.
  • The System Average Interruption Frequency Index (SAIFI) tracks the number of times interruptions occur.

The influence of major events on electrical reliability is gauged by comparing affected states' SAIDI and SAIFI values against the U.S. average, which was 5.6 hours of outages and 1.4 outages per customer in 2022. The year witnessed 18 weather-related disasters in the U.S., each resulting in over $1 billion in damages, and COVID-19 grid assessments indicated the electricity system was largely safe from pandemic impacts. Noteworthy major events include:

  • Hurricane Ian in September 2022, leaving over 2.6 million Floridian customers without electricity, with restoration in some areas taking weeks rather than days.
  • Hurricane Nicole in November 2022, causing over 300,000 Florida customers to lose power.
  • Winter Storm Elliott in December 2022, affecting over 1.5 million customers in multiple states including Texas where utilities struggled after Hurricane Harvey to restore service, and Florida, and bringing up to four feet of snow in parts of New York.

In 2022, states like Florida, West Virginia, Maine, Vermont, and New Hampshire experienced the most prolonged power interruptions, with New Hampshire averaging 10.3 hours and Florida 19.1 hours, and FPL's Irma storm response illustrates how restoration can take days or weeks in severe cases. Conversely, the District of Columbia, Delaware, Rhode Island, Nebraska, and Iowa had the shortest total interruptions, with the District of Columbia averaging just 34 minutes and Iowa 85 minutes.

The frequency of outages, unlike their duration, is more often linked to non-major events. Across the nation, Alaska recorded the highest number of power disruptions per customer (averaging 3.5), followed by several heavily forested states like Tennessee and Maine. Power outages due to falling tree branches are common, particularly during winter storms that burden tree limbs and power lines, as seen in a North Seattle outage affecting 13,000 customers. The District of Columbia stood out with the shortest and fewest outages per customer.


Related News

View more

Fuel Cell Electric Buses Coming to Mississauga

Mississauga Fuel Cell Electric Buses advance zero-emission public transit, leveraging hydrogen fuel cells, green hydrogen supply, rapid refueling, and extended range to cut GHGs, improve air quality, and modernize sustainable urban mobility.


Key Points

Hydrogen fuel cell buses power electric drivetrains for zero-emission service, long range, and quick refueling.

✅ Zero tailpipe emissions improve urban air quality

✅ Longer route range than battery-electric buses

✅ Hydrogen fueling is rapid, enabling high uptime


Mississauga, Ontario, is gearing up for a significant shift in its public transportation landscape with the introduction of fuel cell electric buses (FCEBs). This initiative marks a pivotal step toward reducing greenhouse gas emissions and enhancing the sustainability of public transport in the region. The city, known for its vibrant urban environment and bustling economy, is making strides to ensure that its transit system evolves in harmony with environmental goals.

The recent announcement highlights the commitment of Mississauga to embrace clean energy solutions. The integration of FCEBs is part of a broader strategy to modernize the transit fleet while tackling climate change. As cities around the world seek to reduce their carbon footprints, Mississauga’s initiative aligns with global trends toward greener urban transport, where projects like the TTC battery-electric buses demonstrate practical pathways.

What are Fuel Cell Electric Buses?

Fuel cell electric buses utilize hydrogen fuel cells to generate electricity, which powers the vehicle's electric motor. Unlike traditional buses that run on diesel or gasoline, FCEBs produce zero tailpipe emissions, making them an environmentally friendly alternative. The only byproducts of their operation are water and heat, significantly reducing air pollution in urban areas.

The technology behind FCEBs is becoming increasingly viable as hydrogen production becomes more sustainable. With the advancement of green hydrogen production methods, which use renewable energy sources to create hydrogen, and because some electricity in Canada still comes from fossil fuels, the environmental benefits of fuel cell technology are further amplified. Mississauga’s investment in these buses is not only a commitment to cleaner air but also a boost for innovative technology in the transportation sector.

Benefits for Mississauga

The introduction of FCEBs is poised to offer numerous benefits to the residents of Mississauga. Firstly, the reduction in greenhouse gas emissions aligns with the city’s climate action goals and complements Canada’s EV goals at the national level. By investing in cleaner public transit options, Mississauga is taking significant steps to improve air quality and combat climate change.

Moreover, FCEBs are known for their efficiency and longer range compared to battery electric buses, such as the Metro Vancouver fleet now operating across the region, commonly used in Canadian cities. This means they can operate longer routes without the need for frequent recharging, making them ideal for busy transit systems. The use of hydrogen fuel can also result in shorter fueling times compared to electric charging, enhancing operational efficiency.

In addition to environmental and operational advantages, the introduction of these buses presents economic opportunities. The deployment of FCEBs can create jobs in the local economy, from maintenance to hydrogen production facilities, similar to how St. Albert’s electric buses supported local capabilities. This aligns with broader trends of sustainable economic development that prioritize green jobs.

Challenges Ahead

While the potential benefits of FCEBs are clear, the transition to this technology is not without its challenges. One of the main hurdles is the establishment of a robust hydrogen infrastructure. To support the operation of fuel cell buses, Mississauga will need to invest in hydrogen production, storage, and fueling stations, much as Edmonton’s first electric bus required dedicated charging infrastructure. Collaboration with regional and provincial partners will be crucial to develop this infrastructure effectively.

Additionally, public acceptance and awareness of hydrogen technology will be essential. As with any new technology, there may be skepticism regarding safety and efficiency. Educational campaigns will be necessary to inform the public about the advantages of FCEBs and how they contribute to a more sustainable future, and recent TTC’s battery-electric rollout offers a useful reference for outreach efforts.

Looking Forward

As Mississauga embarks on this innovative journey, the introduction of fuel cell electric buses signifies a forward-thinking approach to public transportation. The city’s commitment to sustainability not only enhances its transit system but also sets a precedent for other municipalities to follow.

In conclusion, the shift towards fuel cell electric buses in Mississauga exemplifies a significant leap toward greener public transport. With ongoing efforts to tackle climate change and improve urban air quality, Mississauga is positioning itself as a leader in sustainable transit solutions. The future looks promising for both the city and its residents as they embrace cleaner, more efficient transportation options. As this initiative unfolds, it will be closely watched by other cities looking to implement similar sustainable practices in their own transit systems.


Related News

View more

Why Nuclear Fusion Is Still The Holy Grail Of Clean Energy

Nuclear fusion breakthrough signals progress toward clean energy as NIF lasers near ignition and net energy gain, while tokamak designs like ITER advance magnetic confinement, plasma stability, and self-sustaining chain reactions for commercial reactors.


Key Points

A milestone as lab fusion nears ignition and net gain, indicating clean energy via lasers and tokamak confinement.

✅ NIF laser shot approached ignition and triggered self-heating

✅ Tokamak path advances with ITER and stronger magnetic confinement

✅ Net energy gain remains the critical milestone for power plants


Just 100 years ago, when English mathematician and astronomer Arthur Eddington suggested that the stars power themselves through a process of merging atoms to create energy, heat, and light, the idea was an unthinkable novelty. Now, in 2021, we’re getting remarkably close to recreating the process of nuclear fusion here on Earth. Over the last century, scientists have been steadily chasing commercial nuclear fusion, ‘the holy grail of clean energy.’ The first direct demonstration of fusion in a lab took place just 12 years after it was conceptualized, at Cambridge University in 1932, followed by the world’s first attempt to build a fusion reactor in 1938. In 1950, Soviet scientists Andrei Sakharov and Igor Tamm propelled the pursuit forward with their development of the tokamak, a fusion device involving massive magnets which is still at the heart of many major fusion pursuits today, including the world’s biggest nuclear fusion experiment ITER in France.

Since that breakthrough, scientists have been getting closer and closer to achieving nuclear fusion. While fusion has indeed been achieved in labs throughout this timeline, it has always required far more energy than it emits, defeating the purpose of the commercial fusion initiative, and elsewhere in nuclear a new U.S. reactor start-up highlights ongoing progress. If unlocked, commercial nuclear fusion would change life as we know it. It would provide an infinite source of clean energy requiring no fossil fuels and leaving behind no hazardous waste products, and many analysts argue that net-zero emissions may be out of reach without nuclear power, underscoring fusion’s promise.

Nuclear fission, the process which powers all of our nuclear energy production now, including next-gen nuclear designs in development, requires the use of radioactive isotopes to achieve the splitting of atoms, and leaves behind waste products which remain hazardous to human and ecological health for up to tens of thousands of years. Not only does nuclear fusion leave nothing behind, it is many times more powerful. Yet, it has remained elusive despite decades of attempts and considerable investment and collaboration from both public and private entities, such as the Gates-backed mini-reactor concept, around the world.

But just this month there was an incredible breakthrough that may indicate that we are getting close. “For an almost imperceptible fraction of a second on Aug. 8, massive lasers at a government facility in Northern California re-created the power of the sun in a tiny hot spot no wider than a human hair,” CNET reported in August. This breakthrough occurred at the National Ignition Facility, where scientists used lasers to set off a fusion reaction that emitted a stunning 10 quadrillion watts of power. Although the experiment lasted for just 100 trillionths of a second, the amount of energy it produced was equal to about “6% of the total energy of all the sunshine striking Earth’s surface at any given moment.”

“This phenomenal breakthrough brings us tantalizingly close to a demonstration of ‘net energy gain’ from fusion reactions — just when the planet needs it,” said Arthur Turrell, physicist and nuclear fusion expert. What’s more, scientists and experts are hopeful that the rate of fusion breakthroughs will continue to speed up, as interest in atomic energy is heating up again across markets, and commercial nuclear fusion could be achieved sooner than ever seemed possible before. At a time when it has never been more important or more urgent to find a powerful and affordable means of producing clean energy, and as policies like the U.K.’s green industrial revolution guide the next waves of reactors, commercial nuclear fusion can’t come fast enough.


Related News

View more

Energy-insecure households in the U.S. pay 27% more for electricity than others

Community Solar for Low-Income Homes expands energy equity by delivering renewable energy access, predictable bill savings, and tax credit benefits to renters and energy-insecure households, accelerating distributed generation and storage adoption nationwide.


Key Points

A program model enabling renters and LMI households to subscribe to off-site solar and save on utility bills.

✅ Earn bill credits from shared solar generation.

✅ Expands access for renters and LMI subscribers.

✅ Often paired with storage and IRA tax credit adders.


On a square-foot basis, the issue of inequality is made worse by higher costs for energy usage in the nation. Efforts like community solar programs such as Maryland community solar are underway to boost low-income participation in the cost benefits of renewable energy.

The Energy Information Administration (EIA) shows that households that are considered energy insecure, or those that have the inability to adequately meet basic household energy costs, are paying more for electricity than their wealthier counterparts. 

On average in the United States in 2020, households were billed about $1.04 per square foot for all energy sources. For homes that did not report energy insecurity, that average was $0.98 per square foot, while homes with energy insecurity issues paid an average of $1.24 per square foot for energy. This means that U.S. residents that need the most support on their energy bills are stuck with costs 27% higher than their neighbors on square-foot-basis.

EIA said energy-insecure households have reduced or forgone basic necessities to pay energy bills, kept their houses at unsafe temperatures because of energy cost concerns, or been unable to repair heating or cooling equipment because of cost.

In 2020, households with income less than $10,000 a year were billed an average of $1.31 per square foot for energy, while households making $100,000 or more were billed an average of $0.96 per square foot, said EIA. Renters paid considerably more ($1.28 per square foot) than owners ($0.98 per square foot). There were also considerable differences between regions, with New England solar growth sparking grid upgrade debates, ethnic groups and races, and insulation levels, as seen below.

The energy transition toward renewables like solar has offered price stability, amid record solar and storage growth nationwide, but thus far energy-insecure communities have relatively been left behind. A recent Berkeley Lab report, Residential Solar-Adopter Income and Demographic Trends, indicates that even though the rate of solar adoption among low-income residents is increasing (from 5% in 2010 to 11% in 2021), that segment of energy consumers remains under-represented among solar adopters, relative to its share of the population.


Community solar efforts

As such, the United States is targeting communities most impacted by energy costs that have not benefitted from the transition, highlighting “Energy Communities” that are eligible for an additional 10% tax credit through funds made possible by the Inflation Reduction Act.

Additionally, a push for community solar development is taking place nationwide to extend access to affordable solar energy to renters and other residents that aren’t able to leverage finances to invest in predictable, low-cost residential solar systems. The Biden Administration set a goal this year to sign up 5 million community solar households, achieving $1 billion in bill savings by 2025. The community solar model only represents about 8% of the total distributed solar capacity in the nation. This target would entail a jump from 3 GW installed capacity to 20 GW by the target year. The Department of Energy estimates community solar subscribers save an average of 20% on their bills.

California this year passed AB 2316, the Community Renewable Energy Act takes aim at four acute problems in the state’s power market: reliability amid rising outage risks, rates, climate and equity. The law creates a community renewable energy program, including community solar-plus-storage, supported by cheaper batteries, to overcome access barriers for nearly half of Californians who rent or have low incomes. Community solar typically involves customers subscribing to an off-site solar facility, receiving a utility bill credit for the power it generates.

“Community renewable energy is a proven powerful tool to help close California’s clean energy gap, bringing much needed relief to millions struggling with high housing costs and utility debt,” said Alexis Sutterman, energy equity program manager at the California Environmental Justice Alliance.

The program has energy equity baked into its structure, working to make sure Californians of all income levels participate in the benefits of the energy transition. Not only does it open solar access to renters, the law ensures that at least 51% of subscribers are low-income customers, which is expected to make projects eligible for a 10% tax credit adder under the IRA.

“The money’s on the table now,” said Jeff Cramer, president and chief executive of the Coalition for Community Solar Access. “While there are groups pushing for solar access for all, and states with strong legislation, there are other pockets of interest in surprising places in the United States. For example, Louisiana has no policy for community solar or support for low-income residents going solar but the city of New Orleans has its own utility commission with a community solar program. In Nebraska, forward-looking co-operatives have created community solar projects.

Community solar markets are active in 22 states, with more expected to come online in the future as states pursue 100% clean energy targets across the country. However, the market is expected to require strong community outreach efforts to foster trust and gain subscribers.

“There is a distrust of community solar initially in LMI communities as many have been burned before by retail energy false promises,” said Eric LaMora, executive director, community solar, Nautilus Solar on a panel at the Solar Energy Industries Association Finance, Tax, and Buyers seminar. “People are suspicious but there really are no hooks with community solar.”

LMI residents are leery to provide tax records or much documents at all in order to sign up for community solar, LaMora said. “We were surprised to see less of a default rate with LMI residents. We attribute this to the fact that they see significant savings on their electric bill, making it easier to pay each month,” he said.


Related News

View more

UK price cap on household energy bills expected to cost 89bn

UK Energy Price Guarantee Cost forecasts from Cornwall Insight suggest an £89bn bill, tied to wholesale gas prices, OBR projections, and fiscal policy, to shield households amid the cost of living crisis.


Key Points

It is the projected government spend to cap household bills, driven by wholesale gas prices and OBR market forecasts.

✅ Base case: £89bn over two years, per Cornwall Insight

✅ Range: £72bn to £140bn, volatile wholesale gas costs

✅ Excludes 6-month business support estimated at £22bn-£48bn


Liz Truss’s intervention to freeze energy prices for households for two years is expected to cost the government £89bn, according to the first major costing of the policy by the sector’s leading consultancy.

The analysis from Cornwall Insight, seen exclusively by the Guardian, shows the prime minister’s plan to tackle the cost of living crisis could cost as much as £140bn in a worst-case scenario.

Truss announced in early September that the average annual bill for a typical household would be capped at £2,500 to protect consumers from the intensifying cost of living crisis amid high winter energy costs and a scheduled 80% rise in the cap to £3,549.

The ultimate cost of the policy is uncertain as it is highly dependent on the wholesale cost of gas, including UK natural gas prices which have soared since Russia’s invasion of Ukraine put a squeeze on already-volatile international markets. Ballpark projections had put the cost anywhere from £100bn to £150bn.

The Office for Budget Responsibility is expected to give its forecast for the bill when it provides its independent assessment of Kwasi Kwarteng’s medium-term fiscal plan, which the chancellor said on Tuesday would still happen on 23 November despite previous reports that it would be brought forward.

Cornwall Insight analysed projections of wholesale market moves to cost the intervention. In its base case scenario, analysts expect the policy to cost £89bn. That assumes the cost of supporting each household would be just over £1,000 in the first year, and about £2,000 in the second year.

The study’s authors said the wholesale price of gas would be influenced by energy demand, the severity of weather, “geo-political uncertainty” and prices for liquified natural gas as Europe seeks to refill storage facilities, which countries have rushed to fill up this winter but which could be relatively empty by next spring.

In the best-case outcome, the policy would cost £72bn, with some projections pointing to a 16% decrease in energy bills in April for households, while the “extreme high” outlook would see the government shell out £140bn to protect 29m UK households.

Gas prices are expected to push even higher if the Kremlin decides to completely cut off Russian gas exports into Europe.

Cornwall Insight’s projection does not include a separate six-month initiative to cap costs for companies, charities and public sector organisations, which is forecast to cost £22bn to £48bn.

The consultancy’s chief executive, Gareth Miller, said the £70bn range in its forecasts reflected “a febrile wholesale market continuing to be beset by geopolitical instability, sensitivity to demand, weather and infrastructure resilience”.

He said: “Fortune befriends the bold, but it also favours the prepared. The large uncertainties around commodity markets over the next two years means that the government could get lucky with costs coming out at the low end of the range, but the opposite could also be true.

“In each case, the government may find itself passengers to circumstances outside its control, having made policy that is a hostage to surprises, events and volatile factors. That’s a difficult position to be in.”

Privacy Notice: Newsletters may contain info about charities, online ads, and content funded by outside parties. For more information see our Privacy Policy. We use Google reCaptcha to protect our website and the Google Privacy Policy and Terms of Service apply.
The government has faced criticism, as some British MPs urge tighter limits on prices, that the policy is effectively a “blank cheque” and is not targeted at the most vulnerable in society.

Concerns over how Truss and Kwarteng intend to fund a series of measures, including the price guarantee, have spooked financial markets.

The EU, which has outlined possible gas price cap strategies in recent proposals, said last week it planned to cap the revenues of low-carbon electricity generators at €180 a megawatt hour, which is less than half current market prices. Truss has so far resisted calls to extend a levy on North Sea oil and gas operators to electricity generators, who have benefited from a link between gas and electricity prices in Britain.

Truss hopes to strike voluntary long-term deals with generators including Centrica and EDF, alongside the government’s Energy Security Bill measures, to bring down wholesale prices.

The Financial Times reported on Tuesday that the government has threatened companies with legislation to cap their revenues if voluntary deals cannot be agreed.


Related News

View more

Seven small UK energy suppliers must pay renewables fees or risk losing licence

Ofgem Renewables Obligations drive supplier payments for renewables fees, feed-in tariffs, and renewable generation, with non-payment risking supply licences amid the price cap and volatile wholesale prices across the UK energy market.


Key Points

Mandatory payments by suppliers funding renewables via feed-in tariffs; non-payment can trigger supply licence revoking.

✅ Covers Renewables Obligation and Feed-in Tariff scheme compliance.

✅ Non-payment can lead to Ofgem action and licence loss.

✅ Affected by price cap and wholesale price volatility.


Seven small British energy suppliers owe a total of 34 million pounds ($43.74 million) in renewables fees, amid a renewables backlog that has stalled projects, and could face losing their supply licences if they cannot pay, energy regulator Ofgem reports.

Under Britain’s energy market rules, suppliers of energy must meet so-called renewables obligations and feed-in tariffs, including households' ability to sell solar power back to energy firms, which are imposed on them by the government to help fund renewable power generation.

Several small energy companies have gone bust over the past two years, a trend echoed by findings from a global utility study on renewable priorities, as they struggled to pay the renewables fees and as their profits were affected by a price cap on the most commonly used tariffs and fluctuating wholesale prices, even as a 10 GW contract brings new renewable capacity onto the UK grid.

Ofgem has called on the companies to make necessary payments by Oct. 31, as moves to offer community-generated power to all UK customers progress.

“If they do not pay Ofgem could start the process of revoking their licences to supply energy,” it said in a statement, as offshore wind power continues to scale nationwide.

The seven suppliers are, amid debates over clean energy impacts, Co-Operative Energy Limited; Flow Energy Limited; MA Energy Limited; Nabuh Energy Limited; Robin Hood Energy Limited; Symbio Energy Limited and Tonik Energy Limited. ($1 = 0.7773 pounds)


Related News

View more

Sign Up for Electricity Forum’s Newsletter

Stay informed with our FREE Newsletter — get the latest news, breakthrough technologies, and expert insights, delivered straight to your inbox.

Electricity Today T&D Magazine Subscribe for FREE

Stay informed with the latest T&D policies and technologies.
  • Timely insights from industry experts
  • Practical solutions T&D engineers
  • Free access to every issue

Download the 2025 Electrical Training Catalog

Explore 50+ live, expert-led electrical training courses –

  • Interactive
  • Flexible
  • CEU-cerified