Third exec at Enron pleads guilty

By San Francisco Chronicle


Substation Relay Protection Training

Our customized live online or in‑person group training can be delivered to your staff at your location.

  • Live Online
  • 12 hours Instructor-led
  • Group Training Available
Regular Price:
$699
Coupon Price:
$599
Reserve Your Seat Today
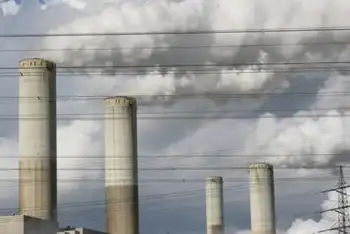
The Enron Corp. energy trader who devised the notorious "Death Star" scheme to bill California for fictitious electricity pleaded guilty in a San Francisco court to a federal fraud charge and admitted plotting to manipulate the market during the state's energy crisis.

John Forney, 42, of Upper Arlington, Ohio, is the third former Enron executive to admit lawbreaking during the 2000-01 power shortages and price spikes that led to rolling blackouts and multibillion-dollar rate increases. He faces up to five years in prison.

Timothy Belden, Forney's former boss at Enron's West Coast power trading office in Portland, and Jeffrey Richter, another top Enron trader, are awaiting sentencing for fraud. Both talked to federal agents about Forney and identified him as a chief strategist, according to court documents.

"We have now obtained convictions of the top three Enron executives most directly responsible for manipulating the energy markets in California at a time unique in our history, when the lights were going off and the grid was in danger of shutting down,'' said Kevin Ryan, U.S. attorney in San Francisco. "These executives will now be required to help obtain restitution for the same victims they defrauded, namely the citizens of California and the other Western states."

But California has had little success recouping energy overcharges for its consumers, largely because of limits on reimbursement imposed by the Federal Energy Regulatory Commission.

State Attorney General Bill Lockyer sued Enron in June for damages allegedly caused by commodities fraud and unfair competition. Forney's plea agreement requires him to cooperate with Lockyer and with federal prosecutors looking into Enron and other companies.

"We are obviously interested in sitting down and having a good heart-to-heart with Mr. Forney to see what he may have to add to our body of evidence,'' said Lockyer spokesman Tom Dresslar.

Forney's attorney, Edwin Prather, said the plea agreement was "an opportunity for John to help right the wrongs that he helped create'' and to help the government in "understanding the bigger problem of misdeeds of the energy industry."

He said Forney had nothing to do with the case against former Enron Chairman Kenneth Lay, indicted last month on fraud charges connected to the Houston-based company's collapse in late 2001.

Forney joined Enron in 1993 as a low-level generation unit manager, then moved into the company's expanding field of energy trading, where he thrived. He was assigned in 1997 to the Portland office, which handled California power trading under the state's ill-fated electricity deregulation law, and became manager of the real-time trading desk in 1999.

That desk, according to federal prosecutors, hatched the colorfully named schemes -- like "Death Star,'' "Get Shorty'' and "Ricochet'' -- that cheated consumers, fooled state overseers and generated profit increases of as much as 1,500 percent in two years.

Forney said recently that he was the author of "Death Star," which was also known within Enron as Forney's Perpetual Loop. Company traders created the appearance of congestion on the California power grid, then collected a premium price from the state for relieving congestion and delivering electricity where it was needed; in fact, that electricity was looped through transmission lines outside the state and never delivered anywhere.

"Enron purported to move electricity in directions that would relieve congestion, when in fact the electricity was scheduled to flow in a circular pattern,'' Forney said in his plea agreement. He said the California Independent System Operator, which managed the grid, was unable to detect the pattern.

Evidence of such manipulation was starkly illustrated in June when audiotapes of conversations between Enron traders in Portland were released during a legal case in Washington state.

"If the line's not congested, then I just look if I can congest it," one trader said during an August 2000 phone call. "If you can congest it, that's a moneymaker no matter what."

In another taped call, in November 2000, two Enron traders chortled about fleecing "Grandma Millie'' and "those poor grandmothers in California."

Forney's plea agreement also acknowledged a role in "Ricochet,'' in which Enron bought price-capped electricity from the California market and then resold it to California at a price above the cap.

In a quietly arranged appearance before U.S. District Judge Martin Jenkins in San Francisco, Forney pleaded guilty to a single count of conspiring to commit wire fraud, and the government agreed to drop 10 other charges contained in a grand jury indictment last December.

Prather, Forney's attorney, said the plea agreement does not specify a sentence, but Forney hopes for a recommendation of leniency based on his cooperation.

Related News

Manitoba Hydro's burgeoning debt surpasses $19 billion

Manitoba Hydro Debt Load surges past $19.2B as the Crown corporation faces shrinking net income, restructuring costs, and PUB rate decisions, driven by Bipole III, Keeyask construction, aging infrastructure, and rising interest rate risks.


Key Points

Manitoba Hydro Debt Load refers to the utility's escalating borrowings exceeding $19B, pressuring rates and finances.

✅ Debt rose to $19.2B; projected near $25B within five years.

✅ Major drivers: Bipole III, Keeyask, aging assets, restructuring.

✅ Rate hikes sought; PUB approved 3.6% vs 7.9% request.


Manitoba Hydro's debt load now exceeds $19 billion as the provincial Crown corporation grapples with a shrinking net income amid ongoing efforts to slay costs.

The utility's annual report, to be released publicly on Tuesday, also shows its total consolidated net income slumped from $71 million in 2016-2017 to $37 million in the last fiscal year, mirroring a Hydro One profit drop as electricity revenue fell.

It said efforts to restructure the utility and reduce costs are partly to blame for the $34 million drop in year-over-year income.

These earnings come nowhere close, however, to alleviating Hydro's long-term debt problem, a dynamic also seen in a BC Hydro deferred costs report about customer exposure. The figure is pegged at $19.2 billion this fiscal year, up from $16.1 billion the previous year and $14.2 billion in 2016.

The utility projects its debt will grow to about $25 billion in the next five years. Its largest expenses include finishing the Bipole III line, working on the Keeyask Generating System that is halfway done and rebuilding aging wood poles and substations, the report said.

"This level of debt increases the potential financial exposure from risks facing the corporation and is a concern for both

the corporation and our customers who may be exposed to higher rate increases in the event of rising interest rates, a prolonged drought or a major system failure," outgoing president and CEO Kelvin Shepherd wrote.

The income drop is primarily a result of the $50 million spent in the form of restructuring charges associated with the utility's efforts to streamline the organization and drive down costs, amid NDP criticism of Hydro changes related to government policy.

Those efforts included the implementation of buyouts for employees through what the utility dubbed its "voluntary departure program."

Among the changes, Manitoba Hydro reduced its workforce by 800 employees, which is expected to save the utility over $90 million per year. It also reduced its management positions by 26 per cent, a Monday news release said, while Hydro One leadership upheaval in Ontario drove its shares down during comparable governance turmoil.

To improve its financial situation, Hydro has applied for rate increases, even as the Consumers Coalition pushes to have the proposal rejected. The Public Utilities Board offered a 3.6 per cent average rate hike, instead of the 7.9 per cent jump the utility asked for.

In May, when the PUB rendered its decision, it made several recommendations as an alternative to raising rates, including receiving a share of carbon tax revenue and asking the government to help pay for Bipole III.

Hydro is projecting a net income of $70 million for 2018-2019, which includes the impact of the recent rate increase. That total reflects an approximately 20 per cent reduction in net income from 2017-18 after restructuring costs are calculated.


Related News

View more

Powering Towards Net Zero: The UK Grid's Transformation Challenge

UK Electricity Grid Investment underpins net zero, reinforcing transmission and distribution networks to integrate wind, solar, EV charging, and heat pumps, while Ofgem balances investor returns, debt risks, price controls, resilience, and consumer bills.


Key Points

Capital to reinforce grids for net zero, integrating wind, solar, EVs and heat pumps while balancing returns and bills.

✅ 170bn-210bn GBP by 2050 to reinforce cables, pylons, capacity.

✅ Ofgem to add investability metric while protecting consumers.

✅ Integrates wind, solar, EVs, heat pumps; manages grid resilience.


Prime Minister Sunak's recent upgrade to his home's electricity grid, designed to power his heated swimming pool, serves as a microcosm of a much larger challenge facing the UK: transforming the nation's entire electricity network for net zero emissions, amid Europe's electrification push across the continent.

This transition requires a monumental £170bn-£210bn investment by 2050, earmarked for reinforcing and expanding onshore cables and pylons that deliver electricity from power stations to homes and businesses. This overhaul is crucial to accommodate the planned switch from fossil fuels to clean energy sources - wind and solar farms - powering homes with electric cars, as EV demand on the grid rises, and heat pumps.

The UK government's Climate Change Committee warns of potentially doubled electricity demand by 2050, the target date for net zero, even though managing EV charging can ease local peaks. This translates to a significant financial burden for companies like National Grid, SSE, and Scottish Power who own the main transmission networks and some regional distribution networks.

Balancing investor needs for returns and ensuring affordable energy bills for consumers presents a delicate tightrope act for regulators like Ofgem. The National Audit Office criticized Ofgem in 2020 for allowing network owners excessive returns, prompting concerns about potential bill hikes, especially after lessons from 2021 reshaped market dynamics.

Think-tank Common Wealth reported that distribution networks paid out a staggering £3.6bn to their owners between 2017 and 2021, raising questions about the balance between profitability and affordability, amid UK EV affordability concerns among consumers.

However, Ofgem acknowledges the need for substantial investment to finance network upgrades, repairs, and the clean energy transition. To this end, they are considering incorporating an "investability" metric, recognizing how big battery rule changes can erode confidence elsewhere, in the next price controls for transmission networks, ensuring these entities remain attractive for equity fundraising without overburdening consumers.

This proposal, while welcomed by the industry, has drawn criticism from consumer advocacy groups like Citizens Advice, who fear it could contribute to unfairly high bills. With energy bills already hitting record highs, public trust in the net-zero transition hinges on ensuring affordability.

High debt levels and potential credit rating downgrades further complicate the picture, potentially impacting companies' ability to raise investment funds. Ofgem is exploring measures to address this, such as stricter debt structure reporting requirements for regional distribution companies.

Lawrence Slade, CEO of the Energy Networks Association, emphasizes the critical role of investment in achieving net zero. He highlights the need for "bold" policies and regulations that balance ambitious goals with investor confidence and ensure efficient resource allocation, drawing on B.C.'s power supply challenges as a cautionary example.

The challenge lies in striking a delicate balance between attracting investment, ensuring network resilience, and maintaining affordable energy bills. As Andy Manning from Citizens Advice warns, "Without public confidence, net zero won't be delivered."

The UK's journey to net zero hinges on navigating this complex landscape. By carefully calibrating regulations, fostering investor confidence, and prioritizing affordability, the country can ensure its electricity grid is not just robust enough to power heated swimming pools, but also a thriving green economy for all.


Related News

View more

Macron: France, Germany to provide each other with gas, electricity, to weather crisis

France-Germany Energy Solidarity underscores EU energy crisis cooperation: gas supply swaps, electricity imports, price cap talks, and curbs on speculation as Russian pipeline flows halt and winter demand rises across the bloc.


Key Points

A pact where France sends gas to Germany as Germany supplies power, bolstering EU cooperation and winter security.

✅ Gas to Germany; power to France amid nuclear outages.

✅ EU price cap, anti-speculation, joint gas purchasing.

✅ No new Spain-France pipeline unless case improves.


France will send gas to Germany if needed while Germany stands ready to provide it with electricity, President Emmanuel Macron said on Monday, saying this showcased European solidarity in the face of the energy crisis stemming from the war in Ukraine, which many view as a wake-up call to ditch fossil fuels across the bloc.

European gas prices surged, share prices slid and the euro sank on Monday after Russia stopped pumping gas via a major supply route, and Germany's 200 billion euro package sought to cushion the blow, in another warning to the 27-nation EU as it scrambled to respond to the crisis ahead of winter. read more

"Germany needs our gas and we need power from the rest of Europe, notably Germany," France's president told a news conference as EU electricity reform remains under debate following a phone call with German Chancellor Olaf Scholz.

The necessary connections for France to deliver gas to Germany when needed would be finalised in the coming weeks, he said, adding that France, which had long been a net exporter of electricity, will need help from its neighbours because of technical problems its nuclear plants face. read more

Macron, however, said that he did not understand demand for a third gas link between France and Spain, rejecting calls to increase capacity with a new pipeline.

He added he was open to changing his mind on that point, especially as Germany's utility troubles deepen, should Scholz or Prime Minister Pedro Sanchez argue convincingly for it.

Ahead of a meeting on Friday of EU energy ministers, Macron said France was in favour of buying gas at a European rather than a national level, as emergency electricity measures are weighed, and called for European Union measures to control energy prices.

He said it was necessary to act against speculation on energy prices at EU level, as the EU outlines possible gas price cap strategies for discussion, and also said France was in favour of putting a cap on the price of pipeline Russian gas.

Macron also repeated calls for all to turn down air conditioners when it's hot and to limit heating to 19 degrees Celsius this winter, noting that rolling back electricity prices is tougher than it appears this year.

"Everyone has to do their bit," he said.


Related News

View more

Which of the cleaner states imports dirty electricity?

Hourly Electricity Emissions Tracking maps grid balancing areas, embodied emissions, and imports/exports, revealing carbon intensity shifts across PJM, ERCOT, and California ISO, and clarifying renewable energy versus coal impacts on health and climate.


Key Points

An hourly method tracing generation, flows, and embodied emissions to quantify carbon intensity across US balancing areas.

✅ Hourly traces of imports/exports and generation mix

✅ Consumption-based carbon intensity by balancing area

✅ Policy insights for renewables, coal, health costs


In the United States, electricity generation accounts for nearly 30% of our carbon emissions. Some states have responded to that by setting aggressive renewable energy standards; others are hoping to see coal propped up even as its economics get worse. Complicating matters further is the fact that many regional grids are integrated, and as America goes electric the stakes grow, meaning power generated in one location may be exported and used in a different state entirely.

Tracking these electricity exports is critical for understanding how to lower our national carbon emissions. In addition, power from a dirty source like coal has health and environment impacts where it's produced, and the costs of these aren't always paid by the parties using the electricity. Unfortunately, getting reliable figures on how electricity is produced and where it's used is challenging, even for consumers trying to find where their electricity comes from in the first place, leaving some of the best estimates with a time resolution of only a month.

Now, three Stanford researchers—Jacques A. de Chalendar, John Taggart, and Sally M. Benson—have greatly improved on that standard, and they have managed to track power generation and use on an hourly basis. The researchers found that, of the 66 grid balancing areas within the United States, only three have carbon emissions equivalent to our national average, and they have found that imports and exports of electricity have both seasonal and daily changes. de Chalendar et al. discovered that the net results can be substantial, with imported electricity increasing California's emissions/power by 20%.

Hour by hour
To figure out the US energy trading landscape, the researchers obtained 2016 data for grid features called balancing areas. The continental US has 66 of these, providing much better spatial resolution on the data than the larger grid subdivisions. This doesn't cover everything—several balancing areas in Canada and Mexico are tied in to the US grid—and some of these balancing areas are much larger than others. The PJM grid, serving Pennsylvania, New Jersey, and Maryland, for example, is more than twice as large as Texas' ERCOT, in a state that produces and consumes the most electricity in the US.

Despite these limitations, it's possible to get hourly figures on how much electricity was generated, what was used to produce it, and whether it was used locally or exported to another balancing area. Information on the generating sources allowed the researchers to attach an emissions figure to each unit of electricity produced. Coal, for example, produces double the emissions of natural gas, which in turn produces more than an order of magnitude more carbon dioxide than the manufacturing of solar, wind, or hydro facilities. These figures were turned into what the authors call "embodied emissions" that can be traced to where they're eventually used.

Similar figures were also generated for sulfur dioxide and nitrogen oxides. Released by the burning of fossil fuels, these can both influence the global climate and produce local health problems.

Huge variation
The results were striking. "The consumption-based carbon intensity of electricity varies by almost an order of magnitude across the different regions in the US electricity system," the authors conclude. The low is the Bonneville Power grid region, which is largely supplied by hydropower; it has typical emissions below 100kg of carbon dioxide per megawatt-hour. The highest emissions come in the Ohio Valley Electric region, where emissions clear 900kg/MW-hr. Only three regional grids match the overall grid emissions intensity, although that includes the very large PJM (where capacity auction payouts recently fell), ERCOT, and Southern Co balancing areas.

Most of the low-emissions power that's exported comes from the Pacific Northwest's abundant hydropower, while the Rocky Mountains area exports electricity with the highest associated emissions. That leads to some striking asymmetries. Local generation in the hydro-rich Idaho Power Company has embodied emissions of only 71kg/MW-hr, while its imports, coming primarily from Rocky Mountain states, have a carbon content of 625kg/MW-hr.

The reliance on hydropower also makes the asymmetry seasonal. Local generation is highest in the spring as snow melts, but imports become a larger source outside this time of year. As solar and wind can also have pronounced seasonal shifts, similar changes will likely be seen as these become larger contributors to many of these regional grids. Similar things occur daily, as both demand and solar production (and, to a lesser extent, wind) have distinct daily profiles.

The Golden State
California's CISO provides another instructive case. Imports represent less than 30% of its total electric use in 2016, yet California electricity imports provided 40% of its embodied emissions. Some of these, however, come internally from California, provided by the Los Angeles Department of Water and Power. The state itself, however, has only had limited tracking of imported emissions, lumping many of its sources as "other," and has been exporting its energy policies to Western states in ways that shape regional markets.

Overall, the 2016 inventory provides a narrow picture of the US grid, as plenty of trends are rapidly changing our country's emissions profile, including the rise of renewables and the widespread adoption of efficiency measures and other utility trends in 2017 that continue to evolve. The method developed here can, however, allow for annual updates, providing us with a much better picture of trends. That could be quite valuable to track things like how the rapid rise in solar power is altering the daily production of clean power.

More significantly, it provides a basis for more informed policymaking. States that wish to promote low-emissions power can use the information here to either alter the source of their imports or to encourage the sites where they're produced to adopt more renewable power. And those states that are exporting electricity produced primarily through fossil fuels could ensure that the locations where the power is used pay a price that includes the health costs of its production.


Related News

View more

EIA: Pennsylvania exports the most electricity, California imports the most from other states

U.S. Electricity Trade by State, 2013-2017 highlights EIA grid patterns, interstate imports and exports, cross-border flows with Canada and Mexico, net exporters and importers, and market regions like ISOs and RTOs shaping consumption and generation.


Key Points

Brief EIA overview of interstate and cross-border power flows, ranking top net importers and exporters.

✅ Pennsylvania was the largest net exporter, averaging 59 million MWh.

✅ California was the largest net importer, averaging 77 million MWh.

✅ Top cross-border: NY, CA, VT, MN, MI imports; WA, TX, CA, NY, MT exports.


According to the U.S. Energy Information Administration (EIA) State Electricity Profiles, from 2013 to 2017, Pennsylvania was the largest net exporter of electricity, while California was the largest net importer.

Pennsylvania exported an annual average of 59 million megawatt-hours (MWh), while California imported an average of 77 million MWh annually.

Based on the share of total consumption in each state, the District of Columbia, Maryland, Massachusetts, Idaho and Delaware were the five largest power-importing states between 2013 and 2017, highlighting how some clean states import 'dirty' electricity as consumption outpaces local generation. Wyoming, West Virginia, North Dakota, Montana and New Hampshire were the five largest power-exporting states. Wyoming and West Virginia were net power exporting states between 2013 and 2017.

New York, California, Vermont, Minnesota and Michigan imported the most electricity from Canada or Mexico on average from 2013 to 2017, reflecting the U.S. look to Canada for green power during that period. Similarly, Washington, Texas, California, New York, and Montana exported the most electricity to Canada or Mexico, on average, during the same period.

Electricity routinely flows among the Lower 48 states and, to a lesser extent, between the United States and Canada and Mexico. From 2013 to 2017, Pennsylvania was the largest net exporter of electricity, sending an annual average of 59 million megawatthours (MWh) outside the state. California was the largest net importer, receiving an average of 77 million MWh annually.

Based on the share of total consumption within each state, the District of Columbia, Maryland, Massachusetts, Idaho, and Delaware were the five largest power-importing states between 2013 and 2017. Wyoming, West Virginia, North Dakota, Montana, and New Hampshire were the five largest power-exporting states. States with major population centers and relatively less generating capacity within their state boundaries tend to have higher ratios of net electricity imports to total electricity consumption, as utilities devote more to electricity delivery than to power production in many markets.

Wyoming and West Virginia were net power exporting states (they exported more power to other states than they consumed) between 2013 and 2017. Customers residing in these two states are not necessarily at an economic disadvantage or advantage compared with customers in neighboring states when considering their electricity bills and fees and market dynamics. However, large amounts of power trading may affect a state’s revenue derived from power generation.

Some states also import and export electricity outside the United States to Canada or Mexico, even as Canada's electricity exports face trade tensions today. New York, California, Vermont, Minnesota, and Michigan are the five states that imported the most electricity from Canada or Mexico on average from 2013 through 2017. Similarly, Washington, Texas (where electricity production and consumption lead the nation), California, New York, and Montana are the five states that exported the most electricity to Canada or Mexico, on average, for the same period.

Many states within the continental United States fall within integrated market regions, referred to as independent system operators or regional transmission organizations. These integrated market regions allow electricity to flow freely between states or parts of states within their boundaries.

EIA’s State Electricity Profiles provide details about the supply and disposition of electricity for each state, including net trade with other states and international imports and exports, and help you understand where your electricity comes from more clearly.


Related News

View more

Yet another Irish electricity provider is increasing its prices

Electric Ireland Electricity Price Increase stems from rising wholesale costs as energy suppliers adjust tariffs. Customers face higher electricity bills, while gas remains unchanged; switching provider could deliver savings during winter.


Key Points

A 4% increase in Electric Ireland electricity prices from 1 Feb 2018, driven by wholesale costs; gas unchanged.

✅ 4% electricity rise effective 1 Feb 2018

✅ Increase attributed to rising wholesale energy costs

✅ Switching supplier may reduce bills and boost savings


ELECTRIC IRELAND has announced that it will increase its household electricity prices by 4% from 1 February 2018.

This comes just a week after both Bord Gáis Energy and SSE Airtricity announced increases in their gas and electricity prices, while national efforts to secure electricity supplies continue in parallel.

Electric Ireland has said that the electricity price increase is unavoidable due to the rising wholesale cost of electricity, with EU electricity prices trending higher as well.

The electricity provider said it has no plans to increase residential gas prices at the moment.

Commenting on the latest announcement, Eoin Clarke, managing director of Switcher.ie, said: “This is the third largest energy supplier to announce a price increase in the last week, so the other suppliers are probably not far behind.

“The fact that the rise is not coming into effect until 1 February will be welcomed by Electric Ireland customers who are worried about the rising cost of energy as winter sets in,” he said.

However, any increase is still bad news, especially as a quarter of consumers (27%) say their energy bill already puts them under financial pressure, and EU energy inflation has disproportionately affected lower-income households.

According to Electric Ireland, this will amount to a €2.91 per month increase for an average electricity customer, amounting to €35 per year.

Meanwhile, SSE Airtricity’s change amounts to an increase of 90 cent per week or €46.80 per year for someone with average consumption on their 24hr SmartSaver standard tariff, far below the dramatic Spain electricity price surge seen recently.

Bord Gáis Energy said its announcement will increase a typical gas bill by €2.12 a month and a typical electricity bill by €4.77 a month, reflecting wider trends such as the Germany power price spike reported recently.

In a statement, Bord Gáis Energy said: “The changes, which will take effect from 1st November 2017, are due to significant increases in the wholesale cost of energy as well as higher costs associated with distributing energy on the gas and electricity networks.

“In percentage terms, the increase represents 3.4% in a typical customer’s gas bill and an increase of 5.9% in a typical customer’s electricity bill.”

Clark said that if customers haven’t switched electricity provider in over a year that they should review the deals available at the moment.

“The market is highly competitive so there are huge savings to be made by switching,” he said.

“All suppliers use the same cables to supply electricity to your home, so you don’t need to worry about any loss in service, and you could save up to 324 by switching from typical standard tariffs to the cheapest deals on the market.”


Related News

View more

Sign Up for Electricity Forum’s Newsletter

Stay informed with our FREE Newsletter — get the latest news, breakthrough technologies, and expert insights, delivered straight to your inbox.

Electricity Today T&D Magazine Subscribe for FREE

Stay informed with the latest T&D policies and technologies.
  • Timely insights from industry experts
  • Practical solutions T&D engineers
  • Free access to every issue

Download the 2025 Electrical Training Catalog

Explore 50+ live, expert-led electrical training courses –

  • Interactive
  • Flexible
  • CEU-cerified