Offical says new Kosovo-Albania transmission could end power crisis

By BBC Monitoring European


CSA Z462 Arc Flash Training - Electrical Safety Essentials

Our customized live online or in‑person group training can be delivered to your staff at your location.

  • Live Online
  • 6 hours Instructor-led
  • Group Training Available
Regular Price:
$249
Coupon Price:
$199
Reserve Your Seat Today
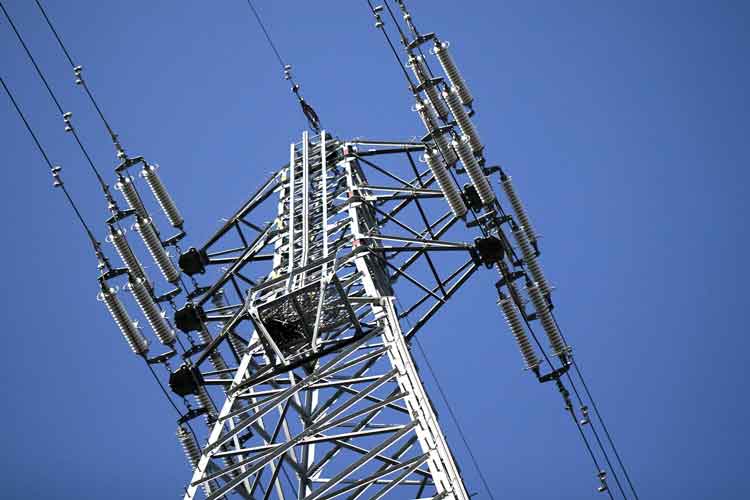
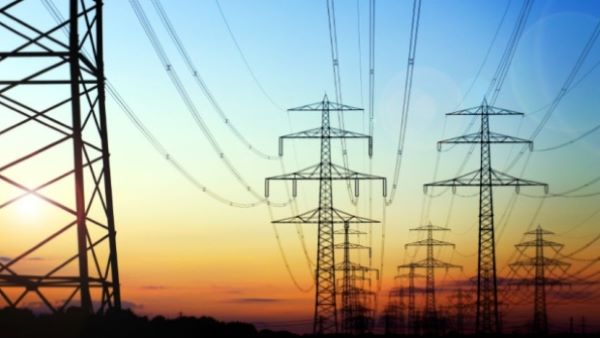
The way out of the energy crisis in Kosova, which would cost less and could be implemented quicker, is the construction of a 400 kilovolt [kV] transmitter with Albania, says the KEK [Kosovo Energy Corporation] international manager, Charles Brown, in an interview with KosovaLive.

Brown said that construction of new hydro or thermic power plants have a very high cost and take a lot of time.

He added that Kosova has a need to import power from Albania at peak times.

"The best way to supply it is by building a 400 kV transmitter with Albania to exchange electricity," Brown said.

Through this transmitter, he said, the KEK would send electricity to Albania when there is overproduction, especially during the night, and Albania would return the debt when they have electricity overproduction.

Kosova has overproduction during the summer and insufficient electricity during the winter, whereas it is the other way round with Albania, because Albanian capacities are based on hydroelectric plants.

The World Bank has allocated 1.1m dollars for conducting a feasibility study for an Albania-Kosova transmitter.

The idea for construction of hydro and thermoelectric power plants in Kosova is not right at this time. "Let's say we are to construct a power plant in Prizren - it would take six years and during that time we would not have production of electricity."

The KEK manager said that Kosova does not need a new plant. Kosova A Units are younger than the majority of plants in Southeastern Europe and they only need occasional repairs.

As far as the expenditures needed for construction of new plants, he said that at least some 20m euros are needed, which can hardly be secured, given the budget of Kosova.

In the last five years, Kosova has been faced with the problem of power supply due to the lack of repairs to the power plants in the 1990s and the failure of hundreds of million in investments to KEK from the international community.

Related News

Here are 3 ways to find out where your electricity comes from

US energy mix shows how the electric grid blends renewables, fossil fuels, nuclear, and hydro, varying by ISO/RTO markets, utilities, and state policies, affecting carbon emissions, pricing, reliability, and access.


Key Points

The US energy mix is the grid's source breakdown by region: fossil fuels, renewables, nuclear, and hydro.

✅ Check ISO or RTO dashboards for real-time generation by fuel source.

✅ Utilities may offer green power plans or RECs at modest premiums.

✅ Energy mix shifts with policy, pricing, and grid reliability needs.


There are few resources more important than energy. Sure, you may die if you don't eat for days. But your phone will die if you go too long without charging it. Energy feeds tech, the internet, city infrastructure, refrigerators, lights, and has evolved throughout U.S. history in profound ways. You get the idea. Yet unlike our other common needs, such as food, energy sources aren't exactly front of mind for most people. 

"I think a lot of people don't put a lot of bandwidth into thinking about this part of their lives," said Richard McMahon, the SVP of energy supply and finance at Edison Electric Institute, a trade group that represents investor-owned electric companies in the US. 

It makes sense. For most Americans, electricity is always there, and in many locations, there's not much of a choice involved, even as electricity demand is flat across the U.S. today. You sign up with a utility when you move into a new residence and pay your bills when they're due. 

But there's an important reality that indifference eschews: In 2018, a third of the energy-related carbon-dioxide emissions in the US came from the electric power sector, according to the US Energy Information Administration (EIA). 

A good chunk of that is from the residential sector, which consistently uses more energy than commercial customers, per EIA data.

Just as many people exercise choice when they eat, you typically also have a choice when it comes to your energy supply. That's not to say your current offering isn't what you want, or that switching will be easy or affordable, but "if you're a customer and want power with a certain attribute," McMahon said, "you can pretty much get it wherever you are." 

But first, you need to know the energy mix you have right now. As it turns out, it's not so straightforward. At all.

This brief guide may help. 

For some utility providers, you can find out if it publishes the energy mix online. Dominion Energy, which serves Idaho, North Carolina, Ohio, South Carolina, Utah, Virginia, West Virginia, and Wyoming, provides this information in a colored graphic. 

"Once you figure out who your utility is you can figure out what mix of resources they use," said Heidi Ratz, an electricity markets researcher at the World Resources Institute.

But not all utilities publish this information.

It has to do with their role in the grid and reflects utility industry trends in structure and markets. Some utility companies are vertically integrated; they generate power through nuclear plants or wind farms and distribute those electrons directly to their customers. Other utilities just distribute the power that different companies produce. 

Consider Consolidated Edison, or Con Ed, which distributes energy to parts of New York City. While reporting this story, Business Insider could not find information about the utility's energy mix online. When reached for comment, a spokesperson said, "we're indifferent to where it comes from."

That's because, in New York, distribution utilities like Con Ed often buy energy through a wholesale marketplace.

Take a look at this map. If you live in one of the colored regions, your electricity is sold on a wholesale market regulated by an organization called a regional transmission organization (RTO) or independent system operator (ISO). Distribution utilities like Con Ed often buy their energy through these markets, based on availability and cost, while raising questions about future utility revenue models as prices shift. 

Still, it's pretty easy to figure out where your energy comes from. Just look up the ISO or RTO website (such as NYISO or CAISO). Usually, these organizations will provide energy supply information in near-real time. 

That's exactly what Con Edison (which buys energy on the NYISO marketplace) suggested. As of Friday morning, roughly 40% of the energy on the market place was natural gas or other fossil fuels, 34% was nuclear, and about 22% was hydro. 

If you live in another region governed by an ISO or RTO, such as in most of California, you can do the same thing. Like NYISO, CAISO has a dashboard that shows (again, as of Friday morning) about 36% of the energy on the market comes from natural gas and more than 20% comes from renewables. 

In the map linked above, you'll notice that some of the ISOs and RTOs like MISO encompass enormous regions. That means that even if you figure out where the energy in your market comes from, it's not going to be geographically specific. But there are a couple of ways to drill down even further. 

The Environmental Protection Agency has a straightforward tool called Power Profiler. You can enter your zip code to see the fuel mix in your area. But it's not perfect. The data are from 2016 and, in some regions of the country like the upper Midwest, they aren't much more localized, and some import dirty electricity due to regional trading. 

The World Resources Institute also has a tool that allows you to see the electricity mix by state, based on 2017 data from EIA. These numbers represent power generation, not the electricity actually flowing into your sockets, but they offer a rough idea of what energy resources are operating in your state. 

One option is to check with your utility to see if it has a "green power" offering. Over 600 utilities across the country have one, according to the Climate Reality Project, though they often come at a slightly higher cost. It's typically on the scale of just a few more cents per kilowatt-hour. 

There are also independent, consumer-facing companies like Arcadia and Green Mountain Energy that allow you to source renewable energy, by virtually connecting you to community solar projects or purchasing Renewable Energy Certificates, or RECs, on your behalf, as America goes electric and more options emerge. 

"RECs measure an investment in a clean energy resource," Ratz said, in an email. "The goal of putting that resource on the grid is to push out the need for dirtier resources."

The good news: Even if you do nothing, your energy mix will get cleaner. Coal production has fallen to lows not seen since the 1980s, amid disruptions in coal and nuclear sectors that affect reliability and costs, while renewable electricity generation has doubled since 2008. So whether you like it or not, you'll be roped into the clean energy boom one way or another. 


Related News

View more

Ontario Power Generation's Commitment to Small Modular Reactors

OPG Small Modular Reactors advance clean energy with advanced nuclear, baseload power, renewables integration, and grid reliability; factory built, scalable, and cost effective to support Ontario energy security and net zero goals.


Key Points

Factory built nuclear units delivering reliable, low carbon power to support Ontario's grid, renewables, climate goals.

✅ Factory built modules cut costs and shorten schedules

✅ Provides baseload power to balance wind and solar

✅ Enhances grid reliability with advanced safety and waste reduction


Ontario Power Generation (OPG) is at the forefront of Canada’s energy transformation, demonstrating a robust commitment to sustainable energy solutions. One of the most promising avenues under exploration is the development of Small Modular Reactors (SMRs), as OPG broke ground on the first SMR at Darlington to launch this next phase. These innovative technologies represent a significant leap forward in the quest for reliable, clean, and cost-effective energy generation, aligning with Ontario’s ambitious climate goals and energy security needs.

Understanding Small Modular Reactors

Small Modular Reactors are advanced nuclear power plants that are designed to be smaller in size and capacity compared to traditional nuclear reactors. Typically generating up to 300 megawatts of electricity, SMRs can be constructed in factories and transported to their installation sites, offering flexibility and scalability that larger reactors do not provide. This modular approach reduces construction time and costs, making them an appealing option for meeting energy demands.

One of the key advantages of SMRs is their ability to provide baseload power—energy that is consistently available—while simultaneously supporting intermittent renewable sources like wind and solar. As Ontario continues to increase its reliance on renewables, SMRs could play a crucial role in ensuring that the energy supply remains stable and secure.

OPG’s Initiative

In its commitment to advancing clean energy technologies, OPG has been a strong advocate for the adoption of SMRs. The province of Ontario has announced plans to develop three additional small modular reactors, part of its plans for four Darlington SMRs that would further enhance the region’s energy portfolio. This initiative aligns with both provincial and federal climate objectives, and reflects a collaborative provincial push on nuclear innovation to accelerate clean energy.

The deployment of SMRs in Ontario is particularly strategic, given the province’s existing nuclear infrastructure, including the continued operation of Pickering NGS that supports grid reliability. OPG operates a significant portion of Ontario’s nuclear fleet, and leveraging this existing expertise can facilitate the integration of SMRs into the energy mix. By building on established operational frameworks, OPG can ensure that new reactors are deployed safely and efficiently.

Economic and Environmental Benefits

The introduction of SMRs is expected to bring substantial economic benefits to Ontario. The construction and operation of these reactors will create jobs, including work associated with the Pickering B refurbishment across the province, stimulate local economies, and foster innovation in nuclear technology. Additionally, SMRs have the potential to attract investment from both domestic and international stakeholders, positioning Ontario as a leader in advanced nuclear technology.

From an environmental perspective, SMRs are designed with enhanced safety features and lower waste production compared to traditional reactors, complementing life-extension measures at Pickering that bolster system reliability. They can significantly contribute to Ontario’s goal of achieving net-zero emissions by 2050. By providing a reliable source of clean energy, SMRs will help mitigate the impacts of climate change while supporting the province's transition to a sustainable energy future.

Community Engagement and Collaboration

Recognizing the importance of community acceptance and stakeholder engagement, OPG is committed to an open dialogue with local communities and Indigenous groups. This collaboration is essential to addressing concerns and ensuring that the deployment of SMRs is aligned with the values and priorities of the residents of Ontario. By fostering a transparent process, OPG aims to build trust and support for this innovative energy solution.

Moreover, the development of SMRs will involve partnerships with various stakeholders, including government agencies, research institutions, and private industry, such as the OPG-TVA partnership to advance new nuclear technology. These collaborations will not only enhance the technical aspects of SMR deployment but also ensure that Ontario can capitalize on shared expertise and resources.

Looking Ahead

As Ontario Power Generation moves forward with plans for three additional Small Modular Reactors, the province stands at a critical juncture in its energy evolution. The integration of SMRs into Ontario’s energy landscape promises a sustainable, reliable, and economically viable solution to meet growing energy demands while addressing climate change challenges.

With the support of government initiatives, community collaboration, and continued innovation in nuclear technology, Ontario is poised to become a leader in the advancement of Small Modular Reactors. The successful implementation of these projects could serve as a model for other jurisdictions seeking to transition to cleaner energy sources, highlighting the role of nuclear power in a balanced and sustainable energy future.

In conclusion, OPG's commitment to developing Small Modular Reactors not only reinforces Ontario’s energy security but also demonstrates a proactive approach to addressing the pressing challenges of climate change and environmental sustainability. The future of energy in Ontario looks promising, driven by innovation and a commitment to clean energy solutions.


Related News

View more

We Energies refiles rate hike request driven by rising nuclear power costs

We Energies rate increase driven by nuclear energy costs at Point Beach, Wisconsin PSC filings, and rising utility rates, affecting electricity prices for residential, commercial, and industrial customers while supporting WEC carbon reduction goals.


Key Points

A 2021 utility rate hike to recover Point Beach nuclear costs, modestly raising Wisconsin electricity bills.

✅ Residential bills rise about $0.73 per month

✅ Driven by $55.82/MWh Point Beach contract price

✅ PSC review and consumer advocates assessing alternatives


Wisconsin's largest utility company is again asking regulators to raise rates to pay for the rising cost of nuclear energy.

We Energies says it needs to collect an additional $26.5 million next year, an increase of about 3.4%.

For residential customers, that would translate to about 73 cents more per month, or an increase of about 0.7%, while some nearby states face steeper winter rate hikes according to regulators. Commercial and industrial customers would see an increase of 1% to 1.5%, according to documents filed with the Public Service Commission.

If approved, it would be the second rate increase in as many years for about 1.1 million We Energies customers, who saw a roughly 0.7% increase in 2020 after four years of no change, while Manitoba Hydro rate increase has been scaled back for next year, highlighting regional contrasts.

We Energies' sister utility, Wisconsin Public Service Corp., has requested a 0.13% increase, which would add about 8 cents to the average monthly residential bill, which went up 1.6% this year.

We Energies said a rate increase is needed to cover the cost of electricity purchased from the Point Beach nuclear power plant, which according to filings with the Securities Exchange Commission will be $55.82 per megawatt-hour next year.

So far this year, the average wholesale price of electricity in the Midwestern market was a little more than $25.50 per megawatt-hour, and recent capacity market payouts on the largest U.S. grid have fallen sharply, reflecting broader market conditions.

Owned and operated by NextEra Energy Resources, the 1,200-megawatt Point Beach Nuclear Plant is Wisconsin's last operational reactor. We Energies sold the plant for $924 million in 2007 and entered into a contract to purchase its output for the next two decades.

Brendan Conway, a spokesman for WEC Energy Group, said customers have benefited from the sale of the plant, which will supply more than a third of We Energies' demand and is a key component in WEC's strategy to cut 80% of its carbon emissions by 2050, amid broader electrification trends nationwide.

"Without the Point Beach plant, carbon emissions in Wisconsin would be significantly higher," Conway said.

As part of negotiations on its last rate case, WEC agreed to work with consumer advocates and the PSC to review alternatives to the contracted price increases, which were structured to begin rising steeply in 2018.

Tom Content, executive director of the Citizens Utility Board, said the contract will be an issue for We Energies customers into the next decade

"It's a significant source (of energy) for the entire state," Content said. "But nuclear is not cheap."

WEC filed the rate requests Monday, one week after the withdrawing similar applications. Conway said the largely unchanged filings had "undergone additional review by senior management."

WEC last week raised its second quarter profit forecast to 67 to 69 cents per share, up from the previous range of 58 to 62 cents per share.

The company credited better than expected sales in April and May along with operational cost savings and higher authorized profit margin for American Transmission Company, of which WEC is the majority owner.

Wisconsin's other investor-owned utilities have reported lower than expected fuel costs for 2020 and 2021, even as emergency fuel stock programs in New England are expected to cost millions this year.

Alliant Energy has proposed using about $31 million in fuel savings to help freeze rates in 2021, aligning with its carbon-neutral electricity plans as it rolls out long-term strategy, while Xcel Energy is proposing to lower its rates by 0.8% next year and refund its customers about $9.7 million in fuel costs for this year.

Madison Gas and Electric is negotiating a two-year rate structure with consumer groups who are optimistic that fuel savings can help prevent or offset rate increases, though some utilities are exploring higher minimum charges for low-usage customers to recover fixed costs.


Related News

View more

Global oil demand to decline in 2020 as Coronavirus weighs heavily on markets

COVID-19 Impact on Global Oil Demand 2020 signals an IEA forecast of declining consumption as travel restrictions curb transport fuels, disrupt energy markets, and shift OPEC and non-OPEC supply dynamics amid economic slowdown.


Key Points

IEA sees first demand drop since 2009 as COVID-19 curbs travel, weakening transport fuels and unsettling energy markets.

✅ IEA base case: 2020 demand at 99.9 mb/d, down 90 kb/d from 2019.

✅ Travel restrictions hit transport fuels; China drives the decline.

✅ Scenarios: low -730 kb/d; high +480 kb/d in 2020.


Global oil demand is expected to decline in 2020 as the impact of the new coronavirus (COVID-19) spreads around the world, constricting travel and broader economic activity, according to the International Energy Agency’s latest oil market forecast.

The situation remains fluid, creating an extraordinary degree of uncertainty over what the full global impact of the virus will be. In the IEA’s central base case, even as global CO2 emissions flatlined in 2019 according to the IEA, demand this year drops for the first time since 2009 because of the deep contraction in oil consumption in China, and major disruptions to global travel and trade.

“The coronavirus crisis is affecting a wide range of energy markets – including coal-fired electricity generation, gas and renewables – but its impact on oil markets is particularly severe because it is stopping people and goods from moving around, dealing a heavy blow to demand for transport fuels,” said Dr Fatih Birol, the IEA’s Executive Director. “This is especially true in China, the largest energy consumer in the world, which accounted for more than 80% of global oil demand growth last year. While the repercussions of the virus are spreading to other parts of the world, what happens in China will have major implications for global energy and oil markets.”

The IEA now sees global oil demand at 99.9 million barrels a day in 2020, down around 90,000 barrels a day from 2019. This is a sharp downgrade from the IEA’s forecast in February, which predicted global oil demand would grow by 825,000 barrels a day in 2020.

The short-term outlook for the oil market will ultimately depend on how quickly governments move to contain the coronavirus outbreak, how successful their efforts are, and what lingering impact the global health crisis has on economic activity.

To account for the extreme uncertainty facing energy markets, the IEA has developed two other scenarios for how global oil demand could evolve this year. In a more pessimistic low case, global measures fail to contain the virus, and global demand falls by 730,000 barrels a day in 2020. In a more optimistic high case, the virus is contained quickly around the world, and global demand grows by 480,000 barrels a day.

“We are following the situation extremely closely and will provide regular updates to our forecasts as the picture becomes clearer,” Dr Birol said. “The impact of the coronavirus on oil markets may be temporary. But the longer-term challenges facing the world’s suppliers are not going to go away, especially those heavily dependent on oil and gas revenues. As the IEA has repeatedly said, these producer countries need more dynamic and diversified economies in order to navigate the multiple uncertainties that we see today.”

The IEA also published its medium-term outlook examining the key issues in global demand, supply, refining and trade to 2025, as well as the trajectory of the global energy transition now shaping markets. Following a contraction in 2020 and an expected sharp rebound in 2021, yearly growth in global oil demand is set to slow as consumption of transport fuels grows more slowly and as national net-zero pathways, with Canada needing more electricity to reach net-zero influencing power demand, according to the report. Between 2019 and 2025, global oil demand is expected to grow at an average annual rate of just below 1 million barrels a day. Over the period as whole, demand rises by a total of 5.7 million barrels a day, with China and India accounting for about half of the growth.

At the same time, the world’s oil production capacity is expected to rise by 5.9 million barrels a day, with more than three-quarters of it coming from non-OPEC producers, the report forecasts. But production growth in the United States and other non-OPEC countries is set to lose momentum after 2022, amid shifts in Wall Street's energy strategy linked to policy signals, allowing OPEC producers from the Middle East to turn the taps back up to help keep the global oil market in balance.

The medium-term market report, Oil 2020, also considers the impact of clean energy transitions on oil market trends. Demand growth for gasoline and diesel between 2019 and 2025 is forecast to weaken as countries around the world implement policies to improve efficiency and cut carbon dioxide emissions – and as solar power becomes the cheapest electricity in many markets and electric vehicles increase in popularity. The impact of energy transitions on oil supply remains unclear, with many companies prioritising short-cycle projects for the coming years.

“The coronavirus crisis is adding to the uncertainties the global oil industry faces as it contemplates new investments and business strategies,” Dr Birol said. “The pressures on companies are changing, with European oil majors turning electric to diversify. They need to show that they can deliver not just the energy that economies rely on, but also the emissions reductions that the world needs to help tackle our climate challenge.”


Related News

View more

India Electricity Prices are Spiking

India spot electricity prices surged on Q3 demand, lifting power tariffs in the spot market as discoms scrambled for supply; Sembcorp SGPL boosted PLF and short-term PPA realizations, benefiting from INR per kWh peaks.


Key Points

India spot electricity prices hit Q3 records amid demand spikes, lifting tariffs and aiding Sembcorp SGPL via PLF gains.

✅ Record 10.6 cents/kWh average; 15-minute peak 20.7 cents/kWh

✅ SGPL shifted output to short-term PPA at 7.3 cents/kWh

✅ PLF ramped above 90%, cutting core losses by 30-40%


Electricity prices in India, now the third-largest electricity producer globally, bolted to a record high of 10.6 cents/kWh (INR5.1/kWh) in Q3.

A jolt in Indian spot electricity prices could save Sembcorp Industries' Indian business from further losses, even though demand has occasionally slumped in recent years, UOB Kay Hian said.

The firm said spot electricity prices in India bolted to a record high of 10.6 cents/kWh (INR5.1/kWh) in Q3 and even hit a 15-minute peak of 20.7 cents/kWh (9.9/kWh). The spike was due to a power supply crunch on higher electricity demand from power distribution companies, alongside higher imported coal volumes as domestic supplies shrank.

As an effect, Sembcorp Industries' Sembcorp Gayatri Power Limited's (SGPL) losses of $26m in Q1 and $29m in Q2 could narrow down by as much as 30-40%.

On a net basis, SGPL will recognise a significantly higher electricity tariff in 3Q17. By tactically shutting down its Unit #3 for maintenance, Unit #4 effectively had its generation contracted out at the higher short-term PPA tariff of around 7.3 cents/kWh (Rs3.5/kWh).

SGPL also capitalised on the price spike in 3Q17 as it ramped up its plant load factor (PLF) to more than 90%.

“On the back of this, coupled with the effects of reduced finance costs, we expect SGPL’s 3Q17 quarterly core loss to shrink by 30-40% from previous quarters,” UOB Kay Hian said.

Whilst electricity prices have corrected to 7.1 cents/kWh (INR3.4/kWh), the firm said it could still remain elevated on structural factors, even as coal and electricity shortages ease nationwide.

Sembcorp Industries' India operations brought in a robust performance for Q3. PLF for Thermal Powertech Corporation India Limited (TPCIL) hit 91%, whilst it reached 73% for SGPL, echoing the broader trend of thermal PLF up across the sector.


Related News

View more

U.S. renewable electricity surpassed coal in 2022

2022 US Renewable Power Milestone highlights EIA data: wind and solar outpaced coal and nuclear, hydropower contributed, with falling levelized costs, grid integration, battery storage, and transmission upgrades shaping affordable, reliable clean power growth.


Key Points

The year US renewables, led by wind and solar, generated more power than coal and nuclear, per EIA.

✅ Wind and solar rose; levelized costs fell 70%-90% over decade

✅ Renewables surpassed coal and nuclear in 2022 per EIA

✅ Grid needs storage and transmission to manage intermittency


Electricity generated from renewables surpassed coal in the United States for the first time in 2022, as wind and solar surpassed coal nationwide, the U.S. Energy Information Administration has announced.

Renewables also surpassed nuclear generation in 2022 after first doing so last year, and wind and solar together generated more electricity than nuclear for the first time in the United States.

Growth in wind and solar significantly drove the increase in renewable energy and contributed 14% of the electricity produced domestically in 2022, with solar producing about 4.7% of U.S. power overall. Hydropower contributed 6%, and biomass and geothermal sources generated less than 1%.

“I’m happy to see we’ve crossed that threshold, but that is only a step in what has to be a very rapid and much cheaper journey,” said Stephen Porder, a professor of ecology and assistant provost for sustainability at Brown University.

California produced 26% of the national utility-scale solar electricity followed by Texas with 16% and North Carolina with 8%.

The most wind generation occurred in Texas, which accounted for 26% of the U.S. total, while wind is now the most-used renewable electricity source nationwide, followed by Iowa (10%) and Oklahoma (9%).

“This booming growth is driven largely by economics,” said Gregory Wetstone, president and CEO of the American Council on Renewable Energy, as renewables became the second-most prevalent U.S. electricity source in 2020 nationwide. “Over the past decade, the levelized cost of wind energy declined by 70 percent, while the levelized cost of solar power has declined by an even more impressive 90 percent.”

“Renewable energy is now the most affordable source of new electricity in much of the country,” added Wetstone.

The Energy Information Administration projected that the wind share of the U.S. electricity generation mix will increase from 11% to 12% from 2022 to 2023 and that solar will grow from 4% to 5% during the period, and renewables hit a record 28% share in April according to recent data. The natural gas share is expected to remain at 39% from 2022 to 2023, and coal is projected to decline from 20% last year to 17% this year.

“Wind and solar are going to be the backbone of the growth in renewables, but whether or not they can provide 100% of the U.S. electricity without backup is something that engineers are debating,” said Brown University’s Porder.

Many decisions lie ahead, he said, as the proportion of renewables that supply the energy grid increases, with renewables projected to soon be one-fourth of U.S. electricity generation over the near term.

This presents challenges for engineers and policy-makers, Porder said, because existing energy grids were built to deliver power from a consistent source. Renewables such as solar and wind generate power intermittently. So battery storage, long-distance transmission and other steps will be needed to help address these challenges, he said.


Related News

View more

Sign Up for Electricity Forum’s Newsletter

Stay informed with our FREE Newsletter — get the latest news, breakthrough technologies, and expert insights, delivered straight to your inbox.

Electricity Today T&D Magazine Subscribe for FREE

Stay informed with the latest T&D policies and technologies.
  • Timely insights from industry experts
  • Practical solutions T&D engineers
  • Free access to every issue

Download the 2025 Electrical Training Catalog

Explore 50+ live, expert-led electrical training courses –

  • Interactive
  • Flexible
  • CEU-cerified