Wave Energy Converters can deliver marine power to the grid, with DOE-backed PacWave enabling offshore testing, robust designs, and renewable electricity from oscillating waves to decarbonize coastal communities and replace diesel in remote regions.
Key Points
Wave energy converters are devices that transform waves' oscillatory motion into electricity for the grid or loads.
✅ DOE's PacWave enables full-scale, grid-connected offshore testing.
✅ Multiple designs convert oscillating motion into torque and power.
✅ Ideal for islands, microgrids, and replacing diesel generation.
Waves off the coast of the U.S. could generate 2.64 trillion kilowatt hours of electricity per year — that’s about 64% of last year’s total utility-scale electricity generation in the U.S. We won’t need that much, but one day experts do hope that wave energy will comprise about 10-20% of our electricity mix, alongside other marine energy technologies under development today.
“Wave power is really the last missing piece to help us to transition to 100% renewables, ” said Marcus Lehmann, co-founder and CEO of CalWave Power Technologies, one of a number of promising startups focused on building wave energy converters.
But while scientists have long understood the power of waves, it’s proven difficult to build machines that can harness that energy, due to the violent movement and corrosive nature of the ocean, combined with the complex motion of waves themselves, even as a recent wave and tidal market analysis highlights steady advances.
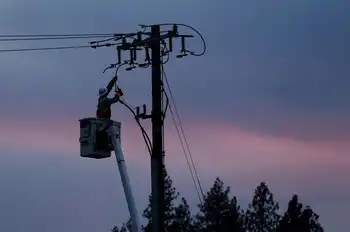
″Winds and currents, they go in one direction. It’s very easy to spin a turbine or a windmill when you’ve got linear movement. The waves really aren’t linear. They’re oscillating. And so we have to be able to turn this oscillatory energy into some sort of catchable form,” said Burke Hales, professor of cceanography at Oregon State University and chief scientist at PacWave, a Department of Energy-funded wave energy test site off the Oregon Coast. Currently under construction, PacWave is set to become the nation’s first full-scale, grid-connected test facility for these technologies, a milestone that parallels U.K. wind power lessons on scaling new industries, when it comes online in the next few years.
“PacWave really represents for us an opportunity to address one of the most critical barriers to enabling wave energy, and that’s getting devices into the open ocean,” said Jennifer Garson, Director of the Water Power Technologies Office at the U.S. Department of Energy.
At the beginning of the year, the DOE announced $25 million in funding for eight wave energy projects to test their technology at PacWave, as offshore wind forecasts underscore the growing investor interest in ocean-based energy. We spoke with a number of these companies, which all have different approaches to turning the oscillatory motion of the waves into electrical power.
Different approaches
Of the eight projects, Bay Area-based CalWave received the largest amount, $7.5 million.
″The device we’re testing at PacWave will be a larger version of this,” said Lehmann. The x800, our megawatt-class system, produces enough power to power about 3,000 households.”
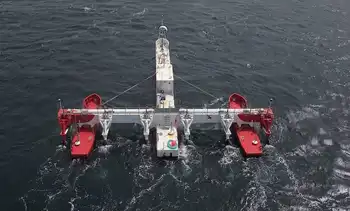
CalWave’s device operates completely below the surface of the water, and as waves rise and fall, surge forward and backward, and the water moves in a circular motion, the device moves too. Dampers inside the device slow down that motion and convert it into torque, which drives a generator to produce electricity, a principle mirrored in some wind energy kite systems as they harvest aerodynamic forces.
“And so the waves move the system up and down. And every time it moves down, we can generate power, and then the waves bring it back up. And so that oscillating motion, we can turn into electricity just like a wind turbine,” said Lehmann.
Another approach is being piloted by Seattle-based Oscilla Power, which was awarded $1.8 million from the DOE, and is getting ready to deploy its wave energy converter off the coast of Hawaii, at the U.S. Navy Wave Energy Test site.
Oscilla Power’s device is composed of two parts. One part floats on the surface and moves with the waves in all directions — up and down, side to side and rotationally. This float is connected to a large, ring-shaped structure which hangs below the surface, and is designed to stay relatively steady, much like how underwater kites leverage a stable reference to generate power. The difference in motion between the float and the ring generates force on the connecting lines, which is used to rotate a gearbox to drive a generator.
″The system that we’re deploying in Hawaii is what we call the Triton-C. This is a community-scale system,” said Balky Nair, CEO of Oscilla Power. “It’s about a third of the size of our flagship product. It’s designed to be 100 kilowatt rated, and it’s designed for islands and small communities.”
Nair is excited by wave energy’s potential to generate electricity in remote regions, which currently rely on expensive and polluting diesel imports to meet their energy needs when other renewables aren’t available, and similar tidal energy for remote communities efforts in Canada point to viable models. Before wave energy is adopted at-scale, many believe we’ll see wave energy replacing diesel generators in off-the-grid communities.
A third company, C-Power, based in Charlottesville, Virginia, was awarded more than $4 million to test its grid-scale wave energy converter at PacWave. But first, the company wants to commercialize its smaller scale system, the SeaRAY, which is designed for lower-power applications.
″Think about sensors in the ocean, research, metocean data gathering, maybe it’s monitoring or inspection,” said C-Power CEO Reenst Lesemann on the initial applications of his device.
The SeaRAY consists of two floats and a central body, the nacelle, which contains the drivetrain. As waves pass by, the floats bob up and down, rotating about the nacelle and turning their own respective gearboxes which power the electric generators.
Eventually, C-Power plans to scale up its SeaRAY so that it’s capable of satellite communications and deep water deployments, before building a larger system, called the StingRAY, for terrestrial electricity generation.
Meanwhile, one Swedish company, Eco Wave Power, is taking another approach completely, eschewing offshore technologies in favor of simpler wave power devices that can be installed on breakwaters, piers, and jetties.
“All the expensive conversion machinery, instead of being inside the floaters like in the competing technologies, is on land just like a regular power station. So basically this enables a very low installation, operation, and maintenance cost,” explained CEO Inna Braverman.
Related News