Wind-turbine paperwork bewilders permit applicants

By Knight Ridder Tribune


CSA Z462 Arc Flash Training - Electrical Safety Essentials

Our customized live online or in‑person group training can be delivered to your staff at your location.

  • Live Online
  • 6 hours Instructor-led
  • Group Training Available
Regular Price:
$249
Coupon Price:
$199
Reserve Your Seat Today
Ron Smolowitz knows paperwork. Smolowitz needs more than 90 permits and licenses to operate his 20-acre farm in East Falmouth.

But even for Smolowitz, the application for grant money from the U.S. Department of Agriculture to purchase and install a 10-kilowatt wind turbine seemed over the top. "Our application was 113 pages long," Smolowitz said. "I've never ever been exposed to a paperwork system like the USDA."

That's why representatives with the agency's rural development renewable energy and energy efficiency programs suggest potential grant applicants plan ahead for this year's grants. Although a specific application schedule for this year's grants will not be available until it is published in the Federal Register, once it is announced the time frame for submissions could be as short as 45 days, said Tom McGarr, area director for USD Rural Development in southeastern Massachusetts.

"It doesn't allow for a lot of time," he said. Anyone who wants a shot at the money should get organized now, he said. The USDA will hold a seminar on the grants from 10 a.m. to noon Feb. 6 at the Cape Cod Cranberry Experiment station in East Wareham. In the past two years, four businesses on Cape Cod have received $418,800 as part of the program.

Across the state less than half that amount - $161,851 - was distributed to other projects during the same time period. To participate, applicants must make at least 50 percent of their income from agricultural production or qualify as a small business in a rural area, McGarr said.

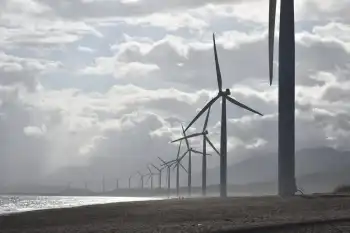
Most of the Cape is considered rural, and the high wind resources on the peninsula make the area ideal for wind turbines, he said. But, despite the paperwork and the time crunch, the program is worth it, Smolowitz and others said. Grants provide 25 percent of a project's cost up to $500,000. Response locally indicates the money is attractive enough to make it worth the extra effort.

The largest grant recipient was Webb Research Corporation in East Falmouth, which was awarded a $300,000 grant in 2007. Coupled with money from the Massachusetts Technology Collaborative, the federal grant made the company's proposed 1.5-megawatt turbine possible, company president Daniel Webb said.

Mann Farms of Buzzards Bay was awarded $46,250 by the USDA but did not get an MTC grant. Plans for a 90-kilowatt turbine there have been indefinitely postponed, owner Keith Mann said. But Mann agreed with Webb and Smolowitz that the staff at the local USDA office in West Wareham made the process easier than it otherwise might have been.

Related News

N.S. joins Western Climate Initiative for tech support for emissions plan

Nova Scotia Cap-and-Trade Program joins Western Climate Initiative to leverage emissions trading IT systems, track allowances, and manage compliance, while setting in-province caps, carbon pricing signals, and third-party verified reporting for industrial and fuel suppliers.


Key Points

A provincial emissions trading system using WCI services to cap GHGs, track allowances, and enforce verified compliance.

✅ Uses WCI IT system to manage allowances and registry

✅ Initial trading limited to in-province participants

✅ Third-party verification and annual reporting deadlines


Nova Scotia is yet to set targets for its new cap and trade regime to reduce greenhouse gases, but the province announced Monday that it has joined the Western Climate Initiative Inc. -- a non-profit corporation formed to provide administrative and technical services to states and provinces with emissions trading programs.

Environment Minister Iain Rankin said joining the initiative would allow the province to use its IT system to manage and track its new cap and trade program.

Rankin said the province can join without trading greenhouse gas emission allowances with other jurisdictions -- California, Quebec, and Ontario are currently linked through the program, with Hydro-Québec's U.S. sales highlighting cross-border dynamics. Nova Scotia currently has no plans to trade outside the province as it works on emissions caps Rankin said will be ready sometime in June.

#google#

Nova Scotia is yet to set targets for its new cap and trade regime to reduce greenhouse gases, but the province announced Monday that it has joined the Western Climate Initiative Inc. -- a non-profit corporation formed to provide administrative and technical services to states and provinces with emissions trading programs.

Environment Minister Iain Rankin said joining the initiative would allow the province to use its IT system to manage and track its new cap and trade program.

Rankin said the province can join without trading greenhouse gas emission allowances with other jurisdictions -- California, Quebec, and Ontario are currently linked through the program. Nova Scotia currently has no plans to trade outside the province as it works on emissions caps Rankin said will be ready sometime in June.

"By keeping our system internal it ensures that our greenhouse gas reductions are happening within our province," said Rankin. "But we do have that opportunity (to join) and if there are new entrants or we need more access to credits then that may shift our strategy."

The use of the system will cost Nova Scotia about US$314,000 for 2018-19, with an annual cost in subsequent years of about US$228,000 or more, if the province requests modifications.

"If we were to do something like that internally we would have to build a full database and hire more people, so this was an obvious choice for us," said Rankin.

Nova Scotia has already met the national reduction target of 30 per cent below 2005 levels and says it's on track to have 40 per cent of electricity generation from renewables by 2020, underscoring how cleaning up Canada's electricity supports climate pledges.

Stephen Thomas, energy campaign coordinator for the Ecology Action Centre, called the province's move an "important small step," stressing the importance of using the same administrative rules as the other jurisdictions involved.

But Thomas said Nova Scotia should go further and trade emissions with California, Quebec, and Ontario, and also put a price on carbon by auctioning credits as they do.

Thomas said Nova Scotia's system stands to be volatile because of the smaller number of participants -- about 20 including Nova Scotia Power, Northern Pulp, Lafarge, and large oil and gasoline companies such as ExxonMobil, Imperial and Irving.

"It's very likely to favour Nova Scotia Power as the largest single emitter with the most credits to sell here, and that would change if we had a linked system, at a time when Canada will need more electricity to hit net-zero according to the IEA," Thomas said.

He said it's important to have a linked system and a regional approach in Atlantic Canada, which has more emissions per person and more emissions per GDP than places like Ontario, Quebec and California, and where policies like Newfoundland's rate reduction plan can influence electricity strategy.

"Reducing emissions, because we are so emissions-intensive here, is a little bit cheaper," said Thomas. "So it's possible that Ontario, Quebec and California could pay Nova Scotia to reduce its emissions."

Under its program, Nova Scotia requires industrial facilities generating 50,000 tonnes or more of greenhouse gas emissions per year to report emissions.

Regulations also cover petroleum product suppliers that import or produce 200 litres of fuel or more per year for consumption and natural gas distributors whose products produce at least 10,000 tonnes of greenhouse gas emissions a year.

Companies were to have reported to the Environment Department by May 1 but Rankin said the deadline has been pushed back to June 1, a deadline that was to be followed in subsequent years in any event. Reports must be verified by a third party by Sept. 1 every year.

The Liberal government passed enabling legislation for cap and trade last fall.

As for the upcoming emissions caps, Rankin isn't tipping the province's hand yet, even as B.C.'s 2050 targets face a shortfall in some forecasts.

"Those caps will recognize the investments that have already been made and therefore will be the most cost-effective program that we can put together to meet the federal requirement," he said.


Related News

View more

US January power generation jumps 9.3% on year: EIA

US January power generation climbed to 373.2 TWh, EIA data shows, with coal edging natural gas, record wind output, record nuclear generation, rising hydro, and stable utility-scale solar amid higher Henry Hub prices.


Key Points

US January power generation hit 373.2 TWh; coal led gas, wind and nuclear set records, with solar edging higher.

✅ Coal 31.8% share; gas 29.4%; coal output 118.7 TWh, gas 109.6 TWh.

✅ Wind hit record 26.8 TWh; nuclear record 74.6 TWh.

✅ Total generation 373.2 TWh, highest January since 2014.


The US generated 373.2 TWh of power in January, up 7.9% from 345.9 TWh in December and 9.3% higher than the same month in 2017, Energy Information Administration data shows.

The monthly total was the highest amount in January since 377.3 TWh was generated in January 2014.

Coal generation totaled 118.7 TWh in January, up 11.4% from 106.58 TWh in December and up 2.8% from the year-ago month, consistent with projections of a coal-fired generation increase for the first time since 2014. It was also the highest amount generated in January since 132.4 TWh in 2015.

For the second straight month, more power was generated from coal than natural gas, as 109.6 TWh came from gas, up 3.3% from 106.14 TWh in December and up 19.9% on the year.

However, the 118.7 TWh generated from coal was down 9.6% from the five-year average for the month, due to the higher usage of gas and renewables and a rising share of non-fossil generation in the overall mix.

#google#

Coal made up 31.8% of the total US power generation in January, up from 30.8% in December but down from 33.8% in January 2017.

Gas` generation share was at 29.4% in the latest month, with momentum from record gas-fired electricity earlier in the period, down from 30.7% in December but up from 26.8% in the year-ago month.

In January, the NYMEX Henry Hub gas futures price averaged $3.16/MMBtu, up 13.9% from $2.78/MMBtu averaged in December but down 4% from $3.29/MMBtu averaged in the year-ago month.


WIND, NUCLEAR GENERATION AT RECORD HIGHS

Wind generation was at a record-high 26.8 TWh in January, up 29.3% from 22.8 TWh in December and the highest amount on record, according to EIA data going back to January 2001. Wind generated 7.2% of the nation`s power in January, as an EIA summer outlook anticipates larger wind and solar contributions, up from 6.6% in December and 6.1% in the year-ago month.

Utility-scale solar generated 3.3 TWh in January, up 1.3% from 3.1 TWh in December and up 51.6% on the year. In January, utility-scale solar generation made up 0.9% of US power generation, during a period when solar and wind supplied 10% of US electricity in early 2018, flat from December but up from 0.6% in January 2017.

Nuclear generation was also at a record-high 74.6 TWh in January, up 1.3% month on month and the highest monthly total since the EIA started tracking it in January 2001, eclipsing the previous record of 74.3 TWh set in July 2008. Nuclear generation made up 20% of the US power in January, down from 21.3% in December and 21.4% in the year-ago month.

Hydro power totaled 25.4 TWh in January, making up 6.8% of US power generation during the month, up from 6.5% in December but down from 8.2% in January 2017.


Related News

View more

Rio Tinto Completes Largest Off-Grid Solar Plant in Canada's Northwest Territories

Rio Tinto Off-Grid Solar Power Plant showcases renewable energy at the Diavik Diamond Mine in Canada's Northwest Territories, cutting diesel use, lowering carbon emissions, and boosting remote mining resilience with advanced photovoltaic technology.


Key Points

A remote solar PV plant at Diavik mine supplying clean power while cutting diesel use, carbon emissions, and costs.

✅ Largest off-grid solar in Northwest Territories

✅ Replaces diesel generators during peak solar hours

✅ Enhances sustainability and lowers operating costs


In a significant step towards sustainable mining practices, Rio Tinto has completed the largest off-grid solar power plant in Canada’s Northwest Territories. This groundbreaking achievement not only highlights the company's commitment to renewable energy, as Canada nears 5 GW of solar capacity nationwide, but also sets a new standard for the mining industry in remote and off-grid locations.

Located in the remote Diavik Diamond Mine, approximately 220 kilometers south of the Arctic Circle, Rio Tinto's off-grid solar power plant represents a technological feat in harnessing renewable energy in challenging environments. The plant is designed to reduce reliance on diesel fuel, traditionally used to power the mine's operations, and mitigate carbon emissions associated with mining activities.

The decision to build the solar power plant aligns with Rio Tinto's broader sustainability goals and commitment to reducing its environmental footprint. By integrating renewable energy sources like solar power, a strategy that renewable developers say leads to better, more resilient projects, the company aims to enhance energy efficiency, lower operational costs, and contribute to global efforts to combat climate change.

The Diavik Diamond Mine, jointly owned by Rio Tinto and Dominion Diamond Mines, operates in a remote region where access to traditional energy infrastructure is limited, and where, despite lagging solar demand in Canada, off-grid solutions are increasingly vital for reliability. Historically, diesel generators have been the primary source of power for the mine's operations, posing logistical challenges and environmental impacts due to fuel transportation and combustion.

Rio Tinto's investment in the off-grid solar power plant addresses these challenges by leveraging abundant sunlight in the Northwest Territories to generate clean electricity directly at the mine site. The solar array, equipped with advanced photovoltaic technology, which mirrors deployments such as Arvato's first solar plant in other sectors, is capable of producing a significant portion of the mine's electricity needs during peak solar hours, reducing reliance on diesel generators and lowering overall carbon emissions.

Moreover, the completion of the largest off-grid solar power plant in Canada's Northwest Territories underscores the feasibility and scalability of renewable energy solutions, from rooftop arrays like Edmonton's largest rooftop solar to off-grid systems in remote and resource-intensive industries like mining. The success of this project serves as a model for other mining companies seeking to enhance sustainability practices and operational resilience in challenging geographical locations.

Beyond environmental benefits, Rio Tinto's initiative is expected to have positive economic and social impacts on the local community. By reducing diesel consumption, the company mitigates air pollution and noise levels associated with mining operations, improving environmental quality and contributing to the well-being of nearby residents and wildlife.

Looking ahead, Rio Tinto's investment in renewable energy at the Diavik Diamond Mine sets a precedent for responsible resource development and sustainable mining practices in Canada, where solar growth in Alberta is accelerating, and globally. As the mining industry continues to evolve, integrating renewable energy solutions like off-grid solar power plants will play a crucial role in achieving long-term environmental sustainability and operational efficiency.

In conclusion, Rio Tinto's completion of the largest off-grid solar power plant in Canada's Northwest Territories marks a significant milestone in the mining industry's transition towards renewable energy. By harnessing solar power to reduce reliance on diesel generators, the company not only improves operational efficiency and environmental stewardship but also adds to momentum from corporate power purchase agreements like RBC's Alberta solar deal, setting a positive example for sustainable development in remote regions. As global demand for responsible mining practices grows, initiatives like Rio Tinto's off-grid solar project demonstrate the potential of renewable energy to drive positive change in resource-intensive industries.


Related News

View more

Electricity in Spain is 682.65% more expensive than the same day in 2020

Spain Electricity Prices surge to record highs as the wholesale market hits €339.84/MWh, driven by gas costs and CO2 permits, impacting PVPC regulated tariffs, free-market contracts, and household energy bills, OMIE data show.


Key Points

Rates in Spain's wholesale market that shape PVPC tariffs and free-market bills, moving with gas prices and CO2 costs.

✅ Record €339.84/MWh; peak 20:00-21:00; low 04:00-05:00 (OMIE).

✅ PVPC users and free-market contracts face higher bills.

✅ Drivers: high gas prices and rising CO2 emission rights.


Electricity in Spain's wholesale market will rise in price once more as European electricity prices continue to surge. Once again, it will set a historical record in Spain, reaching €339.84/MWh. With this figure, it is already the fifth time that the threshold of €300 has been exceeded.

This new high is a 6.32 per cent increase on today’s average price of €319.63/MWh, which is also a historic record, while Germany's power prices nearly doubled over the past year. Monday’s energy price will make it 682.65 per cent higher than the corresponding date in 2020, when the average was €43.42.

According to data published by the Iberian Energy Market Operator (OMIE), Monday’s maximum will be between the hours of 8pm and 9pm, reaching €375/MWh, a pattern echoed by markets where Electric Ireland price hikes reflect wholesale volatility. The cheapest will be from 4am to 5am, at €267.99.

The prices of the ‘pool’ have a direct effect on the regulated tariff  – PVPC – to which almost 11 million consumers in the country are connected, and serve as a reference for the other 17 million who have contracted their supply in the free market, where rolling back prices is proving difficult across Europe.

These spiraling prices in recent months, which have fueled EU energy inflation, are being blamed on high gas prices in the markets, and carbon dioxide (CO2) emission rights, both of which reached record highs this year.

According to an analysis by Facua-Consumidores en Acción, if the same rates were maintained for the rest of the month, the last invoice of the year would reach €134.45 for the average user. That would be 94.1 per cent above the €69.28 for December 2020, while U.S. residential electricity bills rose about 5% in 2022 after inflation adjustments.

The average user’s bill so far this year has increased by 15.1 per cent compared to 2018, as US electricity prices posted their largest jump in 41 years. Thus, compared to the €77.18 of three years ago, the average monthly bill now reaches €90.87 euros. However, the Government continues to insist that this year households will end up paying the same as in 2018.

As Ruben Sanchez, the general secretary of Facua commented, “The electricity bill for December would have to be negative for President Sanchez, and Minister Ribera, to fulfill their promise that this year consumers will pay the same as in 2018 once the CPI has been discounted”.


Related News

View more

Ukraine Helps Spain Amid Blackouts

Ukraine-Spain Power Aid highlights swift international solidarity as Kyiv offers grid restoration expertise to Spain after unprecedented blackouts, aiding energy infrastructure recovery, interconnectors, and emergency response while operators restore power across Spain and Portugal.


Key Points

Ukraine sends grid experts to help Spain recover from blackouts, restore power, and reinforce energy infrastructure.

✅ Ukraine offers grid restoration expertise and emergency support.

✅ Partial power restored; cause of blackouts under investigation.

✅ EU funding and Ukrenergo bolster infrastructure resilience.


In a remarkable display of international solidarity, Ukraine has extended assistance to Spain as the country grapples with widespread power outages. On April 28, 2025, Spain and neighboring Portugal experienced unprecedented blackouts that disrupted daily life, including internet connectivity and subway operations. The two nations declared a state of emergency as they worked to restore power.

Ukraine's Offer of Assistance

In response to the crisis, Ukrainian President Volodymyr Zelensky reached out to Spanish Prime Minister Pedro Sánchez, offering support to help restore Spain's power grid. Zelensky emphasized Ukraine's extensive experience in managing energy challenges, particularly in fighting to keep the lights on during sustained Russian attacks on its energy infrastructure. He instructed Ukraine’s Energy Minister, Herman Haluschchenko, to mobilize technical experts to assist Spain swiftly. As of April 29, grid operators in both Spain and Portugal reported partial restoration of power, with recovery efforts ongoing. Authorities continue to investigate the cause of the outages. 

Ukraine's Energy Crisis: A Background

Ukraine's offer of assistance is particularly poignant given its own recent struggles with energy security. Throughout 2024, Russia launched numerous aerial strikes targeting Ukraine's energy infrastructure, including strikes on western Ukraine that severely damaged power generation facilities and transmission networks. These attacks led to significant challenges during the winter season, including widespread blackouts and difficulties in heating households, prompting efforts to keep the lights on this winter across the country. Despite these adversities, Ukraine managed to navigate the winter without major power shortages, thanks to rapid repairs and the resilience of its energy sector. 

International Support for Ukraine

The international community has played a crucial role in supporting Ukraine's energy sector, even as U.S. support for grid restoration has shifted, with continued aid from European partners. In July 2024, the European Union allocated nearly $110 million through the KfW Development Bank to modernize high-voltage substations and develop interconnectors with continental Europe's power system. This funding has been instrumental in repairing and restoring equipment damaged by Russian attacks and enhancing the protection of Ukraine's substations. Since the onset of the conflict, Ukraine's energy grid operator, Ukrenergo, has received international assistance totaling approximately €1.5 billion. 

A Gesture of Solidarity

Ukraine's offer to assist Spain underscores the deepening ties between the two nations and reflects a broader spirit of international cooperation. While Spain continues its recovery efforts, the support from Ukraine serves as a reminder of the importance of solidarity, and of Ukraine's electricity reserves that help prevent further outages in times of crisis. As both countries work towards restoring and securing their energy infrastructures, their collaboration highlights the shared challenges and mutual support that define the European community.

Ukraine's proactive stance in offering assistance to Spain amidst the recent blackouts exemplifies the strength of international partnerships and the shared commitment to new energy solutions that overcome energy challenges. As the situation develops, the continued cooperation between nations will be pivotal in ensuring energy security and resilience as winter looms over Ukraine once more.


Related News

View more

During this Pandemic, Save Money - How To Better Understand Your Electricity Bill

Commercial Electric Tariffs explain utility rate structures, peak demand charges, kWh vs kW pricing, time-of-use periods, voltage, delivery, capacity ratchets, and riders, guiding facility managers in tariff analysis for accurate energy savings.


Key Points

Commercial electric tariffs define utility pricing for energy, demand, delivery, time-of-use periods, riders, and ratchet charges.

✅ Separate kWh charges from kW peak demand fees.

✅ Verify time-of-use windows and demand interval length.

✅ Review riders, capacity ratchets, and minimum demand clauses.


Especially during these tough economic times, as major changes to electric bills are debated in some states, facility executives who don’t understand how their power is priced have been disappointed when their energy projects failed to produce expected dollar savings. Here’s how not to be one of them.

Your electric rate is spelled out in a document called a “tariff” that can be downloaded from your utility’s web page. A tariff should clearly spell out the costs for each component that is part of your rate, reflecting cost allocation practices in your region. Don’t be surprised to learn that it contains a bunch of them. Unlike residential electric rates, commercial electric bills are not based solely on the quantity of kilowatt-hours (kWh) consumed in a billing period (in the United States, that’s a month). Instead, different rates may apply to how your power is supplied, how it is delivered via electricity delivery charges, when it was consumed, its voltage, how fast it was used (in kW), and other factors.

If a tariff’s lingo and word structure are too opaque, spend some time with a utility account rep to translate it. Many state utility commissions also have customer advocates that may assist as they explore new utility rate designs that affect customers. Alternatively, for a fee, facility managers can privately chat with an energy consultant.

Common mistakes

Many facility managers try to estimate savings based on an averaged electric rate, i.e., annual electric spend divided by annual kWh. However, in markets where electricity demand is flat, such a number may obscure the fastest rising cost component: monthly peak demand charges, measured in dollars per kW (or kilo-volt-amperes, kVA).

This charge is like a monthly speeding ticket, based solely on the highest speed you drove during that time. In some areas, peak demand charges now account for 30 to 60 percent of a facility’s annual electric spend. When projecting energy cost savings, failing to separately account for kW peak demand and kWh consumption may result in erroneous results, and a lot of questions from the C-suite.

How peak demand charges are calculated varies among utilities. Some base it on the highest average speed of use across one hour in a month, while others may use the highest average speed during a 15- or 30-minute period. Others may average several of the highest speeds within a defined time period (for example, 8 a.m. to 6 p.m. on weekdays). It is whatever your tariff says it is.

Because some power-consuming (or producing) devices, including those tied to smart home electricity networks, vary in their operation or abilities, they may save money on a few — but not all — of those rate components. If an equipment vendor calculates savings from its product by using an average electric rate, take pause. Tell the vendor to return after the proposal has been redone using tariff-based numbers.

When a vendor is the only person calculating potential savings from using a product, there’s also a built-in conflict of interest: The person profiting from an equipment sale should not also be the one calculating its expected financial return. Before signing any energy project contracts, it’s essential that someone independent of the deal reviews projected savings. That person (typically an energy or engineering consultant) should be quite familiar with your facility’s electric tariff, including any special provisions, riders, discounts, etc., that may pertain. When this doesn’t happen, savings often don’t occur as planned. 

For example, some utilities add another form of demand charge, based on the highest kW in a year. It has various names: capacity, contract demand, or the generic term “ratchet charge.” Some utilities also have a minimum ratchet charge which may be based on a percent of a facility’s annual kW peak. It ensures collection of sufficient utility revenue to cover the cost of installed transmission and distribution even when a customer significantly cuts its peak demand.


Related News

View more

Sign Up for Electricity Forum’s Newsletter

Stay informed with our FREE Newsletter — get the latest news, breakthrough technologies, and expert insights, delivered straight to your inbox.

Electricity Today T&D Magazine Subscribe for FREE

Stay informed with the latest T&D policies and technologies.
  • Timely insights from industry experts
  • Practical solutions T&D engineers
  • Free access to every issue

Download the 2025 Electrical Training Catalog

Explore 50+ live, expert-led electrical training courses –

  • Interactive
  • Flexible
  • CEU-cerified