Company says power line moving forward

By Associated Press


Electrical Testing & Commissioning of Power Systems

Our customized live online or in‑person group training can be delivered to your staff at your location.

  • Live Online
  • 12 hours Instructor-led
  • Group Training Available
Regular Price:
$599
Coupon Price:
$499
Reserve Your Seat Today
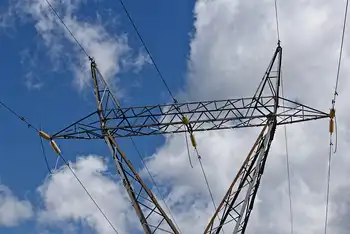
TransCanada Corp. told the governor of Montana that its plans for a big electricity line stretching to the Southwest are moving forward.

The line, first announced in 2006 and called the Chinook Transmission Line Project, could get conceptual federal approval by next month, said Alberta, Canada-based TransCanada.

The company expects to announce a partnership with a large wind power generator perhaps by April. TransCanada told Gov. Brian Schweitzer in the meeting that it needs a commitment from a wind power company large enough to use about half of the transmission line's 3,000 megawatts.

"The project is really starting to get some legs," said Scott Farris, TransCanada government relations director.

TransCanada has a similar line planned for Wyoming, called Zephyr. The lines will provide "green energy" to Las Vegas, Los Angeles, Phoenix and Southwest energy markets and will both stretch about 1,000 miles at a cost of about $3 billion for each line.

The company believes that the hungry energy markets in the Southwest have a desire to purchase renewable energy, even if it could cost more.

If everything goes well, the company said the transmission line could be in operation by 2014. At its rollout two years ago, the company had hoped to finish it by 2011.

Schweitzer said he has been told that the administration of President-elect Barack Obama will speed up the regulatory hurdles for green energy projects.

"We've been with you from the beginning and we are sticking with you," Schweitzer told company executives. "We want to be your partners."

Originally, the company envisioned that electricity from a coal-to-liquids plant would be a big part of its business model.

But Schweitzer said wind power appears to be proving more feasible.

It is thought the line will kickstart large energy projects, which need a way to sell their electricity to distant markets. It will be a more efficient direct current line, as opposed to the more traditional alternating current lines.

TransCanada is also developing the Keystone XL crude oil pipeline that would run through part of eastern Montana and take oil to refineries in the Gulf Coast.

Related News

Updated Germany hydrogen strategy sees heavy reliance on imported fuel

Germany Hydrogen Import Strategy outlines reliance on green hydrogen imports, expanded electrolysis capacity, IPCEI-funded pipelines, and industrial decarbonization for steel and chemicals to reach climate-neutral goals by 2045, meeting 2030 demand of 95-130 TWh.


Key Points

A plan to import 50-70% of hydrogen by 2030, backing green hydrogen, electrolysis, pipelines, and decarbonization.

✅ Imports cover 50-70% of 2030 hydrogen demand

✅ 10 GW electrolysis target with state aid and IPCEI

✅ 1,800 km H2 pipelines to link hubs by 2030


Germany will have to import up to 70% of its hydrogen demand in the future as Europe's largest economy aims to become climate-neutral by 2045, an updated government strategy published on Wednesday showed.

The German cabinet approved a new hydrogen strategy, setting guidelines for hydrogen production, transport infrastructure and market plans.

Germany is seeking to expand reliance on hydrogen as a future energy source to bolster energy resilience and cut greenhouse emissions for highly polluting industrial sectors that cannot be electrified such as steel and chemicals and cut dependency on imported fossil fuel.

Produced using solar and wind power, green hydrogen is a pillar of Berlin's plan to build a sustainable electric planet and transition away from fossil fuels.

But even with doubling the country's domestic electrolysis capacity target for 2030 to at least 10 gigawatts (GW), Germany will need to import around 50% to 70% of its hydrogen demand, forecast at 95 to 130 TWh in 2030, the strategy showed.

"A domestic supply that fully covers demand does not make economic sense or serve the transformation processes resulting from the energy transition and the broader global energy transition overall," the document said.

The strategy underscores the importance of diversifying future hydrogen sources, including potential partners such as Canada's clean hydrogen sector, but the government is working on a separate strategy for hydrogen imports whose exact date is not clear, a spokesperson for the economy ministry said.

"Instead of relying on domestic potential for the production of green hydrogen, the federal government's strategy is primarily aimed at imports by ship," Simone Peter, the head of Germany's renewable energy association, said.

Under the strategy, state aid is expected to be approved for around 2.5 GW of electrolysis projects in Germany this year and the government will earmark 700 million euros ($775 million) for hydrogen research to optimise production methods, research minister Bettina Stark-Watzinger said.

But Germany's limited renewable energy space will make it heavily dependent on imported hydrogen from emerging export hubs such as Abu Dhabi hydrogen exports gaining scale, experts say.

"Germany is a densely populated country. We simply need space for wind and photovoltaic to be able to produce the hydrogen," Philipp Heilmaier, an energy transition researcher at Germany energy agency, told Reuters.

The strategy allows the usage of hydrogen produced through fossil energy sources preferably if the carbon is split off, but said direct government subsidies would be limited to green hydrogen.

Funds for launching a hydrogen network with more than 1,800 km of pipelines in Germany are expected to flow by 2027/2028 through the bloc's Important Projects of Common European Interest (IPCEI) financing scheme, as the EU plans to double electricity use by 2050 could raise future demand, with the goal of connecting all major generation, import and storage centres to customers by 2030.

Transport Minister Volker Wissing said his ministry was working on plans for a network of hydrogen filling stations and for renewable fuel subsidies.

Environmental groups said the strategy lacked binding sustainability criteria and restriction on using hydrogen for sectors that cannot be electrified instead of using it for private heating or in cars, calling for a plan to eventually phase-out blue hydrogen which is produced from natural gas.

Germany has already signed several hydrogen cooperation agreements with countries such as clean energy partnership with Canada and Norway, United Arab Emirates and Australia.


Related News

View more

Carbon capture: How can we remove CO2 from the atmosphere?

CO2 Removal Technologies address climate change via negative emissions, including carbon capture, reforestation, soil carbon, biochar, BECCS, DAC, and mineralization, helping meet Paris Agreement targets while managing costs, land use, and infrastructure demands.


Key Points

Methods to extract or sequester atmospheric CO2, combining natural and engineered approaches to limit warming.

✅ Includes reforestation, soil carbon, biochar, BECCS, DAC, mineralization

✅ Balances climate goals with costs, land, energy, and infrastructure

✅ Key to Paris Agreement targets under 1.5-2.0 °C warming


The world is, on average, 1.1 degrees Celsius warmer today than it was in 1850. If this trend continues, our planet will be 2 – 3 degrees hotter by the end of this century, according to the Intergovernmental Panel on Climate Change (IPCC).

The main reason for this temperature rise is higher levels of atmospheric carbon dioxide, which cause the atmosphere to trap heat radiating from the Earth into space. Since 1850, the proportion of CO2 in the air has increased, with record greenhouse gas concentrations documented, from 0.029% to 0.041% (288 ppm to 414 ppm).

This is directly related to the burning of coal, oil and gas, which were created from forests, plankton and plants over millions of years. Back then, they stored CO2 and kept it out of the atmosphere, but as fossil fuels are burned, that CO2 is released. Other contributing factors include industrialized agriculture and slash-and-burn land clearing techniques, and emissions from SF6 in electrical equipment are also concerning today.

Over the past 50 years, more than 1200 billion tons of CO2 have been emitted into the planet's atmosphere — 36.6 billion tons in 2018 alone, though global emissions flatlined in 2019 before rising again. As a result, the global average temperature has risen by 0.8 degrees in just half a century.


Atmospheric CO2 should remain at a minimum
In 2015, the world came together to sign the Paris Climate Agreement which set the goal of limiting global temperature rise to well below 2 degrees — 1.5 degrees, if possible.

The agreement limits the amount of CO2 that can be released into the atmosphere, providing a benchmark for the global energy transition now underway. According to the IPCC, if a maximum of around 300 billion tons were emitted, there would be a 50% chance of limiting global temperature rise to 1.5 degrees. If CO2 emissions remain the same, however, the CO2 'budget' would be used up in just seven years.

According to the IPCC's report on the 1.5 degree target, negative emissions are also necessary to achieve the climate targets.


Using reforestation to remove CO2
One planned measure to stop too much CO2 from being released into the atmosphere is reforestation. According to studies, 3.6 billion tons of CO2 — around 10% of current CO2 emissions — could be saved every year during the growth phase. However, a study by researchers at the Swiss Federal Institute of Technology, ETH Zurich, stresses that achieving this would require the use of land areas equivalent in size to the entire US.

Young trees at a reforestation project in Africa (picture-alliance/OKAPIA KG, Germany)
Reforestation has potential to tackle the climate crisis by capturing CO2. But it would require a large amount of space


More humus in the soil
Humus in the soil stores a lot of carbon. But this is being released through the industrialization of agriculture. The amount of humus in the soil can be increased by using catch crops and plants with deep roots as well as by working harvest remnants back into the ground and avoiding deep plowing. According to a study by the German Institute for International and Security Affairs (SWP) on using targeted CO2 extraction as a part of EU climate policy, between two and five billion tons of CO2 could be saved with a global build-up of humus reserves.


Biochar shows promise
Some scientists see biochar as a promising technology for keeping CO2 out of the atmosphere. Biochar is created when organic material is heated and pressurized in a zero or very low-oxygen environment. In powdered form, the biochar is then spread on arable land where it acts as a fertilizer. This also increases the amount of carbon content in the soil. According to the same study from the SWP, global application of this technology could save between 0.5 and two billion tons of CO2 every year.


Storing CO2 in the ground
Storing CO2 deep in the Earth is already well-known and practiced on Norway's oil fields, for example. However, the process is still controversial, as storing CO2 underground can lead to earthquakes and leakage in the long-term. A different method is currently being practiced in Iceland, in which CO2 is sequestered into porous basalt rock to be mineralized into stone. Both methods still require more research, however, with new DOE funding supporting carbon capture, utilization, and storage.

Capturing CO2 to be held underground is done by using chemical processes which effectively extract the gas from the ambient air, and some researchers are exploring CO2-to-electricity concepts for utilization. This method is known as direct air capture (DAC) and is already practiced in other parts of Europe.  As there is no limit to the amount of CO2 that can be captured, it is considered to have great potential. However, the main disadvantage is the cost — currently around €550 ($650) per ton. Some scientists believe that mass production of DAC systems could bring prices down to €50 per ton by 2050. It is already considered a key technology for future climate protection.

The inside of a carbon capture facility in the Netherlands (RWE AG)
Carbon capture facilities are still very expensive and take up a huge amount of space

Another way of extracting CO2 from the air is via biomass. Plants grow and are burned in a power plant to produce electricity. CO2 is then extracted from the exhaust gas of the power plant and stored deep in the Earth, with new U.S. power plant rules poised to test such carbon capture approaches.

The big problem with this technology, known as bio-energy carbon capture and storage (BECCS) is the huge amount of space required. According to Felix Creutzig from the Mercator Institute on Global Commons and Climate Change (MCC) in Berlin, it will therefore only play "a minor role" in CO2 removal technologies.


CO2 bound by rock minerals
In this process, carbonate and silicate rocks are mined, ground and scattered on agricultural land or on the surface water of the ocean, where they collect CO2 over a period of years. According to researchers, by the middle of this century it would be possible to capture two to four billion tons of CO2 every year using this technique. The main challenges are primarily the quantities of stone required, and building the necessary infrastructure. Concrete plans have not yet been researched.


Not an option: Fertilizing the sea with iron
The idea is use iron to fertilize the ocean, thereby increasing its nuturient content, which would allow plankton to grow stronger and capture more CO2. However, both the process and possible side effects are very controversial. "This is rarely treated as a serious option in research," concludes SWP study authors Oliver Geden and Felix Schenuit.


Related News

View more

Carbon emissions fall as electricity producers move away from coal

Global Electricity Emissions Decline highlights a 2% drop as coal power falls, while wind and solar surge. EU and US decarbonize faster; China expands coal and gas, challenging Paris Agreement climate targets.


Key Points

A 2% annual fall in power-sector CO2, led by less coal and rising wind and solar in the EU and US.

✅ Coal generation fell 3% globally despite China growth

✅ EU and US cut coal; wind and solar up 15% worldwide

✅ Gas gains in US; rapid renewables rollout needed for targets


Carbon emissions from the global electricity system fell by 2% last year, the biggest drop in almost 30 years, as countries began to turn their backs on coal-fired power plants.

A new report on the world’s electricity generation revealed the steepest cut in carbon emissions since 1990, with IEA data indicating global totals flatlined in 2019 as the US and the EU turned to cleaner energy sources.

Overall, power from coal plants fell by 3% last year, even as China’s reliance on coal plants climbed for another year to make up half the world’s coal generation for the first time.

Coal generation in the US and Europe has halved since 2007, and last year collapsed by almost a quarter in the EU and by 16% in the US.

The report from climate thinktank Ember, formerly Sandbag, warned that the dent in the world’s coal-fired electricity generation relied on many one-off factors, including milder winters across many countries.

“Progress is being made on reducing coal generation, but nothing like with the urgency needed to limit climate change,” the report said.

Dave Jones, the lead author of the report, said governments must dramatically accelerate the global energy transition so that global coal generation collapses throughout the 2020s.

“To switch from coal into gas is just swapping one fossil fuel for another. The cheapest and quickest way to end coal generation is through a rapid rollout of carbon-free electricity such as wind and solar,” he said.

“But without concerted policymaker efforts to boost wind and solar, we will fail to meet climate targets. China’s growth in coal, and to some extent gas, is alarming but the answers are all there.”

The EU has made the fastest progress towards replacing coal with wind and solar power, while the US has increased its reliance on gas as Wall Street’s energy strategy shifted following its shale boom in recent years.

The report revealed that renewable wind and solar power rose by 15% in 2019 to make up 8% of the world’s electricity.

In the EU, wind and solar power made up almost a fifth of the electricity generated last year, and Europe’s oil majors are turning electric as the bloc stayed ahead of the US which relied on these renewable sources for 11% of its electricity. In China and India, renewable energy made up 8% and 9% of the electricity system, respectively.

To meet the Paris climate goals, the world needs to record a compound growth rate of 15% for wind and solar generation every year – which will require “a colossal effort”, the report warned.

The electricity generation report was published as a separate piece of research claimed that 38 out of 75 of the world’s largest asset managers are stalling on taking action on environmental, social and governance (ESG) issues, and amid investor pressure on utilities to release climate reports.

The latest ranking by Asset Owners Disclosure Project, a scheme managed by the investment campaign group ShareAction, found that the 38 asset managers have weak or nonexistent policy commitments and fail to account for their real-world impacts across their mainstream assets.

The survey also claimed that the investment managers often lack appropriate engagement and escalation processes on climate change, human rights and biodiversity.

Scores were based on a survey of activities in responsible investment governance, climate change, human rights, and biodiversity and ranged between AAA to E. Not a single asset manager was granted an AAA or AA rating, the top two scores available.

Felix Nagrawala, ShareAction analyst, said: “While many in the industry are eager to promote their ESG credentials, our analysis clearly indicates that few of the world’s largest asset managers can lay claim to having a truly sustainable approach across all their investments.”

ShareAction said the world’s six largest asset managers – including BlackRock (rated D), State Street (D) and Vanguard (E) – were among the worst performers.

Vanguard said it was committed to companies making “appropriate disclosures on governance, strategy and performance on relevant ESG risks”. BlackRock and State Street did not respond to a request for comment.


Related News

View more

Invest in Hydropower to Tackle Coronavirus and Climate Crisis Impacts

Hydropower Covid-19 Resilience highlights clean, reliable energy and flexible grid services, with pumped storage, automation, and affordability supporting climate action, decarbonization, and recovery through sustainable infrastructure, policy incentives, and capacity upgrades.


Key Points

Hydropower Covid-19 Resilience is the sector's ability to ensure clean, reliable, flexible power during crises.

✅ Record 4,306 TWh in 2019, avoiding 80-100 Mt CO2e emissions.

✅ 1,308 GW installed; 15.6 GW added; flexibility and storage in demand.

✅ Policy, tax incentives, and fast-track approvals to spur projects.


The Covid-19 pandemic has underlined hydropower's resilience and critical role in delivering clean, reliable and affordable energy, especially in times of crisis, as highlighted by IAEA lessons for low-carbon electricity. This is the conclusion of two new reports published by the International Hydropower Association (IHA).

The 2020 Hydropower Status Report presents latest worldwide installed capacity and generation data, showcasing the sector's contribution to global carbon reduction efforts, with low-emissions sources projected to cover almost all demand increases in the next three years. It is published alongside a Covid-19 policy paper featuring recommendations for governments, financial institutions and industry to respond to the current health and economic crisis.

"Preventing an emergency is far better than responding to one," says Roger Gill, President of IHA, highlighting the need to incentivise investments in renewable infrastructure, a view echoed by Fatih Birol during the crisis. "The events of the past few months must be a catalyst for stronger climate action, including greater development of sustainable hydropower."

Now in its seventh edition, the Hydropower Status Report shows electricity generation hit a record 4,306 terawatt hours (TWh) in 2019, the single greatest contribution from a renewable energy source in history, aligning with the outlook that renewables to surpass coal by 2025.

The annual rise of 2.5 per cent (106 TWh) in hydroelectric generation - equivalent to the entire electricity consumption of Pakistan - helped to avoid an estimated additional 80-100 million metric tonnes of greenhouse gases being emitted last year.

The report also highlights:

* Global hydropower installed capacity reached 1,308 gigawatts (GW) in 2019, as 50 countries completed greenfield and upgrade projects, including pumped storage and repowering old dams in some regions.

* A total of 15.6 GW in installed capacity was added in 2019, down on the 21.8 GW recorded in 2018. This represents a rise of 1.2 per cent, which is below the estimated 2.0 per cent growth rate required for the world to meet Paris Agreement carbon reduction targets.

* India has overtaken Japan as the fifth largest world hydropower producer with its total installed capacity now standing at over 50 GW. The countries with the highest increases in were Brazil (4.92 GW), China (4.17 GW) and Laos (1.89 GW).

* Hydropower's flexibility services have been in high demand during the Covid-19 crisis, even as global demand dipped 15% globally, while plant operations have been less affected due to the degree of automation in modern facilities.

* Hydropower developments have not been immune to economic impacts however, with the industry facing widespread uncertainty and liquidity shortages which have put financing and refinancing of some projects at risk.

In a companion policy paper, IHA sets out the immediate impacts of the crisis on the sector, noting how European responses to Covid-19 have accelerated the electricity system transition, as well as recommendations to assist governments and financial institutions and enhance hydropower's contribution to the recovery.

The recommendations include:

  • Increasing the ambition of renewable energy and climate change targets which incorporate the role of sustainable hydropower development.
  • Supporting sustainable hydropower through introducing appropriate financial measures such as tax incentives to ensure viable and shovel-ready projects can commence.
  • Fast-tracking planning approvals to ensure the development and modernisation of hydropower projects can commence as soon as possible, in line with internationally recognised sustainability guidelines.
  • Safeguarding investment by extending deadlines for concession agreements and other awarded projects.
  • Given the increasing need for long-duration energy storage such as pumped storage, working with regulators and system operators to develop appropriate compensation mechanisms for hydropower's flexibility services.


Related News

View more

Hurricane Michael by the numbers: 32 dead, 1.6 million homes, businesses without power

Hurricane Michael Statistics track catastrophic wind speed, storm surge, rainfall totals, power outages, evacuations, and fatalities across Florida and the Southeast, detailing Category 4 intensity, Saffir-Simpson scale impacts, and emergency response resources.


Key Points

Hurricane Michael statistics detail wind speed, storm surge, rainfall, outages, and deaths from Category 4 landfall.

✅ 155 mph landfall winds; 14 ft storm surge; 12 in rainfall max

✅ 1.6M without power; 30,000 restoring crews; 6 states emergency

✅ 325k ordered evacuations; 32 deaths; FEMA and Guard deployed


Hurricane Michael, a historic Category 4 storm, struck the Florida Panhandle early Wednesday afternoon, unleashing heavy rain, high winds and a devastating storm surge.


Here is a look at the dangerous storm by the numbers:

155 mph: Wind speed -- nearly the highest possible for a Category 4 hurricane -- with which Michael made landfall near Mexico Beach and Panama City. A hurricane with 157 mph or higher is a Category 5, the strongest on the Saffir-Simpson hurricane wind scale.

129 mph: Peak wind gust reported Wednesday at Tyndall Air Force Base, which is about 12 miles southeast of Panama City, Florida.

32: Number of storm-related deaths attributed to Michael thus far, including an 11-year-old girl who local officials say was killed when part of a metal carport crashed into her family's mobile home in Lake Seminole, Georgia, and a 38-year-old man who was killed when a tree fell onto his moving car in Statesville, North Carolina.


Waves take over a house as Hurricane Michael comes ashore in Alligator Point, Fla., Oct. 10, 2018.

14 feet: Maximum height forecast for the storm surge when Michael's strong winds pushed the ocean water onto land. A storm surge just over 9 feet was reported Wednesday in Apalachicola, Florida.

12 inches: Isolated maximum amount of rain that Michael was expected to dump across the Florida Panhandle and the state's Big Bend region, as well as in southeast Alabama and parts of southwest and central Georgia.

9 inches: Maximum amount of rain that Michael could bring to isolated areas from Virginia to North Carolina.

1.6 million: Number of homes and businesses without power in Florida, Alabama, Georgia, South Carolina, North Carolina and Virginia as of Friday morning, a reminder that extended outages can persist after major disasters.

30,000: Number of workers mobilized from across the country to help restore power, underscoring the risks of field repairs such as line crew injuries during recovery.

6: Number of states that had emergency declarations in anticipation of Michael: Florida, Alabama, Georgia, South Carolina, North Carolina and Virginia.

325,000: Estimated number of people in the storm's path who were told to evacuate by local authorities.

6,000: Approximate number of people who stayed in the roughly 80 shelters across Florida, Alabama, Georgia, South Carolina and North Carolina on Wednesday night, while those sheltering at home were urged to avoid overheated power strips that can spark fires.

3,000: Number of personnel the Federal Emergency Management Agency deployed ahead of landfall, while utilities prepared on-site staffing plans to maintain operations during widespread disruptions.

35: Number of counties in Florida, of the state's 67, where Gov. Rick Scott declared a state of emergency prior to landfall, and grid reliability warnings often underscore systemic risks during national emergencies.

3,500: Number of Florida National Guard troops activated for pre-landfall coordination and planning, with an emphasis on high water and search-and-rescue operations.

600: Number of Florida state troopers assigned to the Panhandle and Big Bend region to assist with response and recovery efforts, including public reminders about downed line safety in affected communities.

500: Number of disaster relief workers that the American Red Cross was sending to affected areas in the Sunshine State.

200: Approximate number of patients being evacuated from at least two hospitals in Florida due to damage from the hurricane, highlighting how critical facilities depend on staff who have raised workforce safety concerns during other crises. Bay Medical Center Sacred Heart in Panama City said in a statement Thursday that its facility was damaged during the storm and thus is transferring more than 200 patients, including 39 who are critically ill, to regional hospitals. Gulf Coast Regional Medical Center, also in Panama City, announced in a statement Thursday that it's evacuating its roughly approximately patients, starting with the most critically ill, "because of the infrastructure challenges in our community."


Related News

View more

Clean B.C. is quietly using coal and gas power from out of province

BC Hydro Electricity Imports shape CleanBC claims as Powerex trades cross-border electricity, blending hydro with coal and gas supplies, affecting emissions, grid carbon intensity, and how electric vehicles and households assess "clean" power.


Key Points

Powerex buys power for BC Hydro, mixing hydro with coal and gas, shifting emissions and affecting CleanBC targets.

✅ Powerex trades optimize price, not carbon intensity

✅ Imports can include coal- and gas-fired generation

✅ Emissions affect EV and CleanBC decarbonization claims


British Columbians naturally assume they’re using clean power when they fire up holiday lights, juice up a cell phone or plug in a shiny new electric car. 

That’s the message conveyed in advertisements for the CleanBC initiative launched by the NDP government, amid indications that residents are split on going nuclear according to a survey, which has spent $3.17 million on a CleanBC “information campaign,” including almost $570,000 for focus group testing and telephone town halls, according to the B.C. finance ministry.

“We’ll reduce air pollution by shifting to clean B.C. energy,” say the CleanBC ads, which feature scenic photos of hydro reservoirs. “CleanBC: Our Nature. Our Power. Our Future.” 

Yet despite all the bumph, British Columbians have no way of knowing if the electricity they use comes from a coal-fired plant in Alberta or Wyoming, a nuclear plant in Washington, a gas-fired plant in California or a hydro dam in B.C. 

Here’s why. 

BC Hydro’s wholly-owned corporate subsidiary, Powerex Corp., exports B.C. power when prices are high and imports power from other jurisdictions when prices are low. 

In 2018, for instance, B.C. imported more electricity than it exported — not because B.C. has a power shortage (it has a growing surplus due to the recent spate of mill closures and the commissioning of two new generating stations in B.C.) but because Powerex reaps bigger profits when BC Hydro slows down generators to import cheaper power, especially at night.

“B.C. buys its power from outside B.C., which we would argue is not clean,” says Martin Mullany, interim executive director for Clean Energy BC. 

“A good chunk of the electricity we use is imported,” Mullany says. “In reality we are trading for brown power” — meaning power generated from conventional ‘dirty’ sources such as coal and gas. 

Wyoming, which generates almost 90 per cent of its power from coal, was among the 12 U.S. states that exported power to B.C. last year. (Notably, B.C. did not export any electricity to Wyoming in 2018.)

Utah, where coal-fired power plants produce 70 per cent of the state’s energy amid debate over the costs of scrapping coal-fired electricity, and Montana, which derives about 55 per cent of its power from coal, also exported power to B.C. last year. 

So did Nebraska, which gets 63 per cent of its power from coal, 15 per cent from nuclear plants, 14 per cent from wind and three per cent from natural gas.   

Coal is responsible for about 23 per cent of the power generated in Arizona, another exporter to B.C., while gas produces about 44 per cent of the electricity in that state.  

In 2017, the latest year for which statistics are available, electricity imports to B.C. totalled just over 1.2 million tonnes of carbon dioxide emissions, according to the B.C. environment ministry — roughly the equivalent of putting 255,000 new cars on the road, using the U.S. Environmental Protection Agency’s calculation of 4.71 tonnes of annual carbon emissions for a standard passenger vehicle. 

These figures far outstrip the estimated local and upstream emissions from the contested Woodfibre LNG plant in Squamish that is expected to release annual emissions equivalent to 170,000 new cars on the road.

Import emissions cast a new light on B.C.’s latest “milestone” announcement that 30,000 electric cars are now among 3.7 million registered vehicles in the province.

BC Electric Vehicles Announcement Horgan Heyman Mungall Weaver
In November of 2018 the province announced a new target to have all new light-duty cars and trucks sold to be zero-emission vehicles by the year 2040. Photo: Province of B.C. / Flickr

“Making sure more of the vehicles driven in the province are powered by BC Hydro’s clean electricity is one of the most important steps to reduce [carbon] pollution,” said the November 28 release from the energy ministry, noting that electrification has prompted a first call for power in 15 years from BC Hydro.

Mullany points out that Powerex’s priority is to make money for the province and not to reduce emissions.

“It’s not there for the cleanest outcome,” he said. “At some time we have to step up to say it’s either the money or the clean power, which is more important to us?”

Electricity bought and sold by little-known, unregulated Powerex
These transactions are money-makers for Powerex, an opaque entity that is exempt from B.C.’s freedom of information laws. 

Little detailed information is available to the public about the dealings of Powerex, which is overseen by a board of directors comprised of BC Hydro board members and BC Hydro CEO and president Chris O’Reilly. 

According to BC Hydro’s annual service plan, Powerex’s net income ranged from $59 million to $436 million from 2014 to 2018. 

“We will never know the true picture. It’s a black box.” 

Powerex’s CEO Tom Bechard — the highest paid public servant in the province — took home $939,000 in pay and benefits last year, earning $430,000 of his executive compensation through a bonus and holdback based on his individual and company performance.  

“The problem is that all of the trade goes on at Powerex and Powerex is an unregulated entity,” Mullany says. 

“We will never know the true picture. It’s a black box.” 

In 2018, Powerex exported 8.7 million megawatt hours of electricity to the U.S. for a total value of almost $570 million, according to data from the Canada Energy Regulator. That same year, Powerex imported 9.6 million megawatt hours of electricity from the U.S. for almost $360 million. 

Powerex sold B.C.’s publicly subsidized power for an average of $87 per megawatt hour in 2018, according to the Canada Energy Regulator. It imported electricity for an average of $58 per megawatt hour that year. 

In an emailed statement in response to questions from The Narwhal, BC Hydro said “there can be a need to import some power to meet our electricity needs” due to dam reservoir fluctuations during the year and from year to year.

‘Impossible’ to determine if electricity is from coal or wind power
Emissions associated with electricity imports are on average “significantly lower than the emissions of a natural gas generating plant because we mostly import electricity from hydro generation and, increasingly, power produced from wind and solar,” BC Hydro claimed in its statement. 

But U.S. energy economist Robert McCullough says there’s no way to distinguish gas and coal-fired U.S. power exports to B.C. from wind or hydro power, noting that “electrons lack labels.” 

Similarly, when B.C. imports power from Alberta, where generators are shifting to gas and 48.5 per cent of electricity production is coal-fired and 38 per cent comes from natural gas, there’s no way to tell if the electricity is from coal, wind or gas, McCullough says.

“It really is impossible to make that determination.” 

Wyoming Gilette coal pits NASA
The Gillette coal pits in Wyoming, one of the largest coal-producers in the U.S. Photo: NASA Earth Observatory

Neither the Canada Energy Regulator nor Statistics Canada could provide annual data on electricity imports and exports between B.C. and Alberta. 

But you can watch imports and exports in real time on this handy Alberta website, which also lists Alberta’s power sources. 

In 2018, California, Washington and Oregon supplied considerably more power to B.C. than other states, according to data from Canada Energy Regulator. 

Washington, where about one-quarter of generated power comes from fossil fuels, led the pack, with more than $339 million in electricity exports to B.C. 

California, which still gets more than half of its power from gas-fired plants even though it leads the U.S. in renewable energy with substantial investments in wind, solar and geothermal, was in second place, selling about $18.4 million worth of power to B.C. 

And Oregon, which produces about 43 per cent of its power from natural gas and six per cent from coal, exported about $6.2 million worth of electricity to B.C. last year. 

By comparison, Nebraska’s power exports to B.C. totalled about $1.6 million, Montana’s added up to $1.3 million,  Nevada’s were about $706,000 and Wyoming’s were about $346,000.

Clean electrons or dirty electrons?
Dan Woynillowicz, deputy director of Clean Energy Canada, which co-chaired the B.C. government’s Climate Solutions and Clean Growth Advisory Council, says B.C. typically exports power to other jurisdictions during peak demand. 

Gas-fired plants and hydro power can generate electricity quickly, while coal-fired power plants take longer to ramp up and wind power is variable, Woynillowicz notes. 

“When you need power fast and there aren’t many sources that can supply it you’re willing to pay more for it.”

Woynillowicz says “the odds are high” that B.C. power exports are displacing dirty power.

Elsewhere in Canada, analysts warn that Ontario's electricity could get dirtier as policies change, raising similar concerns.

“As a consumer you never know whether you’re getting a clean electron or a dirty electron. You’re just getting an electron.” 


Related News

View more

Sign Up for Electricity Forum’s Newsletter

Stay informed with our FREE Newsletter — get the latest news, breakthrough technologies, and expert insights, delivered straight to your inbox.

Electricity Today T&D Magazine Subscribe for FREE

Stay informed with the latest T&D policies and technologies.
  • Timely insights from industry experts
  • Practical solutions T&D engineers
  • Free access to every issue

Download the 2025 Electrical Training Catalog

Explore 50+ live, expert-led electrical training courses –

  • Interactive
  • Flexible
  • CEU-cerified