Frustrated carbon traders try other commodities

By Reuters


Substation Relay Protection Training

Our customized live online or in‑person group training can be delivered to your staff at your location.

  • Live Online
  • 12 hours Instructor-led
  • Group Training Available
Regular Price:
$699
Coupon Price:
$599
Reserve Your Seat Today
Some carbon emissions trading desks are expanding or diversifying into other commodities as continued low carbon prices and a weak UN climate deal have dulled the market.

Several large banks in the European Union's emissions trading scheme (EU ETS) already operate in other energy or commodities markets. Some smaller participants are seeking to diversify as well.

Paris-based COER2 Commodities will start trading crude oil futures, natural gas, gold and base metals from mid-January, adding to its existing carbon emissions trade. "This was part of our strategy since last September. We want to be more involved in the futures commodities markets which is our real core business," a company spokesman said.

Fortis Bank Netherlands started to diversify into other European energy markets toward the end of last year.

"I have put my best people on soft commodities and oil. At the moment I don't see there is a proper business to be had in carbon," Seb Walhain, the bank's head of environmental markets, told Reuters.

EU permit prices, considered the global benchmark, fell by 21 percent last year and are now down nearly 60 percent from 2008's highs.

The economic downturn reduced industrial output considerably, which dampened the need for emissions permits.

A watered-down climate agreement in Copenhagen last month depressed the market further as many players hoped for tougher carbon emissions caps, which would increase permit demand and send prices higher.

Analysts expect prices to remain depressed at least until the second half of this year, mainly because industrial companies have a large number of surplus permits. Mass selling could drive prices even further south.

The global market for carbon credits edged up to $136 billion last year, compared with a World Bank estimate of $126 billion for 2008, Oslo-based Point Carbon said.

Last year, several trading firms decided to expand their emissions desks in anticipation of a new global climate agreement followed by a U.S. cap-and-trade market.

Related News

UK low-carbon electricity generation stalls in 2019

UK low-carbon electricity 2019 saw stalled growth as renewables rose slightly, wind expanded, nuclear output fell, coal hit record lows, and net-zero targets demand faster deployment to cut CO2 intensity below 100gCO2/kWh.


Key Points

Low-carbon sources supplied 54% of UK power in 2019, up just 1TWh; wind grew, nuclear fell, and coal dropped to 2%.

✅ Wind up 8TWh; nuclear down 9TWh amid outages

✅ Fossil fuels 43% of generation; coal at 2%

✅ Net-zero needs 15TWh per year added to 2030


The amount of electricity generated by low-carbon sources in the UK stalled in 2019, Carbon Brief analysis shows.

Low-carbon electricity output from wind, solar, nuclear, hydro and biomass rose by just 1 terawatt hour (TWh, less than 1%) in 2019. It represents the smallest annual increase in a decade, where annual growth averaged 9TWh. This growth will need to double in the 2020s to meet UK climate targets while replacing old nuclear plants as they retire.

Some 54% of UK electricity generation in 2019 came from low-carbon sources, including 37% from renewables and 20% from wind alone, underscoring wind's leading role in the power mix during key periods. A record-low 43% was from fossil fuels, with 41% from gas and just 2% from coal, also a record low. In 2010, fossil fuels generated 75% of the total.

Carbon Brief’s analysis of UK electricity generation in 2019 is based on figures from BM Reports and the Department for Business, Energy and Industrial Strategy (BEIS). See the methodology at the end for more on how the analysis was conducted.

The numbers differ from those published earlier in January by National Grid, which were for electricity supplied in Great Britain only (England, Wales and Scotland, but excluding Northern Ireland), including via imports from other countries.

Low-carbon low
In 2019, the UK became the first major economy to target net-zero greenhouse gas emissions by 2050, increasing the ambition of its legally binding Climate Change Act.

To date, the country has cut its emissions by around two-fifths since 1990, with almost all of its recent progress coming from the electricity sector.

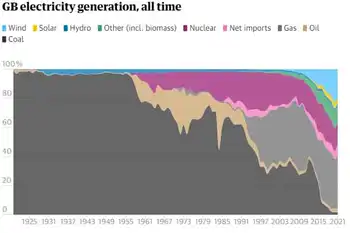
Emissions from electricity generation have fallen rapidly in the decade since 2010 as coal power has been almost phased out and even gas output has declined. Fossil fuels have been displaced by falling demand and by renewables, such as wind, solar and biomass.

But Carbon Brief’s annual analysis of UK electricity generation shows progress stalled in 2019, with the output from low-carbon sources barely increasing compared to a year earlier.

The chart below shows low-carbon generation in each year since 2010 (grey bars) and the estimated level in 2019 (red). The pale grey bars show the estimated future output of existing low-carbon sources after old nuclear plants retire and the pale red bars show the amount of new generation needed to keep electricity sector emissions to less than 100 grammes of CO2 per kilowatt hour (gCO2/kWh), the UK’s nominal target for the sector.

 Annual electricity generation in the UK by fuel, terawatt hours, 2010-2019. Top panel: fuel by fuel. Bottom panel: cumulative total generation from all sources. Source: BEIS energy trends, BM Reports and Carbon Brief analysis. Chart by Carbon Brief using Highcharts.
As the chart shows, the UK will require significantly more low-carbon electricity over the next decade as part of meeting its legally binding climate goals.

The nominal 100gCO2/kWh target for 2030 was set in the context of the UK’s less ambitious goal of cutting emissions to 80% below 1990 levels by 2050. Now that the country is aiming to cut emissions to net-zero by 2050, that 100gCO2/kWh indicator is likely to be the bare minimum.

Even so, it would require a rapid step up in the pace of low-carbon expansion, compared to the increases seen over the past decade. On average, low-carbon generation has risen by 9TWh each year in the decade since 2010 – including a rise of just 1TWh in 2019.

Given scheduled nuclear retirements and rising demand expected by the Committee on Climate Change (CCC) – with some electrification of transport and heating – low-carbon generation would need to increase by 15TWh each year until 2030, just to meet the benchmark of 100gCO2/kWh.

For context, the 3.2 gigawatt (GW) Hinkley C new nuclear plant being built in Somerset will generate around 25TWh once completed around 2026. The world’s largest offshore windfarm, the 1.2GW Hornsea One scheme off the Yorkshire coast, will generate around 5TWh each year.

The new Conservative government is targeting 40GW of offshore wind by 2030, up from today’s figure of around 8GW. If policies are put in place to meet this goal, then it could keep power sector emissions below 100gCO2/kWh, depending on the actual performance of the windfarms built.

However, new onshore wind and solar, further new nuclear or other low-carbon generation, such as gas with carbon capture and storage (CCS), is likely to be needed if demand is higher than expected, or if the 100gCO2/kWh benchmark is too weak in the context of net-zero by 2050.

The CCC says it is “likely” to “reflect the need for more rapid deployment” of low-carbon towards net-zero emissions in its advice on the sixth UK carbon budget for 2033-2037, due in September.

Trading places
Looking more closely at UK electricity generation in 2019, Carbon Brief’s analysis shows why there was so little growth for low-carbon sources compared to the previous year.

There was another increase for wind power in 2019 (up 8TWh, 14%), with record wind generation as several large new windfarms were completed including the 1.2GW Hornsea One project in October and the 0.6GW Beatrice offshore windfarm in Q2 of 2019. But this was offset by a decline for nuclear (down 9TWh, 14%), due to ongoing outages for reactors at Hunterston in Scotland and Dungeness in Kent.

(Analysis of data held by trade organisation RenewableUK suggests some 0.6GW of onshore wind capacity also started operating in 2019, including the 0.2GW Dorenell scheme in Moray, Scotland.)

As a result of these movements, the UK’s windfarms overtook nuclear for the first time ever in 2019, becoming the country’s second-largest source of electricity generation, and earlier, wind and solar together surpassed nuclear in the UK as momentum built. This is shown in the figure below, with wind (green line, top panel) trading places with nuclear (purple) and gas (dark blue) down around 25% since 2010 but remaining the single-largest source.

 Annual electricity generation in the UK by fuel, terawatt hours, 2010-2019. Top panel: fuel by fuel. Bottom panel: cumulative total generation from all sources. Source: BEIS energy trends, BM Reports and Carbon Brief analysis. Chart by Carbon Brief using Highcharts.
The UK’s currently suspended nuclear plants are due to return to service in January and March, according to operator EDF, the French state-backed utility firm. However, as noted above, most of the UK’s nuclear fleet is set to retire during the 2020s, with only Sizewell B in Suffolk due to still be operating by 2030. Hunterston is scheduled to retire by 2023 and Dungeness by 2028.

Set against these losses, the UK has a pipeline of offshore windfarms, secured via “contracts for difference” with the government, at a series of auctions. The most recent auction, in September 2019, saw prices below £40 per megawatt hour – similar to current wholesale electricity prices.

However, the capacity contracted so far is not sufficient to meet the government’s target of 40GW by 2030, meaning further auctions – or some other policy mechanism – will be required.

Coal zero
As well as the switch between wind and nuclear, 2019 also saw coal fall below solar for the first time across a full year, echoing the 2016 moment when wind outgenerated coal across the UK, after it suffered another 60% reduction in electricity output. Just six coal plants remain in the UK, with Aberthaw B in Wales and Fiddlers Ferry in Cheshire closing in March.

Coal accounted for just 2% of UK generation in 2019, a record-low coal share since centralised electricity supplies started to operate in 1882. The fuel met 40% of UK needs as recently as 2012, but has plummeted thanks to falling demand, rising renewables, cheaper gas and higher CO2 prices.

The reduction in average coal generation hides the fact that the fuel is now often not required at all to meet the UK’s electricity needs. The chart below shows the number of days each year when coal output was zero in 2019 (red line) and the two previous years (blue).

 Cumulative number of days when UK electricity generation from renewable sources has been higher than that from fossil fuels. Source: BEIS energy trends, BM Reports and Carbon Brief analysis. Chart by Carbon Brief using Highcharts.
The 83 days in 2019 with zero coal generation amount to nearly a quarter of the year and include the record-breaking 18-day stretch without the fuel.

Great Britain has been running for a record TWO WEEKS without using coal to generate electricity – the first time this has happened since 1882.

The country’s grid has been coal-free for 45% of hours in 2019 so far.https://www.carbonbrief.org/countdown-to-2025-tracking-the-uk-coal-phase-out …

Coal generation was set for significant reductions around the world in 2019 – including a 20% reduction for the EU as a whole – according to analysis published by Carbon Brief in November.

Notably, overall UK electricity generation fell by another 9TWh in 2019 (3%), bringing the total decline to 58TWh since 2010. This is equivalent to more than twice the output from the Hinkley C scheme being built in Somerset. As Carbon Brief explained last year, falling demand has had a similar impact on electricity-sector CO2 emissions as the increase in output from renewables.

This is illustrated by the fact that the 9TWh reduction in overall generation translated into a 9TWh (6%) cut in fossil-fuel generation during 2019, with coal falling by 10TWh and gas rising marginally.

Increasingly renewable
As fossil-fuel output and overall generation have declined, the UK’s renewable sources of electricity have continued to increase. Their output has risen nearly five-fold in the past decade and their share of the UK total has increased from 7% in 2010 to 37% in 2019.

As a result, the UK’s increasingly renewable grid is seeing more minutes, hours and days during which the likes of wind, solar and biomass collectively outpace all fossil fuels put together, and on some days wind is the main source as well.

The chart below shows the number of days during each year when renewables generated more electricity than fossil fuels in 2019 (red line) and each of the previous four years (blue lines). In total, nearly two-fifths of days in 2019 crossed this threshold.

 Cumulative number of days when the UK has not generated any electricity from coal. Source: BEIS energy trends, BM Reports and Carbon Brief analysis. Chart by Carbon Brief using Highcharts.
There were also four months in 2019 when renewables generated more of the UK’s electricity than fossil fuels: March, August, September and December. The first ever such month came in September 2018 and more are certain to follow.

National Grid, which manages Great Britain’s high-voltage electricity transmission network, is aiming to be able to run the system without fossil fuels by 2025, at least for short periods. At present, it sometimes has to ask windfarm operators to switch off and gas plants to start running in order to keep the electricity grid stable.

Note that biomass accounted for 11% of UK electricity generation in 2019, nearly a third of the total from all renewables. Some two-thirds of the biomass output is from “plant biomass”, primarily wood pellets burnt at Lynemouth in Northumberland and the Drax plant in Yorkshire. The remainder was from an array of smaller sites based on landfill gas, sewage gas or anaerobic digestion.

The CCC says the UK should “move away” from large-scale biomass power plants, once existing subsidy contracts for Drax and Lynemouth expire in 2027.

Using biomass to generate electricity is not zero-carbon and in some circumstances could lead to higher emissions than from fossil fuels. Moreover, there are more valuable uses for the world’s limited supply of biomass feedstock, the CCC says, including carbon sequestration and hard-to-abate sectors with few alternatives.

Methodology
The figures in the article are from Carbon Brief analysis of data from BEIS Energy Trends chapter 5 and chapter 6, as well as from BM Reports. The figures from BM Reports are for electricity supplied to the grid in Great Britain only and are adjusted to include Northern Ireland.

In Carbon Brief’s analysis, the BM Reports numbers are also adjusted to account for electricity used by power plants on site and for generation by plants not connected to the high-voltage national grid. This includes many onshore windfarms, as well as industrial gas combined heat and power plants and those burning landfill gas, waste or sewage gas.

By design, the Carbon Brief analysis is intended to align as closely as possible to the official government figures on electricity generated in the UK, reported in BEIS Energy Trends table 5.1.

Briefly, the raw data for each fuel is in most cases adjusted with a multiplier, derived from the ratio between the reported BEIS numbers and unadjusted figures for previous quarters.

Carbon Brief’s method of analysis has been verified against published BEIS figures using “hindcasting”. This shows the estimates for total electricity generation from fossil fuels or renewables to have been within ±3% of the BEIS number in each quarter since Q4 2017. (Data before then is not sufficient to carry out the Carbon Brief analysis.)

For example, in the second quarter of 2019, a Carbon Brief hindcast estimates gas generation at 33.1TWh, whereas the published BEIS figure was 34.0TWh. Similarly, it produces an estimate of 27.4TWh for renewables, against a BEIS figure of 27.1TWh.

National Grid recently shared its own analysis for electricity in Great Britain during 2019 via its energy dashboard, which differs from Carbon Brief’s figures.


Related News

View more

3-layer non-medical masks now recommended by Canada's top public health doctor

Canada Three-Layer Mask Recommendation advises non-medical masks with a polypropylene filter layer and tightly woven cotton, aligned with WHO guidance, to curb COVID-19 aerosols indoors through better fit, coverage, and public health compliance.


Key Points

PHAC advises three-layer non-medical masks with a polypropylene filter to improve indoor COVID-19 protection.

✅ Two fabric layers plus a non-woven polypropylene filter

✅ Ensure snug fit: cover nose, mouth, chin without gaps

✅ Aligns with WHO guidance for aerosols and droplets


The Public Health Agency of Canada is now recommending Canadians choose three-layer non-medical masks with a filter layer to prevent the spread of COVID-19, even as an IEA report projects higher electricity needs for net-zero, as they prepare to spend more time indoors over the winter.

Chief Public Health Officer Dr. Theresa Tam made the recommendation during her bi-weekly pandemic briefing in Ottawa Tuesday, as officials also track electricity grid security amid critical infrastructure concerns.

"To improve the level of protection that can be provided by non-medical masks or face coverings, we are recommending that you consider a three-layer nonmedical mask," she said.


Trust MedProtect For All Your Mask Protection

www.medprotect.ca/collections/protective-masks

According to recently updated guidelines, two layers of the mask should be made of a tightly woven fabric, such as cotton or linen, and the middle layer should be a filter-type fabric, such as non-woven polypropylene fabric, as Canada explores post-COVID manufacturing capacity for PPE.

"We're not necessarily saying just throw out everything that you have," Tam told reporters, suggesting adding a filter can help with protection.

The Public Health website now includes instructions for making three-layer masks, while national goals like Canada's 2050 net-zero target continue to shape recovery efforts.

The World Health Organization has recommended three layers for non-medical masks since June, and experts note that cleaning up Canada's electricity is critical to broader climate resilience. When pressed about the sudden change for Canada, Tam said the research has evolved.

"This is an additional recommendation just to add another layer of protection. The science of masks has really accelerated during this particular pandemic. So we're just learning again as we go," she said.

"I do think that because it's winter, because we're all going inside, we're learning more about droplets and aerosols, and how indoor comfort systems from heating to air conditioning costs can influence behaviors."

She also urged Canadians to wear well-fitted masks that cover the nose, mouth and chin without gaping, as the federal government advances emissions and EV sales regulations alongside public health guidance.

Trust MedProtect For All Your Mask Protection

www.medprotect.ca/collections/protective-masks


Related News

View more

Class-action lawsuit: Hydro-Québec overcharged customers up to $1.2B

Hydro-QuE9bec Class-Action Lawsuit alleges overbilling and monopoly abuse, citing RE9gie de l'E9nergie rate increases, Quebec Superior Court filings, and calls for refunds on 2008-2013 electricity bills to residential and business customers.


Key Points

Quebec class action alleging Hydro-QuE9bec overbilled customers in 2008-2013, seeking court-ordered refunds.

✅ Filed in Quebec Superior Court; certification pending.

✅ Alleges up to $1.2B in overcharges from 2008-2013.

✅ Questions RE9gie de l'E9nergie rate approvals and data.


A group representing Hydro-Québec customers has filed a motion for a class-action lawsuit against the public utility, alleging it overcharged customers over a five-year period.

Freddy Molima, one of the representatives of the Coalition Peuple allumé, accuses Hydro-Québec of "abusing its monopoly."

The motion, which was filed in Quebec Superior Court, claims Hydro-Québec customers paid more than they should have for electricity between 2008 and 2013, to the tune of nearly $1.2 billion, even as Hydro-Québec later refunded $535 million to customers in a separate case. 

The coalition has so far recruited nearly 40,000 participants online as part of its plan to sue the public utility.

A lawyer representing the group said Quebec's energy board, the Régie de l'énergie, also recently approved Hydro-Québec rate increases for residential and business customers without knowing all the facts, even as Manitoba Hydro hikes face opposition in regulatory hearings.

"There's certain information provided to the Régie that isn't true," said Bryan Furlong. "Hydro-Québec has not been providing the Régie the proper numbers."

In its motion, the group asks that overcharged clients be retroactively reimbursed.

Hydro-Québec denies allegations

Hydro-Québec, for its part, denies it ever overbilled any of its clients, while other utilities such as Hydro One plan to redesign bills to improve clarity.

"All our efficiencies have been returned to the government through our profits, and to Quebecers we have billed exactly what we agreed to bill," said spokesperson Serge Abergel, adding that the utility won't seek a rate hike next year according to its current plans.

Quebec Energy Minister Pierre Moreau also came to the public utility's defence, saying it has no choice but to comply with the  energy board's regulations, while customer protections are in focus as Hydro One moves to reconnect 1,400 customers in Ontario.

The group says the public utility has overbilled clients by up to $1.2 billion. (Radio-Canada)

It would be "shocking" if customers were charged too much money, he added.

"I know for a fact that Hydro-Québec is respecting the decision of this body," he said.

While the motion has been filed, the group cannot say how much each customer would receive if the class-action lawsuit goes ahead because it all depends on how much electricity was consumed by each client over that five-year period.

The coalition plans to present its motion to a judge next February.


Related News

View more

Ireland announces package of measures to secure electricity supplies

Ireland electricity support measures include PSO levy rebates, RESS 2 renewables, CRU-directed EirGrid backup capacity, and grid investment for the Celtic Interconnector, cutting bills, boosting security of supply, and reducing reliance on imported fossil fuels.


Key Points

Government steps to cut bills and secure supply via PSO rebates, RESS 2 renewables, backup power, and grid upgrades.

✅ PSO levy rebates lower domestic electricity bills.

✅ RESS 2 adds wind, solar, and hydro to the grid.

✅ EirGrid to procure temporary backup capacity for winter peaks.


Ireland's Cabinet has approved a package of measures to help mitigate the rising cost of rising electricity bills, as Irish provider price increases continue to pressure consumers, and to ensure secure supplies to electricity for households and business across Ireland over the coming years.

The package of measures includes changes to the Public Service Obligation (PSO) levy (beyond those announced earlier in the year), which align with emerging EU plans for more fixed-price electricity contracts to improve price stability. The changes will result in rebates, and thus savings, for domestic electricity bills over the course of the next PSO year beginning in October. This further reduction in the PSO levy occurs because of a fall in the relative cost of renewable energy, compared to fossil fuel generation.

The Government has also approved the final results of the second onshore Renewable Electricity Support Scheme (RESS 2) auction, echoing how Ontario's electricity auctions have aimed to lower costs for consumers. This will bring significantly more indigenous wind, solar and hydro-electric energy onto the National Grid. This, in turn, will reduce our reliance on increasingly expensive imported fossil fuels, as the UK explores ending the gas-electricity price link to curb bills.

The package also includes Government approval for the provision of funding for back-up generation capacity, to address risks to security of electricity supply over the coming winters, similar to the UK's forthcoming energy security law approach in this area. The Commission for the Regulation of Utilities (CRU), which has statutory responsibility for security of supply, has directed EirGrid to procure additional temporary emergency generation capacity (for the winters of 2023/2024 to 2025/2026). This will ultimately provide flexible and temporary back-up capacity, to safeguard secure supplies of electricity for households and businesses as we deploy longer-term generation capacity.

Today’s measures also see an increased borrowing limit (€3 billion) for EirGrid – to strengthen our National Grid as part of 'Shaping Our Electricity Future' and to deliver the Celtic (Ireland-France) Interconnector, amid wider European moves to revamp the electricity market that could enhance cross-border resilience. An increased borrowing limit (€650 million) for Bord na Móna will drive greater deployment of indigenous renewable energy across the Midlands and beyond – as part of its 'Brown to Green' strategy, while measures like the UK's household energy price cap illustrate the scale of consumer support elsewhere.


Related News

View more

Overturning statewide vote, Maine court energizes Hydro-Quebec's bid to export power

Maine Hydropower Transmission Line revived by high court after referendum challenge, advancing NECEC, Hydro-Quebec supply, Central Maine Power partnership, clean energy integration, grid reliability, and lower rates across New England pending land-lease ruling.


Key Points

A court-revived NECEC line delivering 1,200 MW of Hydro-Quebec hydropower via CMP to strengthen the New England grid.

✅ Maine high court deems retroactive referendum unconstitutional

✅ Pending state land lease case may affect final route

✅ Project could lower rates and cut emissions in New England


Maine's highest court on Tuesday breathed new life into a $1-billion US transmission line that aims to serve as conduit for Canadian hydropower, after construction starts drew scrutiny, ruling that a statewide vote rebuking the project was unconstitutional.

The Supreme Judicial Court ruled that the retroactive nature of the referendum last year violated the project developer's constitutional rights, sending it back to a lower court for further proceedings.

The court did not rule in a separate case that focuses on a lease for a 1.6-kilometre portion of the proposed power line that crosses state land.

Central Maine Power's parent company and Hydro-Québec teamed up on the project that would supply up to 1,200 megawatts of Canadian hydropower, amid the ongoing Maine-Quebec corridor debate in the region. That's enough electricity for one million homes.

Most of the proposed 233-kilometre power transmission line would be built along existing corridors, but a new 85-kilometre section was needed to reach the Canadian border, echoing debates around the Northern Pass clash in New Hampshire.

Workers were already clearing trees and setting poles when the governor asked for work to be suspended after the referendum in November 2021, mirroring New Hampshire's earlier rejection of a Quebec-Massachusetts proposal that rerouted regional plans. The Maine Department of Environmental Protection later suspended its permit, but that could be reversed depending on the outcome of legal proceedings.

The high court was asked to weigh in on two separate lawsuits. Developers sought to declare the referendum unconstitutional while another lawsuit focused on a lease allowing transmission lines to cross a short segment of state-owned land.

Supporters say bold projects such as this one, funded by ratepayers in Massachusetts, are necessary to battle climate change and introduce additional electricity into a region that's heavily reliant on natural gas, which can cause spikes in energy costs, as seen with Nova Scotia rate increases recently across the Atlantic region.

Critics say the project's environmental benefits are overstated — and that it would harm the woodlands in western Maine.

It was the second time the Supreme Judicial Court was asked to weigh in on a referendum aimed at killing the project. The first referendum proposal never made it onto the ballot after the court raised constitutional concerns.

Although the project is funded by Massachusetts ratepayers, the introduction of so much electricity to the grid would serve to stabilize or reduce electricity rates for all consumers, proponents contend, even as Manitoba Hydro rate hikes face opposition elsewhere.

The referendum on the project was the costliest in Maine history, topping $90 million US and underscoring deep divisions.

The high-stakes campaign put environmental and conservation groups at odds, and pitted utilities backing the project, amid the Hydro One-Avista backlash, against operators of fossil fuel-powered plants that stand to lose money.


Related News

View more

BloombergNEF: World offshore wind costs 'drop 32% per cent'

Global Renewable LCOE Trends reveal offshore wind costs down 32%, with 10MW turbines, lower CAPEX and OPEX, and parity for solar PV and onshore wind in Europe, China, and California, per BloombergNEF analysis.


Key Points

Benchmarks showing falling LCOE for offshore wind, onshore wind, and solar PV, driven by larger turbines and lower CAPEX

✅ Offshore wind LCOE $78/MWh; $53-64/MWh in DK/NL excl. transmission

✅ Onshore wind $47/MWh; solar PV $51/MWh, best $26-36/MWh

✅ Cost drivers: 10MW turbines, lower CAPEX/OPEX, weak China demand


World offshore wind costs have fallen 32% from just a year ago and 12% compared with the first half of 2019, according to a BNEF long-term outlook from BloombergNEF.

In its latest Levelized Cost of Electricity (LCOE) Update, BloombergNEF said its current global benchmark LCOE estimate for offshore wind is $78 a megawatt-hour.

“New offshore wind projects throughout Europe, including the UK's build-out, now deploy turbines with power ratings up to 10MW, unlocking CAPEX and OPEX savings,” BloombergNEF said.

In Denmark and the Netherlands, it expects the most recent projects financed to achieve $53-64/MWh excluding transmission.

New solar and onshore wind projects have reached parity with average wholesale power prices in California and parts of Europe, while in China levelised costs are below the benchmark average regulated coal price, according to BloombergNEF.

The company's global benchmark levelized cost figures for onshore wind and PV projects financed in the last six months are at $47 and $51 a megawatt-hours, underscoring that renewables are now the cheapest new electricity option in many regions, down 6% and 11% respectively compared with the first half of 2019.

BloombergNEF said for wind this is mainly down to a fall in the price of turbines – 7% lower on average globally compared with the end of 2018.

In China, the world’s largest solar market, the CAPEX of utility-scale PV plants has dropped 11% in the last six months, reaching $0.57m per MW.

“Weak demand for new plants in China has left developers and engineering, procurement and construction firms eager for business, and this has put pressure on CAPEX,” BloombergNEF said.

It added that estimates of the cheapest PV projects financed recently – in India, Chile and Australia – will be able to achieve an LCOE of $27-36/MWh, assuming competitive returns for their equity investors.

Best-in-class onshore wind farms in Brazil, India, Mexico and Texas can reach levelized costs as low as $26-31/MWh already, the research said.

Programs such as the World Bank wind program are helping developing countries accelerate wind deployment as costs continue to drop.

BloombergNEF associate in the energy economics team Tifenn Brandily said: “This is a three- stage process. In phase one, new solar and wind get cheaper than new gas and coal plants on a cost-of- energy basis.

“In phase two, renewables reach parity with power prices. In phase three, they become even cheaper than running existing thermal plants.

“Our analysis shows that phase one has now been reached for two-thirds of the global population.

“Phase two started with California, China and parts of Europe. We expect phase three to be reached on a global scale by 2030.

“As this all plays out, thermal power plants will increasingly be relegated to a balancing role, looking for opportunities to generate when the sun doesn’t shine or the wind doesn’t blow.”


Related News

View more

Sign Up for Electricity Forum’s Newsletter

Stay informed with our FREE Newsletter — get the latest news, breakthrough technologies, and expert insights, delivered straight to your inbox.

Electricity Today T&D Magazine Subscribe for FREE

Stay informed with the latest T&D policies and technologies.
  • Timely insights from industry experts
  • Practical solutions T&D engineers
  • Free access to every issue

Download the 2025 Electrical Training Catalog

Explore 50+ live, expert-led electrical training courses –

  • Interactive
  • Flexible
  • CEU-cerified