Minnesota Signs Deal With Manitoba Hydro
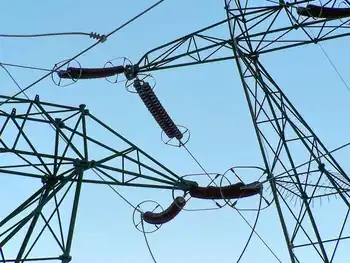
WINNIPEG -- - The Minnesota Public Utilities Commission has unanimously approved a $1.7 billion power export deal with Manitoba Hydro.
It allows Minneapolis-based Xcel Energy to import power from Manitoba Hydro, despite the objections of aboriginal groups.
The 500-megawatt, 10-year deal was given the go-ahead.
It's an extension of an existing deal and will allow power to be exported until 2015.
Approval by Canada's National Energy Board is pending.
The Minnesota decision is a blow to the Pimicikamak Cree Nation of Cross Lake, Manitoba. They had asked the commission to first call a formal hearing into the social and economic impact of historic hydro development on their homeland.
Related News
NDP takes aim at approval of SaskPower 8 per cent rate hike
REGINA - SaskPower Rate Hike 2022-2023 signals higher electricity rates in Saskatchewan as natural gas costs surge; the Rate Review Panel approved increases, affecting residential utility bills amid affordability concerns and government energy policy shifts.
Key Points
An 8% SaskPower electricity rate increase split 4% in Sept 2022 and 4% in Apr 2023, driven by natural gas costs.
✅ 4% increase Sept 1, 2022; +4% on Apr 1, 2023
✅ Panel-approved amid natural gas price surge and higher fuel costs
✅ Avg residential bill up about $5 per step; affordability concerns
The NDP Opposition is condemning the provincial…