Italian wind power up 30 per cent in 2009

By Reuters


NFPA 70e Training

Our customized live online or in‑person group training can be delivered to your staff at your location.

  • Live Online
  • 6 hours Instructor-led
  • Group Training Available
Regular Price:
$199
Coupon Price:
$149
Reserve Your Seat Today
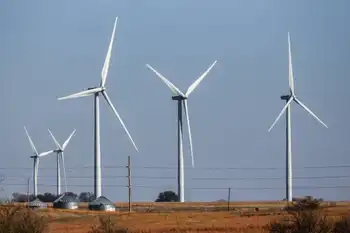
Italy's installed wind power capacity rose more than 30 percent last year to 4,850 megawatts, boosted by record installation, industry associations said.

Installation in 2009 was 1,114 megawatts, in line with that of previous years, they said in a joint statement. Wind power production was a record of about 6.7 terawatt hours, or 2.1 percent of internal consumption.

The growth came "despite the financial crisis that overran the national and international economies in 2009," said the statement from the National Wind Energy Association (ANEV), the Board for New Technology (ENEA), the Renewable Energy Producers Association (APER) and the Italian unit of the International Solar Energy Society.

Italy is third in Europe and sixth in the world in wind power production despite lacking overall rules for the sector, it said.

Swift action by the government on that issue would allow Italy to reach its potential wind power capacity of more than 16,000 megawatts, the statement said.

Related News

European responses to Covid-19 accelerate electricity system transition by a decade - Wartsila

EU-UK Coal Power Decline 2020 underscores Covid-19's impact on power generation, with renewables rising, carbon emissions falling, and electricity demand down, revealing resilient grids and accelerating the energy transition across European markets.


Key Points

Covid-19's impact on EU-UK power: coal down, renewables up, lower emissions intensity and reduced electricity demand.

✅ Coal generation down 25.5% EU-UK; 29% in March 10-April 10 period

✅ Renewables share up to 46%; grids remained stable and flexible

✅ Electricity demand fell 10%; emissions intensity dropped 19.5%


Coal based power generation has fallen by over a quarter (25.5%) across the European Union (EU) and United Kingdom (UK) in the first three months of 2020, compared to 2019, as a result of the response to Covid-19, with renewable energy reaching a 43% share, as wind and solar outpaced gas across the EU, according to new analysis by the technology group Wärtsilä.

The impact is even more stark in the last month, with coal generation collapsing by almost one third (29%) between March 10 and April 10 compared to the same period in 2019, making up only 12% of total EU and UK generation. By contrast, renewables delivered almost half (46%) of generation – an increase of 8% compared to 2019.

In total, demand for electricity across the continent is down by one tenth (10%), mirroring global demand declines of around 15%, due to measures taken to combat Covid-19, the biggest drop in demand since the Second World War. The result is an unprecedented fall in carbon emissions from the power sector, with emission intensity falling by 19.5% compared to the same March 10-April 10 period last year. The analysis comes from the Wärtsilä Energy Transition Lab, a new free-to-use data platform developed by Wärtsilä to help the industry, policy makers and the public understand the impact of Covid-19 on European electricity markets and analyse what this means for the future design and operation of its energy systems. The goal is to help accelerate the transition to 100% renewables.

Björn Ullbro, Vice President for Europe & Africa at Wärtsilä Energy Business, said: “The impact of the Covid-19 crisis on European energy systems is extraordinary. We are seeing levels of renewable electricity that some people believed would cause systems to collapse, yet they haven’t – in fact they are coping well. The question is, what does this mean for the future?”

“What we can see today is how our energy systems cope with much more renewable power – knowledge that will be invaluable, aligning with IAEA low-carbon insights, to accelerate the energy transition. We are making this new platform freely available to support the energy industry to adapt and use the momentum this tragic crisis has created to deliver a better, cleaner energy system, faster.”

The figures mark a dramatic shift in Europe’s energy mix – one that was not anticipated to occur until the end of the decade. The impact of the Covid-19 crisis has effectively accelerated the energy transition in the short-term, even as later lockdowns saw power demand hold firm in parts of Europe, providing a unique opportunity to see how energy systems function with far higher levels of renewables.

Ullbro added: “Electricity demand across Europe has fallen due to the lockdown measures applied by governments to stop the spread of the coronavirus. However, total renewable generation has remained at pre-crisis levels with low electricity prices, combined with renewables-friendly policy measures, crowding out gas and fossil fuel power generation, especially coal. This sets the scene for the next decade of the energy transition.”

These Europe-wide impacts are mirrored at a national level, for example:

  • In the UK, renewables now have a 43% share of generation, following a stall in low-carbon progress in 2019 (up 10% on the same March 10-April 10 period in 2019) with coal power down 35% and gas down 24%.
  • Germany has seen the share of renewables reach 60% (up 12%) and coal generation fall 44%, resulting in a fall in the carbon intensity of its electricity of over 30%.
  • Spain currently has 49% renewables with coal power down by 41%.
  • Italy has seen the steepest fall in demand, down 21% so far.

An industry first, the Wärtsilä Energy Transition Lab has been specifically developed as an open-data platform for the energy industry to understand the impact of Covid-19 and help accelerate the energy transition. The tool provides detailed data on electricity generation, demand and pricing for all 27 EU countries and the UK, combining Entso-E data in a single, easy to use platform. It will also allow users to model how systems could operate in future with higher renewables, as global power demand surpasses pre-pandemic levels, helping pinpoint problem areas and highlight where to focus policy and investment.


Related News

View more

Which of the cleaner states imports dirty electricity?

Hourly Electricity Emissions Tracking maps grid balancing areas, embodied emissions, and imports/exports, revealing carbon intensity shifts across PJM, ERCOT, and California ISO, and clarifying renewable energy versus coal impacts on health and climate.


Key Points

An hourly method tracing generation, flows, and embodied emissions to quantify carbon intensity across US balancing areas.

✅ Hourly traces of imports/exports and generation mix

✅ Consumption-based carbon intensity by balancing area

✅ Policy insights for renewables, coal, health costs


In the United States, electricity generation accounts for nearly 30% of our carbon emissions. Some states have responded to that by setting aggressive renewable energy standards; others are hoping to see coal propped up even as its economics get worse. Complicating matters further is the fact that many regional grids are integrated, and as America goes electric the stakes grow, meaning power generated in one location may be exported and used in a different state entirely.

Tracking these electricity exports is critical for understanding how to lower our national carbon emissions. In addition, power from a dirty source like coal has health and environment impacts where it's produced, and the costs of these aren't always paid by the parties using the electricity. Unfortunately, getting reliable figures on how electricity is produced and where it's used is challenging, even for consumers trying to find where their electricity comes from in the first place, leaving some of the best estimates with a time resolution of only a month.

Now, three Stanford researchers—Jacques A. de Chalendar, John Taggart, and Sally M. Benson—have greatly improved on that standard, and they have managed to track power generation and use on an hourly basis. The researchers found that, of the 66 grid balancing areas within the United States, only three have carbon emissions equivalent to our national average, and they have found that imports and exports of electricity have both seasonal and daily changes. de Chalendar et al. discovered that the net results can be substantial, with imported electricity increasing California's emissions/power by 20%.

Hour by hour
To figure out the US energy trading landscape, the researchers obtained 2016 data for grid features called balancing areas. The continental US has 66 of these, providing much better spatial resolution on the data than the larger grid subdivisions. This doesn't cover everything—several balancing areas in Canada and Mexico are tied in to the US grid—and some of these balancing areas are much larger than others. The PJM grid, serving Pennsylvania, New Jersey, and Maryland, for example, is more than twice as large as Texas' ERCOT, in a state that produces and consumes the most electricity in the US.

Despite these limitations, it's possible to get hourly figures on how much electricity was generated, what was used to produce it, and whether it was used locally or exported to another balancing area. Information on the generating sources allowed the researchers to attach an emissions figure to each unit of electricity produced. Coal, for example, produces double the emissions of natural gas, which in turn produces more than an order of magnitude more carbon dioxide than the manufacturing of solar, wind, or hydro facilities. These figures were turned into what the authors call "embodied emissions" that can be traced to where they're eventually used.

Similar figures were also generated for sulfur dioxide and nitrogen oxides. Released by the burning of fossil fuels, these can both influence the global climate and produce local health problems.

Huge variation
The results were striking. "The consumption-based carbon intensity of electricity varies by almost an order of magnitude across the different regions in the US electricity system," the authors conclude. The low is the Bonneville Power grid region, which is largely supplied by hydropower; it has typical emissions below 100kg of carbon dioxide per megawatt-hour. The highest emissions come in the Ohio Valley Electric region, where emissions clear 900kg/MW-hr. Only three regional grids match the overall grid emissions intensity, although that includes the very large PJM (where capacity auction payouts recently fell), ERCOT, and Southern Co balancing areas.

Most of the low-emissions power that's exported comes from the Pacific Northwest's abundant hydropower, while the Rocky Mountains area exports electricity with the highest associated emissions. That leads to some striking asymmetries. Local generation in the hydro-rich Idaho Power Company has embodied emissions of only 71kg/MW-hr, while its imports, coming primarily from Rocky Mountain states, have a carbon content of 625kg/MW-hr.

The reliance on hydropower also makes the asymmetry seasonal. Local generation is highest in the spring as snow melts, but imports become a larger source outside this time of year. As solar and wind can also have pronounced seasonal shifts, similar changes will likely be seen as these become larger contributors to many of these regional grids. Similar things occur daily, as both demand and solar production (and, to a lesser extent, wind) have distinct daily profiles.

The Golden State
California's CISO provides another instructive case. Imports represent less than 30% of its total electric use in 2016, yet California electricity imports provided 40% of its embodied emissions. Some of these, however, come internally from California, provided by the Los Angeles Department of Water and Power. The state itself, however, has only had limited tracking of imported emissions, lumping many of its sources as "other," and has been exporting its energy policies to Western states in ways that shape regional markets.

Overall, the 2016 inventory provides a narrow picture of the US grid, as plenty of trends are rapidly changing our country's emissions profile, including the rise of renewables and the widespread adoption of efficiency measures and other utility trends in 2017 that continue to evolve. The method developed here can, however, allow for annual updates, providing us with a much better picture of trends. That could be quite valuable to track things like how the rapid rise in solar power is altering the daily production of clean power.

More significantly, it provides a basis for more informed policymaking. States that wish to promote low-emissions power can use the information here to either alter the source of their imports or to encourage the sites where they're produced to adopt more renewable power. And those states that are exporting electricity produced primarily through fossil fuels could ensure that the locations where the power is used pay a price that includes the health costs of its production.


Related News

View more

Attacks on power substations are growing. Why is the electric grid so hard to protect?

Power Grid Attacks surge across substations and transmission lines, straining critical infrastructure as DHS and FBI cite vandalism, domestic extremists, and cybersecurity risks impacting resilience, outages, and grid reliability nationwide.


Key Points

Power Grid Attacks are deliberate strikes on substations and lines to disrupt power and weaken grid reliability.

✅ Physical attacks rose across multiple states and utilities.

✅ DHS and FBI warn of threats to critical infrastructure.

✅ Substation security and grid resilience upgrades urged.


Even before Christmas Day attacks on power substations in five states in the Pacific Northwest and Southeast, similar incidents of attacks, vandalism and suspicious activity were on the rise.

Federal energy reports through August – the most recent available – show an increase in physical attacks at electrical facilities across the nation this year, continuing a trend seen since 2017.

At least 108 human-related events were reported during the first eight months of 2022, compared with 99 in all of 2021 and 97 in 2020. More than a dozen cases of vandalism have been reported since September.

The attacks have prompted a flurry of calls to better protect the nation's power grid, with a renewed focus on protecting the U.S. power grid across sectors, but experts have warned for more than three decades that stepped-up protection was needed.

Attacks on power stations on the rise 
Twice this year, the Department of Homeland Security warned "a heightened threat environment" remains for the nation, including its critical infrastructure amid reports of suspected Russian breaches of power plant systems. 

At least 20 actual physical attacks were reported, compared with six in all of 2021. 
Suspicious-activity reports jumped three years ago, nearly doubling in 2020 to 32 events. In the first eight months of this year, 34 suspicious incidents were reported.
Total human-related incidents – including vandalism, suspicious activity and cyber events such as Russian hackers and U.S. utilities in recent years – are on track to be the highest since the reports started showing such activity in 2011.


Attacks reported in at least 5 states
Since September, attacks or potential attacks have been reported on at least 18 additional substations and one power plant in Florida, Oregon, Washington and the Carolinas. Several involved firearms.

  • In Florida: Six "intrusion events" occurred at Duke Energy substations in September, resulting in at least one brief power outage, according to the News Nation television network, which cited a report the utility sent to the Energy Department. Duke Energy spokesperson Ana Gibbs confirmed a related arrest, but the company declined to comment further.
  • In Oregon and Washington state: Substations were attacked at least six times in November and December, with firearms used in some cases, local news outlets reported. On Christmas Day, four additional substations were vandalized in Washington State, cutting power to more than 14,000 customers.
  • In North Carolina: A substation in Maysville was vandalized on Nov. 11. On Dec. 3, shootings that authorities called a "targeted attack" damaged two power substations in Moore County, leaving tens of thousands without power amid freezing temperatures.
  • In South Carolina: Days later, gunfire was reported near a hydropower plant, but police said the shooting was a "random act."

It's not yet clear whether any of the attacks were coordinated. After the North Carolina attacks, a coordinating council between the electric power industry and the federal government ordered a security evaluation.


FBI mum on its investigations
The FBI is looking into some of the attacks, including cyber intrusions where hackers accessed control rooms in past cases, but it hasn't said how many it's investigating or where. 

Shelley Lynch, a spokesperson for the FBI's Charlotte field office, confirmed the bureau was investigating the North Carolina attack. The Kershaw County Sheriff's Office reported the FBI was looking into the South Carolina incident.

Utilities in Oregon and Washington told news outlets they were cooperating with the FBI, but spokespeople for the agency's Seattle and Portland field offices said they couldn't confirm or deny an investigation.

Could domestic extremists be involved?
In January, the Department of Homeland Security said domestic extremists had been developing "credible, specific plans" since at least 2020, including a Neo-Nazi plot against power stations detailed in a federal complaint, and would continue to "encourage physical attacks against electrical infrastructure."

In February, three men who ascribed to white supremacy and Neo-Nazism pleaded guilty to federal crimes related to a scheme to attack the grid with rifles.

In a news release, Timothy Langan, assistant director of the FBI’s Counterterrorism Division, said the defendants "wanted to attack regional power substations and expected the damage would lead to economic distress and civil unrest."


Why is the power grid so hard to protect?
Industry experts, federal officials and others have warned in one report after another since at least 1990 that the power grid was at risk, and a recent grid vulnerability report card highlights dangerous weak points, said Granger Morgan, an engineering professor at Carnegie Mellon University who chaired three National Academies of Sciences reports.

The reports urged state and federal agencies to collaborate to make the system more resilient to attacks and natural disasters such as hurricanes and storms. 

"The system is inherently vulnerable, with the U.S. grid experiencing more blackouts than other developed nations in one study. It's spread all across the countryside," which makes the lines and substations easy targets, Morgan said. The grid includes more than 7,300 power plants, 160,000 miles of high-voltage power lines and 55,000 transmission substations.

One challenge is that there's no single entity whose responsibilities span the entire system, Morgan said. And the risks are only increasing as the grid expands to include renewable energy sources such as solar and wind, he said. 


Related News

View more

PG&E’s Pandemic Response Includes Precautionary Health and Safety Actions; Moratorium on Customer Shutoffs for Nonpayment

PG&E COVID-19 Shutoff Moratorium suspends service disconnections, offers flexible payment plans, and expands customer support with safety protocols, social distancing, and public health guidance for residential and commercial utility customers during the pandemic.


Key Points

A temporary halt to utility shutoffs with flexible payment plans to support PG&E customers during COVID-19.

✅ Suspends shutoffs for residential and commercial accounts

✅ Offers most flexible payment plans upon COVID-19 hardship

✅ Enhances safety: social distancing, PPE, remote work protocols


Pacific Gas and Electric Company has announced that due to the COVID-19 pandemic, it has voluntarily implemented a moratorium on service disconnections for non-payment, effective immediately. This suspension, similar to policies in New Jersey and New York, will apply to both residential and commercial customers and will remain in effect until further notice. To further support customers who may be impacted by the pandemic, PG&E will offer its most flexible pay plans to customers who indicate either an impact or hardship as a result of COVID-19. PG&E will continue to monitor current events and identify opportunities to support our customers and communities through concrete actions.

In addition to the moratorium on service shut-offs, PG&E’s response to the COVID-19 pandemic is focused on efforts to protect the health and safety of its customers, employees, contractors and the communities it serves, including ongoing wildfire risk reduction efforts that continue alongside its pandemic response. Actions the company has taken include providing guidance for employees who have direct customer contact to take social distancing precautionary measures, such as avoiding handshakes and wearing disposable nitrile gloves while in customers' homes, and continuing safety work related to power line-related fires across its service area.

Customers who visit local offices to pay bills and are sick or experiencing symptoms are being asked to use other payment options such as online or by phone, as seen when Texas utilities waived fees during the pandemic, at 1-877-704-8470.

“We recognize that this is a rapidly changing situation and an uncertain time for many of our customers. Our most important responsibility is the health and safety of our customers and employees. We also want to provide some relief from the stress and financial challenges many are facing during this worldwide, public health crisis, and with rates set to stabilize in 2025 the company remains focused on affordability. We understand that many of our customers may experience a personal financial strain due to the slowdown in the economy related to the pandemic, and programs like the Wildfire Assistance Program can help eligible customers,” said Chief Customer Officer and Senior Vice President Laurie Giammona.

Internally, the company is taking advanced cleaning measures, communicating best practices frequently with employees, and is asking its leaders to let employees work remotely if their job allows, while avoiding critical business disruption. PG&E has activated an enterprise-wide incident response team and is vigilantly monitoring the Centers for Disease Control and Prevention and World Health Organization for updates related to the virus. The company is committed to continue addressing customer service needs and does not expect any disruption in gas or electric service due to the public health crisis.


Related News

View more

New EPA power plant rules will put carbon capture to the test

CCUS in the U.S. Power Sector drives investments as DOE grants, 45Q tax credits, and EPA carbon rules spur carbon capture, geologic storage, and utilization, while debates persist over costs, transparency, reliability, and emissions safeguards.


Key Points

CCUS captures CO2 from power plants for storage or use, backed by 45Q tax credits, DOE funding, and EPA carbon rules.

✅ DOE grants and 45Q credits aim to de-risk project economics.

✅ EPA rules may require capture rates to meet emissions limits.

✅ Transparency and MRV guard against tax credit abuse.


New public and private funding, including DOE $110M for CCUS announced recently, and expected strong federal power plant emissions reduction standards have accelerated electricity sector investments in carbon capture, utilization and storage,’ or CCUS, projects but some worry it is good money thrown after bad.

CCUS separates carbon from a fossil fuel-burning power plant’s exhaust through carbon capture methods for geologic storage or use in industrial and other applications, according to the Department of Energy. Fossil fuel industry giants like Calpine and Chevron are looking to take advantage of new federal tax credits and grant funding for CCUS to manage potentially high costs in meeting power plant performance requirements, amid growing investor pressure for climate reporting, including new rules, expected from EPA soon, on reducing greenhouse gas emissions from existing power plants.

Power companies have “ambitious plans” to add CCUS to power plants, estimated to cause 25% of U.S. CO2 emissions. As a result, the power sector “needs CCUS in its toolkit,” said DOE Office of Fossil Energy and Carbon Management Assistant Secretary Brad Crabtree. Successful pilots and demonstrations “will add to investor confidence and lead to more deployment” to provide dispatchable clean energy, including emerging CO2-to-electricity approaches for power system reliability after 2030,| he added.

But environmentalists and others insist potentially cost-prohibitive CCUS infrastructure, including CO2 storage hub initiatives, must still prove itself effective under rigorous and transparent federal oversight.

“The vast majority of long-term U.S. power sector needs can be met without fossil generation, and better options are being deployed and in development,” Sierra Club Senior Advisor, Strategic Research and Development, Jeremy Fisher, said, pointing to carbon-free electricity investments gaining momentum in the market. CCUS “may be needed, but without better guardrails, power sector abuses of federal funding could lead to increased emissions and stranded fossil assets,” he added.

New DOE CCUS project grants, an increased $85 per metric ton, or tonne, federal 45Q tax credit, and the forthcoming EPA power plant carbon rules and the federal coal plan will do for CCUS what similar policies did for renewables, advocates and opponents agreed. But controversial past CCUS performance and tax credit abuses must be avoided with transparent reporting requirements for CO2 capture, opponents added.


Related News

View more

Solar PV and wind power in the US continue to grow amid favourable government plans

US Renewable Power Outlook 2030 projects surging capacity, solar PV and wind growth, grid modernization, and favorable tax credits, detailing market trends, CAGR, transmission expansion, and policy drivers shaping clean energy generation and consumption.


Key Points

A forecast of US power capacity, generation, and consumption, highlighting solar, wind, tax credits, and grid modernization.

✅ Targets 48.4% renewable capacity share by 2030

✅ Strong growth in solar PV and onshore wind installations

✅ Investment and tax credits drive grid and transmission upgrades


GlobalData’s latest report, ‘United States Power Market Outlook to 2030, Update 2021 – Market Trends, Regulations, and Competitive Landscape’ discusses the power market structure of the United States and provides historical and forecast numbers for capacity, generation and consumption up to 2030. Detailed analysis of the country’s power market regulatory structure, competitive landscape and a list of major power plants are provided. The report also gives a snapshot of the power sector in the country on broad parameters of macroeconomics, supply security, generation infrastructure, transmission and distribution infrastructure, about a quarter of U.S. electricity from renewables in recent years, electricity import and export scenario, degree of competition, regulatory scenario, and future potential. An analysis of the deals in the country’s power sector is also included in the report.

Renewable power held a 19% share of the US’s total power capacity in 2020, and in that year renewables became the second-most prevalent source in the U.S. electricity mix by generation; this share is expected to increase significantly to 48.4% by 2030. Favourable policies introduced by the US Government will continue to drive the country’s renewable sector, particularly solar photovoltaics (PV) and wind power, with wind now the most-used renewable source in the U.S. generation mix. Installed renewable capacity* increased from 16.5GW in 2000 to 239.2GW in 2020, growing at a compound annual growth rate (CAGR) of 14.3%. By 2030, the cumulative renewable capacity is expected to rise to 884.6GW, growing at a CAGR of 14% from 2020 to 2030. Despite increase in prices of renewable equipment, such as solar modules, in 2021, the US renewable sector will show strong growth during the 2021 to 2030 period as this increase in equipment prices are short term due to supply chain disruptions caused by the Covid-19 pandemic.

The expansion of renewable power capacity during the 2000 to 2020 period has been possible due to the introduction of federal schemes, such as Production Tax Credits, Investment Tax Credits and Manufacturing Tax Credits. These have massively aided renewable installations by bringing down the cost of renewable power generation and making it at par with power generated from conventional sources. Over the last few years, the cost of solar PV and wind power installations has declined sharply, and by 2023 wind, solar, and batteries made up most of the utility-scale pipeline across the US, highlighting investor confidence. Since 2010, the cost of utility-scale solar PV projects decreased by around 82% while onshore wind installations decreased by around 39%. This has supported the rapid expansion of the renewable market. However, the price of solar equipment has risen due to an increase in raw material prices and supply shortages. This may slightly delay the financing of some solar projects that are already in the pipeline.

The US will continue to add significant renewable capacity additions during the forecast period as industry outlooks point to record solar and storage installations over the coming years, to meet its target of reaching 80% clean energy by 2030. In November 2021, President Biden signed a $1tr Infrastructure Bill, within which $73bn is designated to renewables. This includes not just renewable capacity building, but also strengthening the country’s power grid and laying new high voltage transmission lines, both of which will be key to driving solar and wind power capacity additions as wind power surges in the U.S. electricity mix nationwide.

The US was one of the worst hit countries in the world due to the Covid-19 pandemic in 2020. With respect to the power sector, the electricity consumption in the country declined by 2.5% in 2020 as compared to 2019, even as renewable electricity surpassed coal in 2022 in the generation mix, highlighting continued structural change. Power plants that were under construction faced delays due to unavailability of components due to supply chain disruptions and unavailability of labour due to travel restrictions.

According to the US Energy Information Administration, 61 power projects, having a total capacity of 2.4GWm which were under construction during March and April 2020 were delayed because of the Covid-19 pandemic. Among renewable power technologies, solar PV and wind power projects were the most badly affected due to the pandemic.

In March and April 2020, 53 solar PV projects, having a total capacity of 1.3GW, and wind power projects, having a total capacity of 1.2GW, were delayed due to the Covid-19 pandemic. Moreover, several states suspended renewable energy auctions due to the pandemic.

For instance, New York State Energy Research and Development Authority (NYSERDA) had issued a new offshore wind solicitation for 1GW and up to 2.5GW in April 2020, but this was suspended due to the Covid-19 pandemic. In July 2020, the authority relaunched the tender for 2.5GW of offshore wind capacity, with a submission deadline in October 2020.

To ease the financial burden on consumers during the pandemic, more than 1,000 utilities in the country announced disconnection moratoria and implemented flexible payment plans. Duke Energy, American Electric Power, Dominion Power and Southern California Edison were among the major utilities that voluntarily suspended disconnections.


Related News

View more

Sign Up for Electricity Forum’s Newsletter

Stay informed with our FREE Newsletter — get the latest news, breakthrough technologies, and expert insights, delivered straight to your inbox.

Electricity Today T&D Magazine Subscribe for FREE

Stay informed with the latest T&D policies and technologies.
  • Timely insights from industry experts
  • Practical solutions T&D engineers
  • Free access to every issue

Live Online & In-person Group Training

Advantages To Instructor-Led Training – Instructor-Led Course, Customized Training, Multiple Locations, Economical, CEU Credits, Course Discounts.

Request For Quotation

Whether you would prefer Live Online or In-Person instruction, our electrical training courses can be tailored to meet your company's specific requirements and delivered to your employees in one location or at various locations.