Downed power line kills three

By Toronto Sun


NFPA 70b Training - Electrical Maintenance

Our customized live online or in‑person group training can be delivered to your staff at your location.

  • Live Online
  • 12 hours Instructor-led
  • Group Training Available
Regular Price:
$599
Coupon Price:
$499
Reserve Your Seat Today
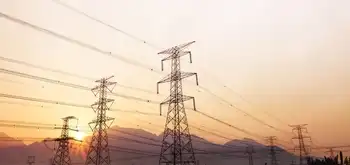
A father, mother and their son were electrocuted to death by a high-voltage power line in the backyard of their southern California home, according to fire officials.

Firefighters from the San Bernardino City Fire Department were called to the residence Friday morning, and told by a 17-year-old girl that her family was injured and collapsed in the yard.

But it was deemed unsafe to rescue them.

“Once one person was getting shocked, we think that the wife was trying to assist and the son was trying to assist and unfortunately they all succumbed to their injuries,” said Jason Serrano, fire department spokesman.

"It was a very unfortunate accident," Serrano said.

Investigators believe the father went outside to check out the loud popping noises, and in the dark failed to see the downed live wire.

The deceased are identified as a 43-year-old man, 42-year-old woman and a 21-year-old man.

The utility company was called to cut the power to the arcing 12,000-volt electrical line.

High winds of up to 95 km/h caused the line to fall, Serrano said.

A 17-year-old girl and 10-year-old, home at the time, were uninjured and are staying with family members.

San Bernardino is 88 kilometres east of Los Angeles.

Related News

Which of the cleaner states imports dirty electricity?

Hourly Electricity Emissions Tracking maps grid balancing areas, embodied emissions, and imports/exports, revealing carbon intensity shifts across PJM, ERCOT, and California ISO, and clarifying renewable energy versus coal impacts on health and climate.


Key Points

An hourly method tracing generation, flows, and embodied emissions to quantify carbon intensity across US balancing areas.

✅ Hourly traces of imports/exports and generation mix

✅ Consumption-based carbon intensity by balancing area

✅ Policy insights for renewables, coal, health costs


In the United States, electricity generation accounts for nearly 30% of our carbon emissions. Some states have responded to that by setting aggressive renewable energy standards; others are hoping to see coal propped up even as its economics get worse. Complicating matters further is the fact that many regional grids are integrated, and as America goes electric the stakes grow, meaning power generated in one location may be exported and used in a different state entirely.

Tracking these electricity exports is critical for understanding how to lower our national carbon emissions. In addition, power from a dirty source like coal has health and environment impacts where it's produced, and the costs of these aren't always paid by the parties using the electricity. Unfortunately, getting reliable figures on how electricity is produced and where it's used is challenging, even for consumers trying to find where their electricity comes from in the first place, leaving some of the best estimates with a time resolution of only a month.

Now, three Stanford researchers—Jacques A. de Chalendar, John Taggart, and Sally M. Benson—have greatly improved on that standard, and they have managed to track power generation and use on an hourly basis. The researchers found that, of the 66 grid balancing areas within the United States, only three have carbon emissions equivalent to our national average, and they have found that imports and exports of electricity have both seasonal and daily changes. de Chalendar et al. discovered that the net results can be substantial, with imported electricity increasing California's emissions/power by 20%.

Hour by hour
To figure out the US energy trading landscape, the researchers obtained 2016 data for grid features called balancing areas. The continental US has 66 of these, providing much better spatial resolution on the data than the larger grid subdivisions. This doesn't cover everything—several balancing areas in Canada and Mexico are tied in to the US grid—and some of these balancing areas are much larger than others. The PJM grid, serving Pennsylvania, New Jersey, and Maryland, for example, is more than twice as large as Texas' ERCOT, in a state that produces and consumes the most electricity in the US.

Despite these limitations, it's possible to get hourly figures on how much electricity was generated, what was used to produce it, and whether it was used locally or exported to another balancing area. Information on the generating sources allowed the researchers to attach an emissions figure to each unit of electricity produced. Coal, for example, produces double the emissions of natural gas, which in turn produces more than an order of magnitude more carbon dioxide than the manufacturing of solar, wind, or hydro facilities. These figures were turned into what the authors call "embodied emissions" that can be traced to where they're eventually used.

Similar figures were also generated for sulfur dioxide and nitrogen oxides. Released by the burning of fossil fuels, these can both influence the global climate and produce local health problems.

Huge variation
The results were striking. "The consumption-based carbon intensity of electricity varies by almost an order of magnitude across the different regions in the US electricity system," the authors conclude. The low is the Bonneville Power grid region, which is largely supplied by hydropower; it has typical emissions below 100kg of carbon dioxide per megawatt-hour. The highest emissions come in the Ohio Valley Electric region, where emissions clear 900kg/MW-hr. Only three regional grids match the overall grid emissions intensity, although that includes the very large PJM (where capacity auction payouts recently fell), ERCOT, and Southern Co balancing areas.

Most of the low-emissions power that's exported comes from the Pacific Northwest's abundant hydropower, while the Rocky Mountains area exports electricity with the highest associated emissions. That leads to some striking asymmetries. Local generation in the hydro-rich Idaho Power Company has embodied emissions of only 71kg/MW-hr, while its imports, coming primarily from Rocky Mountain states, have a carbon content of 625kg/MW-hr.

The reliance on hydropower also makes the asymmetry seasonal. Local generation is highest in the spring as snow melts, but imports become a larger source outside this time of year. As solar and wind can also have pronounced seasonal shifts, similar changes will likely be seen as these become larger contributors to many of these regional grids. Similar things occur daily, as both demand and solar production (and, to a lesser extent, wind) have distinct daily profiles.

The Golden State
California's CISO provides another instructive case. Imports represent less than 30% of its total electric use in 2016, yet California electricity imports provided 40% of its embodied emissions. Some of these, however, come internally from California, provided by the Los Angeles Department of Water and Power. The state itself, however, has only had limited tracking of imported emissions, lumping many of its sources as "other," and has been exporting its energy policies to Western states in ways that shape regional markets.

Overall, the 2016 inventory provides a narrow picture of the US grid, as plenty of trends are rapidly changing our country's emissions profile, including the rise of renewables and the widespread adoption of efficiency measures and other utility trends in 2017 that continue to evolve. The method developed here can, however, allow for annual updates, providing us with a much better picture of trends. That could be quite valuable to track things like how the rapid rise in solar power is altering the daily production of clean power.

More significantly, it provides a basis for more informed policymaking. States that wish to promote low-emissions power can use the information here to either alter the source of their imports or to encourage the sites where they're produced to adopt more renewable power. And those states that are exporting electricity produced primarily through fossil fuels could ensure that the locations where the power is used pay a price that includes the health costs of its production.


Related News

View more

India Electricity Prices are Spiking

India spot electricity prices surged on Q3 demand, lifting power tariffs in the spot market as discoms scrambled for supply; Sembcorp SGPL boosted PLF and short-term PPA realizations, benefiting from INR per kWh peaks.


Key Points

India spot electricity prices hit Q3 records amid demand spikes, lifting tariffs and aiding Sembcorp SGPL via PLF gains.

✅ Record 10.6 cents/kWh average; 15-minute peak 20.7 cents/kWh

✅ SGPL shifted output to short-term PPA at 7.3 cents/kWh

✅ PLF ramped above 90%, cutting core losses by 30-40%


Electricity prices in India, now the third-largest electricity producer globally, bolted to a record high of 10.6 cents/kWh (INR5.1/kWh) in Q3.

A jolt in Indian spot electricity prices could save Sembcorp Industries' Indian business from further losses, even though demand has occasionally slumped in recent years, UOB Kay Hian said.

The firm said spot electricity prices in India bolted to a record high of 10.6 cents/kWh (INR5.1/kWh) in Q3 and even hit a 15-minute peak of 20.7 cents/kWh (9.9/kWh). The spike was due to a power supply crunch on higher electricity demand from power distribution companies, alongside higher imported coal volumes as domestic supplies shrank.

As an effect, Sembcorp Industries' Sembcorp Gayatri Power Limited's (SGPL) losses of $26m in Q1 and $29m in Q2 could narrow down by as much as 30-40%.

On a net basis, SGPL will recognise a significantly higher electricity tariff in 3Q17. By tactically shutting down its Unit #3 for maintenance, Unit #4 effectively had its generation contracted out at the higher short-term PPA tariff of around 7.3 cents/kWh (Rs3.5/kWh).

SGPL also capitalised on the price spike in 3Q17 as it ramped up its plant load factor (PLF) to more than 90%.

“On the back of this, coupled with the effects of reduced finance costs, we expect SGPL’s 3Q17 quarterly core loss to shrink by 30-40% from previous quarters,” UOB Kay Hian said.

Whilst electricity prices have corrected to 7.1 cents/kWh (INR3.4/kWh), the firm said it could still remain elevated on structural factors, even as coal and electricity shortages ease nationwide.

Sembcorp Industries' India operations brought in a robust performance for Q3. PLF for Thermal Powertech Corporation India Limited (TPCIL) hit 91%, whilst it reached 73% for SGPL, echoing the broader trend of thermal PLF up across the sector.


Related News

View more

Annual U.S. coal-fired electricity generation will increase for the first time since 2014

U.S. coal-fired generation 2021 rose as higher natural gas prices, stable coal costs, and a recovering power sector shifted the generation mix; capacity factors rebounded despite low coal stocks and ongoing plant retirements.


Key Points

Coal output rose 22% on high gas prices and higher capacity factors; a 5% decline is expected in 2022.

✅ Natural gas delivered cost averaged $4.93/MMBtu, more than double 2020

✅ Coal capacity factor rose to ~51% from 40% in 2020

✅ 2022 coal generation forecast to fall about 5%


We expect 22% more U.S. coal-fired generation in 2021 than in 2020, according to our latest Short-Term Energy Outlook (STEO). The U.S. electric power sector has been generating more electricity from coal-fired power plants this year as a result of significantly higher natural gas prices and relatively stable coal prices, even as non-fossil sources reached 40% of total generation. This year, 2021, will yield the first year-over-year increase in coal generation in the United States since 2014, highlighted by a January power generation jump earlier in the year.

Coal and natural gas have been the two largest sources of electricity generation in the United States. In many areas of the country, these two fuels compete to supply electricity based on their relative costs and sensitivity to policies and gas prices as well. U.S. natural gas prices have been more volatile than coal prices, so the cost of natural gas often determines the relative share of generation provided by natural gas and coal.

Because natural gas-fired power plants convert fuel to electricity more efficiently than coal-fired plants, record natural gas generation has at times underscored that advantage, and natural gas-fired generation can have an economic advantage even if natural gas prices are slightly higher than coal prices. Between 2015 and 2020, the cost of natural gas delivered to electric generators remained relatively low and stable. This year, however, natural gas prices have been much higher than in recent years. The year-to-date delivered cost of natural gas to U.S. power plants has averaged $4.93 per million British thermal units (Btu), more than double last year’s price.

The overall decline in electricity demand in 2020 and record-low natural gas prices led coal plants to significantly reduce the percentage of time that they generated power. In 2020, the utilization rate (known as the capacity factor) of U.S. coal-fired generators averaged 40%. Before 2010, coal capacity factors routinely averaged 70% or more. This year’s higher natural gas prices have increased the average coal capacity factor to about 51%, which is almost the 2018 average, a year when wind and solar reached 10% nationally.

Although rising natural gas prices have resulted in more U.S. coal-fired generation than last year, this increase in coal generation will most likely not continue as solar and wind expand in the generation mix. The electric power sector has retired about 30% of its generating capacity at coal plants since 2010, and no new coal-fired capacity has come online in the United States since 2013. In addition, coal stocks at U.S. power plants are relatively low, and production at operating coal mines has not been increasing as rapidly as the recent increase in coal demand. For 2022, we forecast that U.S. coal-fired generation will decline about 5% in response to continuing retirements of generating capacity at coal power plants and slightly lower natural gas prices.


Related News

View more

Canada expected to miss its 2035 clean electricity goals

Canada 2035 Clean Electricity Target faces a 48.4GW shortfall as renewable capacity lags; accelerating wind, solar PV, grid upgrades, and coherent federal-provincial policy is vital to reach zero-emissions power and strengthen transmission and distribution.


Key Points

Canada's plan to supply nearly 100% of electricity from zero-emitting sources by 2035, requiring renewable buildout.

✅ Average adds 2.6GW; shortfall totals 48.4GW by 2035

✅ Expand wind, solar PV, storage, and grid modernization

✅ Align federal-province policy; retire or convert thermal plants


GlobalData’s latest report, ‘Canada Power Market Size and Trends by Installed Capacity, Generation, Transmission, Distribution and Technology, Regulations, Key Players and Forecast, 2022-2035’, discusses the power market structure of Canada and, amid looming power challenges, provides historical and forecast numbers for capacity, generation and consumption up to 2035. Detailed analysis of the country’s power market regulatory structure, competitive landscape and a list of major power plants are provided. The report also gives a snapshot of the power sector in the country on broad parameters of macroeconomics, supply security, generation infrastructure, transmission and distribution infrastructure, electricity import and export scenario, degree of competition, regulatory scenario, and future potential. An analysis of the deals in the country’s power sector is also included in the report.

Canada is expected to fall short of its 2035 clean electricity target after reviewing the country’s current renewable capacity activity. The country has targeted to produce nearly 100% of its electricity from zero-emitting sources by 2035, while electricity associations' net-zero goals extend to 2050; however, the country is adding only 2.6GW of annual renewable capacity additions on average every year, which would mean a cumulative shortfall of 48.4GW.

Canada has good governmental support, but it is not doing enough to ensure its targets are met. If the country is to meet its target to produce nearly 100% of electricity from zero-emitting sources by 2035, the country should both increase the capacity and efficiency of renewable power plants, as well as provide comprehensive end-to-end policies at both the federal and provincial levels, as debates over whether Ontario is embracing clean power continue across provinces. It should also involve communities and businesses in raising awareness of the benefits of adopting renewable energy.

The country has a large amount of proven natural gas and oil reserves that are proving too tempting an opportunity, and the Canadian Government is planning to increase the capacity of its gas-based plants under net-zero regulations permit some gas in the power mix, to secure real-time demand and supply. However, the country’s dependency on gas-based plants creates a major challenge to achieve its 2035 clean electricity target.

If the Canadian Government is to meet its 2035 targets, it should draw on examples from its European counterparts and add renewable capacity at a rapid pace, while balancing demand and emissions in key provinces. One advantage for Canada here is that it does not have land constraints, which is common in other major renewable power-generating countries. This could give the country an estimated 6.1GW of renewable capacity every year on average during the 2021-2035 period: enough capacity to meet its target. Most of these installations are expected to be for wind and solar PV.

Changing provincial governments are not helpful when it comes to implementing long-term projects, especially as Ontario faces looming electricity shortfalls that heighten planning risks, and continued stopping and starting of projects like this will only be damaging to renewable goals. Another way the country can achieve its target is by converting thermal power plants into clean energy plants and providing a roadmap or timeline for provinces to retire thermal power plants completely, even as scrapping coal can be costly for some systems.

Canada’s GDP (at constant prices) increased from $1,617.3bn in 2010 to $1,924.5bn in 2021, at a CAGR of 1.6%. The GDP (at constant prices) of the country declined sharply from $1,943.8bn in 2019 to $1,840.5bn in 2020 because of Covid-19 pandemic. After the recommencement of regular industrial and trade activities, the GDP grew by 4.6% in 2021 from 2020. The GDP is expected to cross pre-pandemic levels by the end of 2022.


Related News

View more

China power cuts: What is causing the country's blackouts?

China Energy Crisis drives electricity shortages, power cuts, and blackouts as coal prices surge, carbon-neutrality rules tighten, and manufacturing hubs ration energy, disrupting supply chains and industrial output ahead of winter demand peaks.


Key Points

A power shortfall from costly coal, price caps, and emissions targets, causing blackouts and industrial rationing.

✅ Coal prices soar while electricity tariffs are capped

✅ Factories in northeast hubs face rationing and downtime

✅ Supply chains risk delays ahead of winter demand


China is struggling with a severe shortage of electricity which has left millions of homes and businesses hit by power cuts.

Blackouts are not that unusual in the country but this year a number of factors have contributed to a perfect storm for electricity suppliers, including surging electricity demand globally.

The problem is particularly serious in China's north eastern industrial hubs as winter approaches - and is something that could have implications for the rest of the world.

Why has China been hit by power shortages?
The country has in the past struggled to balance electricity supplies with demand, which has often left many of China's provinces at risk of power outages.

During times of peak power consumption in the summer and winter the problem becomes particularly acute.

But this year a number of factors have come together to make the issue especially serious.

As the world starts to reopen after the pandemic, demand for Chinese goods is surging and the factories making them need a lot more power, highlighting China's electricity appetite in recent months.

Rules imposed by Beijing as it attempts to make the country carbon neutral by 2060 have seen coal production slow, even as the country still relies on coal for more than half of its power and as low-emissions generation is set to cover most global demand growth.

And as electricity demand has risen, the price of coal has been pushed up.

But with the government strictly controlling electricity prices, coal-fired power plants are unwilling to operate at a loss, with many drastically reducing their output instead.

Who is being affected by the blackouts?
Homes and businesses have been affected by power cuts as electricity has been rationed in several provinces and regions.

A coal-burning power plant can be seen behind a factory in China"s Inner Mongolia Autonomous Region

The state-run Global Times newspaper said there had been outages in four provinces - Guangdong in the south and Heilongjiang, Jilin and Liaoning in the north east. There are also reports of power cuts in other parts of the country.

Companies in major manufacturing areas have been called on to reduce energy usage during periods of peak demand or limit the number of days that they operate.

Energy-intensive industries such as steel-making, aluminium smelting, cement manufacturing and fertiliser production are among the businesses hardest hit by the outages.

What has the impact been on China's economy?
Official figures have shown that in September 2021, Chinese factory activity shrunk to the lowest it had been since February 2020, when power demand dropped as coronavirus lockdowns crippled the economy.

Concerns over the power cuts have contributed to global investment banks cutting their forecasts for the country's economic growth.

Goldman Sachs has estimated that as much as 44% of the country's industrial activity has been affected by power shortages. It now expects the world's second largest economy to expand by 7.8% this year, down from its previous prediction of 8.2%.

Globally, the outages could affect supply chains, including solar supply chains as the end-of-the-year shopping season approaches.

Since economies have reopened, retailers around the world have already been facing widespread disruption amid a surge in demand for imports.

China's economic planner, the National Development and Reform Commission (NDRC), has outlined a number of measures to resolve the problem, with energy supplies in the northeast of the country as its main priority this winter.

The measures include working closely with generating firms to increase output, ensuring full supplies of coal and promoting the rationing of electricity.

The China Electricity Council, which represents generating firms, has also said that coal-fired power companies were now "expanding their procurement channels at any cost" in order to guarantee winter heat and electricity supplies.

However, finding new sources of coal imports may not be straightforward.

Russia is already focused on its customers in Europe, Indonesian output has been hit by heavy rains and nearby Mongolia is facing a shortage of road haulage capacity,

Are energy shortages around the world connected?
Power cuts in China, UK petrol stations running out of fuel, energy bills jumping in Europe, near-blackouts in Japan and soaring crude oil, natural gas and coal prices on wholesale markets - it would be tempting to assume the world is suddenly in the grip of a global energy drought.

However, it is not quite as simple as that - there are some distinctly different issues around the world.

For example, in the UK petrol stations have run dry as motorists rushed to fill up their vehicles over concerns that a shortage of tanker drivers would mean fuel would soon become scarce.

Meanwhile, mainland Europe's rising energy bills and record electricity prices are due to a number of local factors, including low stockpiles of natural gas, weak output from the region's windmills and solar farms and maintenance work that has put generating operations out of action.


Related News

View more

Seven small UK energy suppliers must pay renewables fees or risk losing licence

Ofgem Renewables Obligations drive supplier payments for renewables fees, feed-in tariffs, and renewable generation, with non-payment risking supply licences amid the price cap and volatile wholesale prices across the UK energy market.


Key Points

Mandatory payments by suppliers funding renewables via feed-in tariffs; non-payment can trigger supply licence revoking.

✅ Covers Renewables Obligation and Feed-in Tariff scheme compliance.

✅ Non-payment can lead to Ofgem action and licence loss.

✅ Affected by price cap and wholesale price volatility.


Seven small British energy suppliers owe a total of 34 million pounds ($43.74 million) in renewables fees, amid a renewables backlog that has stalled projects, and could face losing their supply licences if they cannot pay, energy regulator Ofgem reports.

Under Britain’s energy market rules, suppliers of energy must meet so-called renewables obligations and feed-in tariffs, including households' ability to sell solar power back to energy firms, which are imposed on them by the government to help fund renewable power generation.

Several small energy companies have gone bust over the past two years, a trend echoed by findings from a global utility study on renewable priorities, as they struggled to pay the renewables fees and as their profits were affected by a price cap on the most commonly used tariffs and fluctuating wholesale prices, even as a 10 GW contract brings new renewable capacity onto the UK grid.

Ofgem has called on the companies to make necessary payments by Oct. 31, as moves to offer community-generated power to all UK customers progress.

“If they do not pay Ofgem could start the process of revoking their licences to supply energy,” it said in a statement, as offshore wind power continues to scale nationwide.

The seven suppliers are, amid debates over clean energy impacts, Co-Operative Energy Limited; Flow Energy Limited; MA Energy Limited; Nabuh Energy Limited; Robin Hood Energy Limited; Symbio Energy Limited and Tonik Energy Limited. ($1 = 0.7773 pounds)


Related News

View more

Sign Up for Electricity Forum’s Newsletter

Stay informed with our FREE Newsletter — get the latest news, breakthrough technologies, and expert insights, delivered straight to your inbox.

Electricity Today T&D Magazine Subscribe for FREE

Stay informed with the latest T&D policies and technologies.
  • Timely insights from industry experts
  • Practical solutions T&D engineers
  • Free access to every issue

Download the 2025 Electrical Training Catalog

Explore 50+ live, expert-led electrical training courses –

  • Interactive
  • Flexible
  • CEU-cerified