Hydro-Quebec gets candid about outage management

By Hydro-Quebec


Substation Relay Protection Training

Our customized live online or in‑person group training can be delivered to your staff at your location.

  • Live Online
  • 12 hours Instructor-led
  • Group Training Available
Regular Price:
$699
Coupon Price:
$599
Reserve Your Seat Today
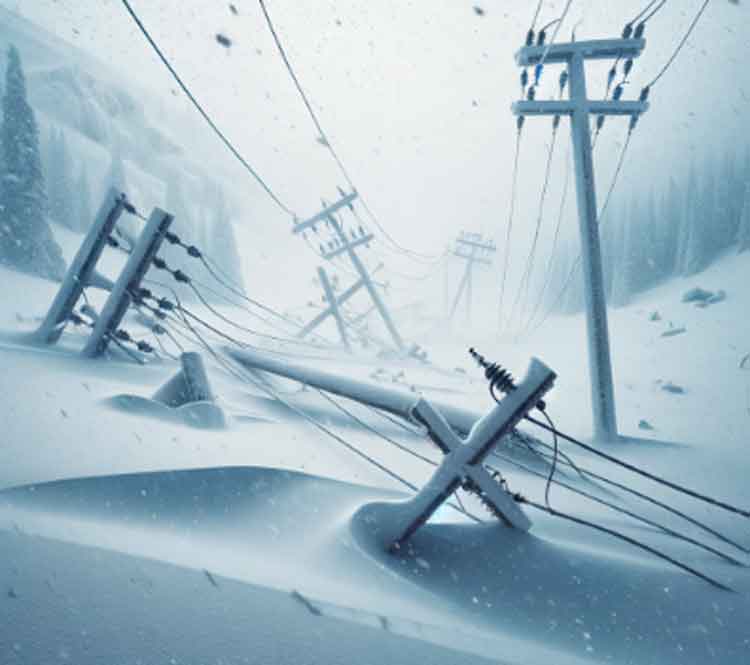
Between January 5 and 10, 1998, Québec experienced exceptionally harsh weather conditions as three successive storms left up to 110 mm of ice over the south of the province. Though robust and well-maintained, the Hydro-Québec grid suffered unprecedented damage.

In the days and weeks that followed, thousands of Hydro-Québec workers, with substantial support from colleagues from Québec companies and neighboring electrical utilities, worked relentlessly to restore power in the regions hardest hit.

By late January, most customers again had power. However, the efforts to ensure a secure power supply did not end there.

Major investments have made the Hydro-Québec grid of today much more robust and better able to withstand the impacts of extreme weather events like the ice storm. As a result, Hydro-Québec is now able to restore service to its customers more quickly.

Q: What has been done since 1998 to minimize the effect of similar weather events in the future?

A: Like other regions of the world, Québec is not immune to extreme meteorologic conditions. We cannot control Nature but we can control how we act and minimize the impacts of such events. We have invested on a number of fronts to reinforce our power network and improve its performance under harsh climatic conditions.

Thousands of poles, towers and kilometers of lines fell in 1998, often through a domino effect, sometimes increasing by 80 the time it took to restore service to our customers.

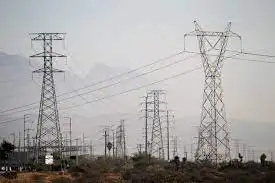
Now, our new construction standards limit the potential for that effect. The mechanical strength of our grid has been increased. For instance, by making every tenth tower along a transmission line a very robust anti-cascading tower, we limit the damage that results from the collapse of a single tower.

On the distribution system, we have strengthened poles and their anchoring. We thus ensure that the poles remain intact despite high wind and ice loading. Only the conductors fall, not the poles. Such measures make it possible to restore service more quickly.

Since 1998, all new lines have been built to these tougher engineering standards.

Hydro-Québec has also changed the configuration of its transmission system to make energy sources more secure and to include redundant sources of supply in case of line failures. These “loops” permit the delivery energy over different paths.

Furthermore, if a satellite substation on the transmission grid is lost, certain distribution lines can provide backup from another substation in order to supply customers.

Q: How does maintenance work help make the grid more robust?

A: A good example is our effort in the area of vegetation control near transmission and distribution lines, a job that plays a huge role in protecting our power system from the impact of weather events like the ice storm.

Many power failures are caused by contact between branches and power lines. The farther vegetation can be kept away, the better the grid will withstand storms.

Q: If the 1998 storm happened now, how would the power system respond?

A: Restoration times would be much shorter. This is because efforts to reinforce the grid, such as creating loops, strengthening facilities and pruning trees, would reduce the number of customers affected and the extent of damage. Repair efforts would thus be more localized and take less time.

Related News

Duke Energy Florida's smart-thinking grid improves response, power restoration for customers during Hurricane Ian

Self-healing grid technology automatically reroutes power to reduce outages, speed restoration, and boost reliability during storms like Hurricane Ian in Florida, leveraging smart grid sensors, automation, and grid hardening to support Duke Energy customers.


Key Points

Automated smart grid systems that detect faults and reroute power to minimize outages and accelerate restoration.

✅ Cuts outage duration via automated fault isolation

✅ Reroutes electricity with sensors and distribution automation

✅ Supports storm resilience and faster field crew restoration


As Hurricane Ian made its way across Florida, where restoring power in Florida can take weeks in hard-hit areas, Duke Energy's grid improvements were already on the job helping to combat power outages from the storm.

Smart, self-healing technology, similar to smart grid improvements elsewhere, helped to automatically restore more than 160,000 customer outages and saved nearly 3.3 million hours (nearly 200 million minutes) of total lost outage time.

"Hurricane Ian is a strong reminder of the importance of grid hardening and storm preparedness to help keep the lights on for our customers," said Melissa Seixas, Duke Energy Florida state president. "Self-healing technology is just one of many grid improvements that Duke Energy is making to avoid outages, restore service faster and increase reliability for our customers."

Much like the GPS in your car can identify an accident ahead and reroute you around the incident to keep you on your way, self-healing technology is like a GPS for the grid. The technology can quickly identify power outages and alternate energy pathways to restore service faster for customers when an outage occurs.

Additionally, self-healing technology provides a smart tool to assist crews in the field with power restoration after a major storm like Ian, helping reduce outage impacts and freeing up resources to help restore power in other locations.

Three days after Hurricane Ian exited the state, Duke Energy Florida wrapped up restoration of approximately 1 million customers. This progress enabled the company to deploy more than 550 Duke Energy workers from throughout Florida, as well as contractors from across the country, to help restore power for Lee County Electric Cooperative customers.

Crews worked in Cape Coral and Pine Island, one of the hardest-hit areas in the storm's path, as Canadian power crews have in past storms, and completed power restoration for the majority of customers on Pine Island within approximately one week after arriving to the island.

Prior to Ian in 2022, smart, self-healing technology had helped avoid nearly 250,000 extended customer outages in Florida, similar to Hydro One storm recovery efforts, saving around 285,000 hours (17.1 million minutes) of total lost outage time.

Duke Energy currently serves around 59% of customers in Florida with self-healing capabilities on its main power distribution lines, with a goal of serving around 80% over the next few years.


Related News

View more

840 million people have no electricity – World Bank must fund more energy projects

World Bank Energy Policy debates financing for coal, oil, gas, and renewables to fight energy poverty, expand grid reliability, ensure baseload power, and balance climate goals with development finance for affordable, reliable electricity access.


Key Points

It outlines the bank's stance on financing fossil fuels and renewables to expand affordable, reliable electricity.

✅ Focus on energy access, baseload reliability, and poverty alleviation

✅ Debate over coal, gas, and renewables in development finance

✅ Geopolitics: China and Russia fill funding gaps, raising risks


Why isn’t the World Bank using all available energy resources in its global efforts to fight poverty? That’s the question I’ve asked World Bank President David Malpass. Nearly two years ago, the multilateral development bank decided to stop supporting critical coal, oil and gas projects that help people in developing countries escape poverty.

Along with 11 other senators, and as a member who votes on whether to give U.S. taxpayer dollars to the World Bank, I am pressing the bank to lift these restrictions. Developing countries desperately need access to a steady supply of affordable, reliable clean electricity to support economic growth.

The World Bank has pulled funding for critical electricity projects in poor countries, including high-efficiency power stations that are fueled by coal, even as efforts to revitalize coal communities with clean energy have grown.

Despite Kosovo having the world’s fifth-largest reserves of coal, the bank announced it would only support new energy projects from renewable sources going forward. Kosovo’s Minister of Economic Development Valdrin Lluka responded: “We don’t have the luxury to do such experiments in a poor country such as Kosovo. … It is in our national security interest to secure base energy inside our country.”

The World Bank’s misguided move comes as 840 million people worldwide are living without electricity, including 70 percent of sub-Saharan Africa, and as the fall in global energy investment may lead to shortages.

Even more troubling, nearly 3 billion people in developing countries rely on fuels like wood and other biomass for cooking and home heating, resulting in serious health problems and premature deaths, and the pandemic saw widespread electricity shut-offs that deepened energy insecurity. In 2016, household smoke killed an estimated 2.6 million people.

The World Bank’s mission is to lift people out of poverty. The bank is now compromising that mission in favor of a political agenda targeting certain energy sources.

With the World Bank blocking financing to affordable and reliable energy projects, Russia and China are stepping up their investments in order to gain geopolitical leverage.

President Vladimir Putin is pursuing Russian oil and gas projects in Mozambique, Gabon, and Angola. China’s Belt and Road Initiative is supporting traditional energy resources, with 36 percent of its power projects from 2014 to 2017 involving coal. South Africa had to turn to the China Development Bank to fund its $1.5 billion coal-fired power plant.

There are real risks for countries partnering with China and Russia on these projects. Developing countries are facing what some are calling China’s “debt trap” diplomacy. These nations have also raised concerns over safety compliance, unfair business practices, and labor standards.

As the bank’s largest contributor, the United States has a duty to make sure U.S. taxpayer dollars are used wisely and effectively. Every U.S. dollar at the World Bank should make a difference for people in the developing world.

My colleagues and I have asked the bank to pursue an all-of-the-above energy strategy as it strives to achieve its mission to end extreme poverty and promote shared prosperity. We will take the bank’s response into account during the congressional appropriations process.

The United States is a top global energy producer. And yet Democrats running for president are pursuing anti-energy policies that would hurt not only the United States but the entire world, with implications for U.S. national security as well.

Utilizing our abundant energy resources has fueled an American energy renaissance and a booming U.S. economy, even as disruptions in coal and nuclear have strained the grid, with millions of new jobs and higher wages.

People who are struggling to survive and thrive in developing countries deserve the same opportunity to access affordable and reliable sources of power.

As Microsoft founder and global philanthropist Bill Gates has noted of renewables: "Many people experiencing energy poverty live in areas without access to the kind of grids that are needed to make those technologies cheap and reliable enough to replace fossil fuels."

Ultimately, there is a role for all sources of energy to help countries alleviate poverty and improve the education, health and wellbeing of their people.

The solution to ending energy poverty does not lie in limiting options, but in using all available options. The World Bank must recommit to ending extreme poverty by helping countries use all of the world’s abundant energy resources. Let’s end energy poverty now.


Related News

View more

The Netherlands Outpaces Canada in Solar Power Generation

Netherlands vs Canada Solar Power compares per capita capacity, renewable energy policies, photovoltaics adoption, rooftop installations, grid integration, and incentives like feed-in tariffs and BIPV, highlighting efficiency, costs, and public engagement.


Key Points

Concise comparison of per capita capacity, policies, technology, and engagement in Dutch and Canadian solar adoption.

✅ Dutch per capita PV capacity exceeds Canada's by wide margin.

✅ Strong incentives: net metering, feed-in tariffs, rooftop focus.

✅ Climate, grid density, and awareness drive higher yields.


When it comes to harnessing solar power, the Netherlands stands as a shining example of efficient and widespread adoption, far surpassing Canada in solar energy generation per capita. Despite Canada's vast landmass and abundance of sunlight, the Netherlands has managed to outpace its North American counterpart, which some experts call a solar power laggard in solar energy production. This article explores the factors behind the Netherlands' success in solar power generation and compares it to Canada's approach.

Solar Power Capacity and Policy Support

The Netherlands has rapidly expanded its solar power capacity in recent years, driven by a combination of favorable policies, technological advancements, and public support. According to recent data, the Netherlands boasts a significantly higher per capita solar power capacity compared to Canada, where demand for solar electricity lags relative to deployment in many regions, leveraging its smaller geographical size and dense population centers to maximize solar panel installations on rooftops and in urban areas.

In contrast, Canada's solar energy development has been slower, despite having vast areas of suitable land for solar farms. Challenges such as regulatory hurdles, varying provincial policies, and the high initial costs of solar installations have contributed to a more gradual adoption of solar power across the country. However, provinces like Ontario have seen significant growth in solar installations due to supportive government incentives and favorable feed-in tariff programs, though growth projections were scaled back after Ontario scrapped a key program.

Innovation and Technological Advancements

The Netherlands has also benefited from ongoing innovations in solar technology and efficiency improvements. Dutch companies and research institutions have been at the forefront of developing new solar panel technologies, improving efficiency rates, and exploring innovative applications such as building-integrated photovoltaics (BIPV). These advancements have helped drive down the cost of solar energy and increase its competitiveness with traditional fossil fuels.

In contrast, while Canada has made strides in solar technology research and development, commercialization and widespread adoption have been more restrained due to factors like market fragmentation and the country's reliance on other energy sources such as hydroelectricity.

Public Awareness and Community Engagement

Public awareness and community engagement play a crucial role in the Netherlands' success in solar power adoption. The Dutch government has actively promoted renewable energy through public campaigns, educational programs, and financial incentives for homeowners and businesses to install solar panels. This proactive approach has fostered a culture of energy conservation and sustainability among the Dutch population.

In Canada, while there is growing public support for renewable energy, varying levels of awareness and engagement across different provinces have impacted the pace of solar energy adoption. Provinces like British Columbia and Alberta have seen increasing interest in solar power, driven by environmental concerns, technological advancements, and economic benefits, as the country is set to hit 5 GW of installed capacity in the near term.

Climate and Geographic Considerations

Climate and geographic considerations also influence the disparity in solar power generation between the Netherlands and Canada. The Netherlands, despite its northern latitude, benefits from relatively mild winters and a higher average annual sunlight exposure compared to most regions of Canada. This favorable climate has facilitated higher solar energy yields and made solar power a more viable option for electricity generation.

In contrast, Canada's diverse climate and geography present unique challenges for solar energy deployment. Northern regions experience extended periods of darkness during winter months, limiting the effectiveness of solar panels in those areas. Despite these challenges, advancements in energy storage technologies and hybrid solar-diesel systems are making solar power increasingly feasible in remote and off-grid communities across Canada, even as Alberta faces expansion challenges related to grid integration and policy.

Future Prospects and Challenges

Looking ahead, both the Netherlands and Canada face opportunities and challenges in expanding their respective solar power capacities. In the Netherlands, continued investments in solar technology, grid infrastructure upgrades, and policy support will be crucial for maintaining momentum in renewable energy development.

In Canada, enhancing regulatory consistency, scaling up solar installations in urban and rural areas, and leveraging emerging technologies will be essential for narrowing the gap with global leaders in solar energy generation and for seizing opportunities in the global electricity market as the energy transition accelerates.

In conclusion, while the Netherlands currently generates more solar power per capita than Canada, with the Prairie Provinces poised to lead growth in the Canadian market, both countries have unique strengths and challenges in their pursuit of a sustainable energy future. By learning from each other's successes and leveraging technological advancements, both nations can further accelerate the adoption of solar power and contribute to global efforts to combat climate change.


Related News

View more

Pacific Northwest's Renewable Energy Goals Hindered

Pacific Northwest Transmission Bottleneck slows clean energy progress as BPA's aging grid constrains renewable interconnections, delaying wind, solar, and data center growth; decarbonization targets depend on transmission upgrades, new substations, and policy reform.


Key Points

An interconnection and capacity shortfall on BPA's aging grid that delays renewables and impedes clean energy goals.

✅ BPA approvals lag: 1 of 469 projects since 2015.

✅ Yakama solar waits for substation upgrades until 2027.

✅ Data centers and decarbonization targets face grid constraints.


Oregon and Washington have set ambitious targets to decarbonize their power sectors, aiming for 100% clean electricity in the coming decades. However, a significant obstacle stands in the way: the region's aging and overburdened transmission grid, underscoring why 100% renewables remain elusive even as momentum builds.

The Grid Bottleneck

The BPA operates a transmission system that is nearly a century old in some areas, and its capacity has not expanded sufficiently to accommodate the influx of renewable energy projects, reflecting stalled grid spending in many parts of the U.S., according to recent analyses. Since 2015, 469 large renewable projects have applied to connect to the BPA's grid; however, only one has been approved—a stark contrast to other regions in the country. This bottleneck has left numerous wind and solar projects in limbo, unable to deliver power to the grid.

One notable example is the Yakama Nation's solar project. Despite receiving a $32 million federal grant under the bipartisan infrastructure law as part of a broader grid overhaul for renewables, the tribe faces significant delays. The BPA estimates that it will take until 2027 to complete the necessary upgrades to the transmission system, including a new substation, before the solar array can be connected. This timeline poses a risk of losing federal funding if the project isn't operational by 2031.

Economic and Environmental Implications

The slow pace of grid expansion has broader implications for the region's economy and environmental goals. Data centers and other energy-intensive industries are increasingly drawn to the Pacific Northwest due to its clean energy potential, while interregional projects like the Wyoming-to-California wind link illustrate how transmission access can unlock supply. However, without adequate infrastructure, these industries may seek alternatives elsewhere. Additionally, the inability to integrate renewable energy efficiently hampers efforts to reduce greenhouse gas emissions and combat climate change.

Policy Challenges and Legislative Efforts

Efforts to address the grid limitations through state-level initiatives have faced challenges, even as a federal rule to boost transmission advances nationally. In 2025, both Oregon and Washington considered legislation to establish state bonding authorities aimed at financing transmission upgrades. However, these bills failed to pass, leaving the BPA as the primary entity responsible for grid expansion. The BPA's unique structure—operating as a self-funded federal agency without direct state oversight—has made it difficult for regional leaders to influence its decision-making processes.

Looking Ahead

The Pacific Northwest's renewable energy aspirations hinge on modernizing its transmission infrastructure, aligning with decarbonization strategies that emphasize grid buildout. While the BPA has proposed several projects to enhance grid capacity, the timeline for completion remains uncertain. Without significant investment and policy reforms, the region risks falling behind in the transition to a clean energy future. Stakeholders across Oregon and Washington must collaborate to advocate for necessary changes and ensure that the grid can support the growing demand for renewable energy.

The Pacific Northwest's commitment to clean energy is commendable, but achieving these goals requires overcoming substantial infrastructure challenges, and neighboring jurisdictions such as British Columbia have pursued B.C. regulatory streamlining to accelerate projects. Addressing the limitations of the BPA's transmission system is critical to unlocking the full potential of renewable energy in the region. Only through concerted efforts at the federal, state, and local levels can Oregon and Washington hope to realize their green energy ambitions.


Related News

View more

U.S. Residents Averaged Fewer Power Outages in 2022

2022 U.S. Power Outage Statistics show lower SAIDI as fewer major events hit, with SAIFI trends, electric reliability, outage duration and frequency shaped by hurricanes, winter storms, vegetation, and utility practices across states.


Key Points

They report SAIDI and SAIFI for 2022, showing outage duration, frequency, and impacts of major weather events.

✅ 2022 SAIDI averaged 5.6 hours; SAIFI averaged 1.4 interruptions.

✅ Fewer major events lowered outage duration versus 2021.

✅ Hurricanes and winter storms drove long outages in several states.


In 2022, U.S. electricity consumers on average experienced about 5.5 hours of power disruptions, a decrease from nearly two hours compared to 2021. This information comes from the latest Annual Electric Power Industry Report. The reduction in yearly power interruptions primarily resulted from fewer significant events in 2022 compared to the previous year, and utility disaster planning continues to support grid resilience as severe weather persists.

Since 2013, excluding major events, the annual average duration of power interruptions has consistently hovered around two hours. Factors contributing to major power disruptions include weather-related incidents, vegetation interference near power lines, and specific utility practices, while pandemic-related grid operations influenced workforce planning more than outage frequency. To assess the reliability of U.S. electric utilities, two key indexes are utilized:

  • The System Average Interruption Duration Index (SAIDI) calculates the total length (in hours) an average customer endures non-brief power interruptions over a year.
  • The System Average Interruption Frequency Index (SAIFI) tracks the number of times interruptions occur.

The influence of major events on electrical reliability is gauged by comparing affected states' SAIDI and SAIFI values against the U.S. average, which was 5.6 hours of outages and 1.4 outages per customer in 2022. The year witnessed 18 weather-related disasters in the U.S., each resulting in over $1 billion in damages, and COVID-19 grid assessments indicated the electricity system was largely safe from pandemic impacts. Noteworthy major events include:

  • Hurricane Ian in September 2022, leaving over 2.6 million Floridian customers without electricity, with restoration in some areas taking weeks rather than days.
  • Hurricane Nicole in November 2022, causing over 300,000 Florida customers to lose power.
  • Winter Storm Elliott in December 2022, affecting over 1.5 million customers in multiple states including Texas where utilities struggled after Hurricane Harvey to restore service, and Florida, and bringing up to four feet of snow in parts of New York.

In 2022, states like Florida, West Virginia, Maine, Vermont, and New Hampshire experienced the most prolonged power interruptions, with New Hampshire averaging 10.3 hours and Florida 19.1 hours, and FPL's Irma storm response illustrates how restoration can take days or weeks in severe cases. Conversely, the District of Columbia, Delaware, Rhode Island, Nebraska, and Iowa had the shortest total interruptions, with the District of Columbia averaging just 34 minutes and Iowa 85 minutes.

The frequency of outages, unlike their duration, is more often linked to non-major events. Across the nation, Alaska recorded the highest number of power disruptions per customer (averaging 3.5), followed by several heavily forested states like Tennessee and Maine. Power outages due to falling tree branches are common, particularly during winter storms that burden tree limbs and power lines, as seen in a North Seattle outage affecting 13,000 customers. The District of Columbia stood out with the shortest and fewest outages per customer.


Related News

View more

Electricity prices rise more than double EU average in first half of 2021

Estonia energy prices 2021 show sharp electricity hikes versus the EU average, mixed natural gas trends, kWh tariffs on Nord Pool spiking, and VAT, taxes, and support measures shaping household bills.


Key Points

EU-high electricity growth, early gas dip, then Nord Pool spikes; taxes, VAT, and subsidies shaped energy bills.

✅ Electricity up 7% on year; EU average 2.8% in H1 2021.

✅ Gas fell 1% in H1; later spiked with global market.

✅ VAT, taxes, excise and aid impacted household costs.


Estonia saw one of the highest rates in growth of electricity prices in the first half of 2021, compared with the same period in key trends in 2020 across Europe. These figures were posted before the more recent, record level of electricity and natural gas prices; the latter actually dropped slightly in Estonia in the first half of the year.

While electricity prices rose 7 percent on year in the first half of 2021 in Estonia, the average for the EU as a whole, where energy prices drove inflation across the bloc, stood at 2.8 percent over the same period, BNS reports.

Hungary (€10 per 100 Kwh) and Bulgaria (€10.20 per 100 Kwh) saw the lowest electricity prices EU-wide, while at €31.9 per KWH, Germany's power prices posted the most expensive rate, while Denmark, Belgium and Ireland also had high prices, in excess of €25 per Kwh.

Slovenia saw the highest electricity price rise, at 15 percent, and even the United States' electricity prices saw their steepest rise in decades during the same era, while Estonia was in third place, joint with Romania at 7 percent as noted, and behind Poland (8 percent).

Lithuania, on the other hand, experienced the third highest electricity price fall over the first half of 2021, compared with the same period in 2020, at 6 percent, behind only Cyprus (7 percent) and the Netherlands (10 percent, largely due to a tax cut).

Urmas Reinsalu: VAT on electricity, gas and heating needs to be lowered
The EU average price of electricity was €21.9 percent per Kwh, with taxes and excise accounting for 39 percent of this, even as prices in Spain surged across the day-ahead market.

Estonia has also seen severe electricity price rises in the second half of the year so far, with records set and then promptly broken several times earlier in October, while an Irish electricity provider raised prices amid similar pressures, and a support package for low income households rolled out for the winter season (October to March next year). The price on the Nord Pool market as of €95.01 per Kwh; a day earlier it had stood at €66.21 per Kwh, while on October 19 the price was €140.68 per Kwh.

Gas prices
Natural gas prices to household, meanwhile, dropped in Estonia over the same period, at a sharper rate (1 percent) than the EU average (0.5 percent), according to Eurostat.

Gas prices across the EU were lowest in Lithuania (€2.8 per 100 Kwh) and highest in the Netherlands (€9.6 per KWH), while the highest growth was seen in Denmark (19 percent), in the first half of 2021.

Natural gas prices dropped in 20 member states, however, with the largest drop again coming in Lithuania (23 percent).

The average price of natural gas EU-side in the first half of 2021 was €6.4, and taxes and excise duties accounted on average for 36 percent of the total.

The second half of the year has seen steep gas price rises in Estonia, largely the result of increases on the world market, though European gas benchmarks later fell to pre-Ukraine war levels.


Related News

View more

Sign Up for Electricity Forum’s Newsletter

Stay informed with our FREE Newsletter — get the latest news, breakthrough technologies, and expert insights, delivered straight to your inbox.

Electricity Today T&D Magazine Subscribe for FREE

Stay informed with the latest T&D policies and technologies.
  • Timely insights from industry experts
  • Practical solutions T&D engineers
  • Free access to every issue

Live Online & In-person Group Training

Advantages To Instructor-Led Training – Instructor-Led Course, Customized Training, Multiple Locations, Economical, CEU Credits, Course Discounts.

Request For Quotation

Whether you would prefer Live Online or In-Person instruction, our electrical training courses can be tailored to meet your company's specific requirements and delivered to your employees in one location or at various locations.