SCE operating normally following quake

By Business Wire


CSA Z463 Electrical Maintenance

Our customized live online or in‑person group training can be delivered to your staff at your location.

  • Live Online
  • 6 hours Instructor-led
  • Group Training Available
Regular Price:
$249
Coupon Price:
$199
Reserve Your Seat Today
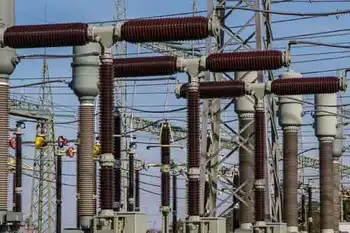
Southern California EdisonÂ’s (SCEÂ’s) transmission and generation systems were operating normally after a 5.4 magnitude earthquake struck near Chino Hills on July 29, but some customers near the epicenter lost power.

As of 2 p.m. PDT, about 100 customers were without service. Initially, an estimated 5,000 customers were without service in the areas of Chino Hills, Chino, La Habra, Diamond Bar and Pomona.

A fire was reported at SCEÂ’s substation in La Habra, but no major damage was reported.

The earthquake was felt at the San Onofre Nuclear Generating Station site. There were no safety issues reported and no indications of any damage. The plant continues to operate normally.

SCE reminds its customers of the following electrical safety tips as a result of the earthquake:

• Never touch or try to move a downed power line because of the danger of electrocution. Call SCE at (800) 611-1911 and your local police and fire officials for assistance.

• Watch for traffic signals that may be out. Approach uncontrolled intersections as four-way stops.

• Make sure you have a battery-operated radio and flashlights.

• Do not rely on candles for lighting during a power outage because they pose a significant fire hazard.

• Turn off and unplug any unnecessary electrical equipment, especially sensitive electronic equipment.

• Do not use equipment designed for outdoor cooking indoors. Such equipment can emit carbon monoxide and other toxic gases.

• If you use a generator, place it outdoors and plug individual appliances directly into the generator, using a heavy-duty extension cord. Connecting generators directly to household circuits creates “backfeed,” which is dangerous to repair crews.

• During an outage, turn off unattended electrical appliances and devices to avoid possible hazards when service is restored.

Related News

Energy freedom and solar’s strategy for the South

South Carolina Energy Freedom Act lifts net metering caps, reforms PURPA, and overhauls utility planning to boost solar competition, grid resiliency, and consumer choice across the Southeast amid Santee Cooper debt and utility monopoly pressure.


Key Points

A bipartisan reform lifting net metering caps, modernizing PURPA, and updating utility planning to expand solar.

✅ Lifts net metering cap to accelerate rooftop and community solar.

✅ Reforms PURPA contracts to enable fair pricing and transparent procurement.

✅ Modernizes utility IRP and opens markets to competition and customer choice.


The South Carolina House has approved the latest version of the Energy Freedom Act, a bill that overhauls the state’s electricity policies, including lifting the net metering caps and reforming PURPA implementation and utility planning processes in a way that advocates say levels the playing field for solar at all scales.

With Governor Henry McMaster (R) expected to sign the bill shortly, this is a major coup not just for solar in the state, but the region. This is particularly notable given the struggle that solar has had just to gain footing in many parts of the South, which is dominated by powerful utility monopolies and conservative politicians.

Two days ago when the bill passed the Senate we covered the details of the policy, but today we’re going to take a look at the politics of getting the Energy Freedom Act passed, and what this means for other Southern states and “red” states.


Opportunity amid crisis

The first thing to note about this bill is that it comes within a crisis in South Carolina’s electricity sector. This was the first legislative session following state-run utility Santee Cooper’s formal abandonment of a project to build two new reactors at the Virgil C. Sumner nuclear power plant, on which work stopped nearly two years ago.

Santee Cooper still holds $4 billion in construction debt related to the nuclear projects. According to an article in The State, this is costing its customers $5 per month toward the current debt, and this will rise to $13 per month for the next 40 years.

Such costs are particularly unwelcome in South Carolina, which has the highest annual electricity bills in the nation due to a combination of very high electricity usage driven by widespread air conditioning during the hot summers and higher prices per unit of power than other Southern states.

Following this fiasco, Santee Cooper’s CEO has stepped down, and the state government is currently considering selling the utility to a private entity. According to Maggie Clark, southeast state affairs senior manager for Solar Energy Industries Association, all of this set the stage for the bill that passed today.

“South Carolina is in a really ripe state for transformational energy policy in the wake of the VC Sumner nuclear plant cancellation,” Clark told pv magazine. “They were looking for a way forward, and I think this bill really provided them something to champion.”


Renewable energy policy for red states

This major win for solar policy comes in a state where the Republican Party holds majorities in both houses of the state’s legislature and sends bills to a Republican governor.

Broadly speaking, Republican politicians seldom show the level of interest in supporting renewable energy that Democrats do either at the state or national level, and show even less inclination to act to address greenhouse gas emissions. In fact, the 100% clean energy mandates that are being implemented in four states and Washington D.C. have only passed with Democratic trifectas, in other words with Republicans controlling neither house of the state legislature nor the governor’s office. (Note: This does not apply to Puerto Rico, which has a different party structure to the rest of the United States)

However, South Carolina shows there are Republican politicians who will support pro-renewable energy policies, and circumstances under which Republican majorities will vote for legislation that aids the adoption of solar. And these specific circumstances speak to both different priorities and ideological differences between the two parties.

SEIA’s Maggie Clark emphasizes that the Energy Freedom Act was about reforming market rules. “This was a way to provide a program that did not provide subsidies or incentives in any way, but to really open the market to competition,” explains Clark. “I think that appealing to conservatives in the South about energy independence and resiliency and ultimately cost savings is the winning message on this issue.”

Such messaging in South Carolina is not an accident. Not only has such messaging been successful in the past, but coalition partner Vote Solar paid for polling to find what messages resounded with the state’s voters, and found that choice and competition were likely to resound.

And all of this happened in the context of what Clark describes as an “extremely well-resourced effort”, with SEIA in particular dedicating national attention and resources to the state – as part of an effort by President and CEO Abigail Hopper to shift attention more towards state-level policy. Maggie Clark is one of two new regional staff who Hopper has hired, and SEIA’s first staff member focused on Southern states.

“Absolutely the South is a prioritized region,” Hopper told pv magazine, noting that three Southern states – the Carolinas and Florida – are among the 12 states that the organization has identified to work on this year. “It became clear that as a region it needed more attention.”

SEIA is not expecting fly-by-night victories, and Hopper attributes the success in South Carolina not only to a broad coalition, but to years of work on the ground in the state.

Nor is SEIA the only organization to grow its presence in the region. Vote Solar now has two full time staff located in the South, whereas two years ago its sole staff member dedicated to the region was located in Washington D.C.


Ideology versus reality in the South

The Energy Freedom Act aligns with conservative ideas about small government and competition, but the American right is not monolithic, nor do political ideas and actions always line up neatly, as other successful policies in other states in the region show

By far the largest deployment of renewable energy in the nation has been in Texas, aside from in California which leads overall. Here a system of renewable energy zones in the sparsely populated but windy and sunny west, north and center of the state feed cities to the east with power from wind and more recently solar.

This was enabled by transmission lines whose cost was socialized among the state’s ratepayers – a tremendous irony given that the state’s politicians would be some of the last in the nation to want to be identified with socializing anything.

Another example is Louisiana, which saw a healthy residential solar market over the last decade due to a 50% state rebate. The policy has expired, but when operating it was exactly the sort of outright subsidy that right-wing media and politicians rail against.

Of course there is also North Carolina, which built the 2nd-largest solar market in the nation on the back of successful state-level implementation of PURPA, a federal law. Finally there is Virginia, where large-scale projects are booming following a 2018 law that found that 5 GW of solar is in the public interest.

Furthermore, while conservatives continually expound the virtues of the free market, the reality of the electricity sector in the “deep red” South is anything but that. The region missed out on the wave of deregulation in the 1990s, and remains dominated by monopoly utilities regulated by the state: a union of big business and big government where competition is non-existent.

This has also meant that the solar which has been deployed in the South is mostly not the kind of rooftop solar that many think of as embodying energy independence, but rather large-scale solar built in farms, fields and forests.


Where to from here?

With such contradictions between stated ideology and practice, it is less clear what makes for successful renewable energy policy in the South. However, opening up markets appears to be working not only in South Carolina, but also in Florida, where third-party solar companies are making inroads after the state’s voters rejected a well-funded and duplicitous utilities’ campaign to kill distributed solar.

SEIA’s Hopper says that she is “aggressively optimistic” about solar in Florida. As utilities have dominated large-solar deployment in the state, even as the state declined federal solar incentives earlier this year, she says that she sees opening up the state’s booming utility-scale solar market to competition as a priority.

Some parts of the region may be harder than others, and it is notable that SEIA has not had as much to say about Alabama, Mississippi or Louisiana, which are largely controlled by utility giants Southern Company and Entergy, or the area under the thumb of the Tennessee Valley Authority, one of the most anti-solar entities in the power sector.

Abby Hopper says ultimately, demand from customers – both individuals and corporations – is the key to transforming policy. “You replicate these victories by customer demand,” Hopper told pv magazine. “That combination of voices from the customer are what’s going to drive change.”


Related News

View more

27,000 Plus More Clean Energy Jobs Lost in May

U.S. Clean Energy Job Losses highlight COVID-19 impacts on renewable energy, solar, wind, and energy efficiency, with PPP fatigue, unemployment, and calls for Congressional stimulus, per Department of Labor data analyzed by E2.


Key Points

Pandemic-driven layoffs across renewable, solar, wind, and efficiency sectors, risking recovery without federal aid.

✅ Over 620,500 clean energy jobs lost in three months

✅ Energy efficiency, solar, and wind hit hardest nationwide

✅ Industry urges Congress for stimulus, tax credit relief


As Congress this week begins debating economic stimulus support for the energy industry, a new analysis of unemployment data shows the biggest part of America's energy economy - clean energy - lost another 27,000 jobs in May, bringing the total number of clean energy workers who have lost their jobs in the past three months to more than 620,500.

While May saw an improvement in new unemployment claims over March and April, the findings represent the sector's third straight month of significant job losses across solar, wind, energy efficiency, clean vehicles and other industries. With coronavirus cases once again rising in many states and companies beginning to run out of the Payroll Protection Program (PPP) funding that has helped small businesses keep workers employed, and as households confront pandemic power shut-offs that heighten energy insecurity, the report increases concerns the sector will be unable to resume its economy-leading jobs growth in the short- or long-term without a significant policy response.

Given the size and scope of the clean energy industry, such a sustained loss would cast a pall on the nation's overall economic recovery, as shifting electricity demand during COVID-19 complicates forecasts, according to the analysis of the Department of Labor's May unemployment data from E2 (Environmental Entrepreneurs), E4TheFuture and the American Council on Renewable Energy (ACORE).

Prior to COVID-19, clean energy - including energy efficiency, solar and wind generation, clean vehicles and related sectors - was among the U.S. economy's biggest and fastest-growing employment sectors, growing 10.4% since 2015 to nearly 3.4 million jobs at the end of 2019. That made clean energy by far the biggest employer of workers in all energy occupations, employing nearly three times as many people as the fossil fuel industry. For comparison, coal mining employs about 47,000 workers, even as clean energy projects in coal communities aim to revitalize local economies.

The latest monthly analysis for the groups by BW Research Partnership runs contrary to recent Bureau of Labor Statistics (BLS) reports, which indicated that a more robust economic rebound was underway, even as high fuel prices haven't spurred a green shift in adoption, while also acknowledging misclassifications and serious reporting difficulties in its own data.

Bob Keefe, Executive Director at E2, said:

"May's almost 30,000 clean energy jobs loss is sadly an improvement in the rate of jobs shed but make no mistake: There remains huge uncertainty and volatility ahead. It will be very tough for clean energy to make up these continuing job losses without support from Congress. Lawmakers must act now. If they do, we can get hundreds of thousands of these workers back on the job today and build a better, cleaner, more equitable economy for tomorrow. And who doesn't want that?"

Pat Stanton, Policy Director at E4TheFuture, said:

"Most of the time, energy efficiency workers need to go inside homes, businesses and other buildings to get the job done. Since they couldn't do that during COVID lockdowns, they couldn't work. Now states are opening up. But utilities, contractors and building owners need to protect employees and occupants from possible exposure to the virus and need more clarity about potential liabilities."

Gregory Wetstone, President and CEO of ACORE, said:

"In May, we saw thousands of additional renewable energy workers join the ranks of the unemployed, further underscoring the damage COVID-19 is inflicting on our workforce. Since the pandemic began, nearly 100,000 renewable energy workers have lost their jobs. We need help from Congress to get American clean energy workers back to work. With commonsense measures like temporary refundability and a delay in the phasedown of renewable energy tax credits, Congress can help restore these good-paying jobs so the renewable sector can continue to provide the affordable, pollution-free power American consumers and businesses want and deserve."

Phil Jordan, Vice President and Principal at BW Research Partnership, said:

"We understand the challenges and limitations of data collection for BLS in the middle of a global pandemic. But any suggestion that a strong employment rebound is underway in the United States simply is not reflected in the clean energy sector right now. And with PPP expiring, that only increases uncertainty in the months ahead."

The report comes as both the Senate Committee on Energy and Natural Resources and the House Energy and Commerce Committee are considering clean energy stimulus to restart the U.S. economy, and amid assessments of mixed results from the climate law shaping expectations, and as lawmakers in both the House and Senate are increasing calls for supporting clean energy workers and businesses, including this bicameral letter signed by 57 members of Congress and another signed today by 180 House members.

Industries Hit Hardest

According to the analysis, energy efficiency lost more jobs than any other clean energy sector for the third consecutive month in May, shedding about 18,900 jobs. These workers include electricians, HVAC technicians who work with high-efficiency systems, and manufacturing employees who make Energy Star appliances, LED lighting systems and efficient building materials.

Renewable energy, including solar and wind, lost nearly 4,300 jobs in May.

Clean grid and storage and clean vehicles manufacturing -- including grid modernization, energy storage, car charging and electric and plug-in hybrid vehicle manufacturing -- lost a combined 3,200 jobs in May, as energy crisis impacts electricity, gas, and EVs in several ways.

The clean fuels sector lost more than 650 jobs in May.

States and Localities Hit Across Country

California continues to be the hardest hit state in terms of total job losses, losing 4,313 jobs in May and more than 109,700 since the COVID-19 crisis began. Florida was the second hardest hit state in May, losing an additional 2,563 clean energy jobs, while Georgia, Texas, Washington, and Michigan all suffered more than 1,000 job losses across the sector. An additional 12 states saw at least 500 clean energy unemployment filings, and reports like Pennsylvania's clean energy jobs analysis provide added context, according to the latest analysis.

For a full breakdown of clean energy job losses in each state, along with a list of the hardest hit counties and metro areas, see the full analysis here.


Related News

View more

U.S. Electricity and natural gas prices explained

Energy Pricing Factors span electricity generation, transmission, and distribution costs, plus natural gas supply-demand, renewables, seasonal peaks, and wholesale pricing effects across residential, commercial, and industrial customers, usage patterns, weather, and grid constraints.


Key Points

They are the costs and market forces driving electricity and natural gas prices, from generation to delivery and demand.

✅ Generation, transmission, distribution shape electricity rates

✅ Gas prices hinge on supply, storage, imports/exports

✅ Demand shifts: weather, economy, and fuel alternatives


There are a lot of factors that affect energy prices globally. What’s included in the price to heat homes and supply them with electricity may be a lot more than some people may think.

Electricity
Generating electricity is the largest component of its price, according to the U.S. Energy Information Administration (EIA). Generation accounts for 56% of the price of electricity, while distribution and transmission account for 31% and 13% respectively.

Homeowners and businesses pay more for electricity than industrial companies, and U.S. electricity prices have recently surged, highlighting broader inflationary pressures. This is because industrial companies can take electricity at higher voltages, reducing transmission costs for energy companies.

“Industrial consumers use more electricity and can receive it at higher voltages, so supplying electricity to these customers is more efficient and less expensive. The price of electricity to industrial customers is generally close to the wholesale price of electricity,” EIA explains.

NYSEG said based on the average use of 600 kilowatt-hours per month, its customers spent the most money on delivery and transition charges in 2020, 57% or about $42, and residential electricity bills increased 5% in 2022 after inflation, according to national data. They also spent on average 35% (~$26) on supply charges and 8% (~$6) on surcharges.

Electricity prices are usually higher in the summer. Why? Because energy companies use sources of electricity that cost more money. It used to be that renewable sources, like solar and wind, were the most expensive sources of energy but increased technological advances have changed this, according to the International Energy Agency’s 2021 World Energy Outlook.

“In most markets, solar PV or wind now represents the cheapest available source of new electricity generation. Clean energy technology is becoming a major new area for investment and employment – and a dynamic arena for international collaboration and competition,” the report said.

Natural gas
The price of natural gas is driven by supply and demand. If there is more supply, prices are generally lower. If there is not as much supply, prices are generally higher the EIA explains. On the other side of the equation, more demand can also increase the price and less demand can decrease the price.

High natural gas prices mean people turn their home thermostats down a few degrees to save money, so the EIA said reduced demand can encourage companies to produce more natural gas, which would in turn help lower the cost. Lower prices will sometimes cause companies to reduce their production, therefore causing the price to rise.

The three major supply factors that affect prices: the amount of natural gas produced, how much is stored, and the volume of gas imported and exported. The three major demand factors that affect price are: changes in winter/summer weather, economic growth, and the broader energy crisis dynamics, as well as how much other fuels are available and their price, said EIA.

To think the price of natural gas is higher when the economy is thriving may sound counterintuitive but that’s exactly what happens. The EIA said this is because of increases in demand.


Related News

View more

Are Norwegian energy firms ‘best in class’ for environmental management?

CO2 Tax for UK Offshore Energy Efficiency can accelerate adoption of aero-derivative gas turbines, flare gas recovery, and combined cycle power, reducing emissions on platforms like Equinor's Mariner and supporting net zero goals.


Key Points

A carbon price pushing operators to adopt efficient turbines, flare recovery, and combined cycle to cut emissions.

✅ Aero-derivative turbines beat industrial units on efficiency

✅ Flare gas recovery cuts routine flaring and fuel waste

✅ Combined cycle raises efficiency and lowers emissions


By Tom Baxter

The recent Energy Voice article from the Equinor chairman concerning the Mariner project heralding a ‘significant point of reference’ for growth highlighted the energy efficiency achievements associated with the platform.

I view energy efficiency as a key enabler to net zero, and alongside this the UK must start large-scale storage to meet system needs; it is a topic I have been involved with for many years.

As part of my energy efficiency work, I investigated Norwegian practices and compared them with the UK.

There were many differences, here are three;


1. Power for offshore installations is usually supplied from gas turbines burning fuel from the oil and gas processing plant, and even as the UK's offshore wind supply accelerates, installations convert that to electricity or couple the gas turbine to a machine such as a gas compressor.

There are two main generic types of gas turbine – aero-derivative and industrial. As the name implies aero-derivatives are aviation engines used in a static environment. Aero-derivative turbines are designed to be energy efficient as that is very import for the aviation industry.

Not so with industrial type gas turbines; they are typically 5-10% less efficient than a comparable aero-derivative.

Industrial machines do have some advantages – they can be cheaper, require less frequent maintenance, they have a wide fuel composition tolerance and they can be procured within a shorter time frame.

My comparison showed that aero-derivative machines prevailed in Norway because of the energy efficiency advantages – not the case in the UK where there are many more offshore industrial gas turbines.

Tom Baxter is visiting professor of chemical engineering at Strathclyde University and a retired technical director at Genesis Oil and Gas Consultants


2. Offshore gas flaring is probably the most obvious source of inefficient use of energy with consequent greenhouse gas emissions.

On UK installations gas is always flared due to the design of the oil and gas processing plant.

Though not a large quantity of gas, a continuous flow of gas is routinely sent to flare from some of the process plant.

In addition the flare requires pilot flames to be maintained burning at all times and, while Europe explores electricity storage in gas pipes, a purge of hydrocarbon gas is introduced into the pipes to prevent unsafe air ingress that could lead to an explosive mixture.

On many Norwegian installations the flare system is designed differently. Flare gas recovery systems are deployed which results in no flaring during continuous operations.

Flare gas recovery systems improve energy efficiency but they are costly and add additional operational complexity.


3. Returning to gas turbines, all UK offshore gas turbines are open cycle – gas is burned to produce energy and the very hot exhaust gases are vented to the atmosphere. Around 60 -70% of the energy is lost in the exhaust gases.

Some UK fields use this hot gas as a heat source for some of the oil and gas treatment operations hence improving energy efficiency.

There is another option for gas turbines that will significantly improve energy efficiency – combined cycle, and in parallel plans for nuclear power under the green industrial revolution aim to decarbonise supply.

Here the exhaust gases from an open cycle machine are taken to a separate turbine. This additional turbine utilises exhaust heat to produce steam with the steam used to drive a second turbine to generate supplementary electricity. It is the system used in most UK power stations, even as UK low-carbon generation stalled in 2019 across the grid.

Open cycle gas turbines are around 30 – 40% efficient whereas combined cycle turbines are typically 50 – 60%. Clearly deploying a combined cycle will result in a huge greenhouse gas saving.

I have worked on the development of many UK oil and gas fields and combined cycle has rarely been considered.

The reason being is that, despite the clear energy saving, they are too costly and complex to justify deploying offshore.

However that is not the case in Norway where combined cycle is used on Oseberg, Snorre and Eldfisk.

What makes the improved Norwegian energy efficiency practices different from the UK – the answer is clear; the Norwegian CO2 tax.

A tax that makes CO2 a significant part of offshore operating costs.

The consequence being that deploying energy efficient technology is much easier to justify in Norway when compared to the UK.

Do we need a CO2 tax in the UK to meet net zero – I am convinced we do. I am in good company. BP, Shell, ExxonMobil and Total are supporting a carbon tax.

Not without justification there has been much criticism of Labour’s recent oil tax plans, alongside proposals for state-owned electricity generation that aim to reshape the power market.

To my mind Labour’s laudable aims to tackle the Climate Emergency would be much better served by supporting a CO2 tax that complements the UK's coal-free energy record by strengthening renewable investment.


Related News

View more

WY Utility's First Wind Farm Faces Replacement

Foote Creek I Wind Farm Repowering upgrades Wyoming turbines with new nacelles, towers, and blades, cutting 68 units to 12 while sustaining 41.6 MW, under PacifiCorp and Rocky Mountain Power's Energy Vision 2020 plan.


Key Points

Replacement at Foote Creek Rim I, cutting to 12 turbines while sustaining about 41.6 MW using modern 2-4.2 MW units.

✅ 12 turbines replace 68, output steady near 41.6 MW

✅ New nacelles, towers, blades; taller 500 ft turbines

✅ Part of PacifiCorp Energy Vision 2020 and Gateway West


A Wyoming utility company has filed a permit to replace its first wind farm—originally commissioned in 1998, composed of over 65 turbines—amid new gas capacity competing with nuclear in Ohio, located at Foote Creek Rim I. The replacement would downsize the number of turbines to 12, which would still generate roughly the same energy output.

According to the Star Tribune, PacifiCorp’s new installation would involve new nacelles, new towers and new blades. The permit was filed with Carbon County.


New WY Wind Farm

The replacement wind turbines will stand more than twice as tall as the old: Those currently installed stand 200 feet tall, whereas their replacements will tower closer to 500 feet. Though this move is part of the company’s overall plan to expand its state wind fleet as some utilities respond to declining coal returns in the Midwest, the work going into the Foote Creek site is somewhat special, noted David Eskelsen, spokesperson for Rocky Mountain Power, the western arm of PacifiCorp.

“Foote Creek I repowering is somewhat different from the repowering projects announced in the (Energy Vision) 2020 initiative,” he said. “Foote Creek is a complete replacement of the existing 68 foundations, towers, turbine nacelles and rotors (blades).”

Currently, the turbines at Foote Creek have 600 kilowatts capacity each; the replacements’ maximum production ranges from 2 megawatts to 4.2 megawatts each, with the total output remaining steady at 41.4 megawatts, a scale similar to a 30-megawatt wind expansion in Eastern Kings, though there will be a slight capacity increase to 41.6 megawatts, according to the Star Tribune.

As part of the wind farm repowering initiative, PacifiCorp is to become full owner and operator of the Foote Creek site. When the farm was originally built, an Oregon-based water and electric board was 21 percent owner; 37 percent of the project’s output was tied into a contract with the Bonneville Power Administration.

Otherwise, PacifiCorp is moving to further expand its state wind fleet in line with initiatives like doubling renewable electricity by 2030 in Saskatchewan, with the addition of three new wind farms—to be located in Carbon, Albany and Converse counties—which may add up to 1,150 megawatts of power.

According to PacifiCorp, the company has more than 1,000 megawatts of owned wind generation capability, along with long-term purchase agreements for more than 600 megawatts from other wind farms owned by other entities. Energy Vision 2020 refers to a $3.5 billion investment and company move that is looking to upgrade the company's existing wind fleet with newer technology, adding 1,150 megawatts of new wind resources by 2020 and a a new 140-mile Gateway West transmission segment in Wyoming, comparable to a transmission project in Missouri just energized.


Related News

View more

Electric vehicles are a hot topic in southern Alberta

Canada Electric Vehicle Adoption is accelerating as EV range doubles, fast-charging networks expand along the Trans-Canada Highway, and drivers shift from internal combustion to clean transportation to cut emissions and support climate goals.


Key Points

Canada Electric Vehicle Adoption reflects rising EV uptake, longer range, and expanding fast-charging infrastructure.

✅ Average EV range in Canada has nearly doubled in six years.

✅ Fast chargers expanding along Trans-Canada and major corridors.

✅ Gasoline and diesel demand projected to fall sharply by 2040.


As green technology for vehicles continues to grow in popularity, with a recent EV event in Regina drawing strong interest, attendance at a seminar in southern Alberta Wednesday showed plenty people want to switch to electric.

FreeU, a series of informal education sessions about electric power and climate change, including electricity vs hydrogen considerations, helped participants to learn more about the world-changing technology.

Also included at the talks was a special electric vehicle meet up, where people interested in the technology could learn about it, first hand, from drivers who've already gone gasless despite EV shortages and wait times in many regions.

"That's kind of a warning or a caution or whatever you want to call it. You get addicted to these things and that's a good example."

James Byrne, a professor of geography at the University of Lethbridge says people are much more willing these days to look to alternatives for their driving needs, though cost remains a key barrier for many.

"The internal combustion engine is on its way out. It served us well, but electric vehicles are much cleaner, aligning with Canada's EV goals set by policymakers today."

According to the Canada Energy Regulator, the average range of electric vehicles in Canada have almost doubled in the past six years.

The agency also predicts a massive decrease in gasoline and diesel use (359 petajoules and 92 petajoules respectively) in Canada by 2040. In that same timeframe, electricity use, even though fossil-fuel share remains, is expected to increase by 118 petajoules.

The country is also developing its network of fast charging stations, so running out of juice will be less of a worry for prospective buyers, even as 2035 EV mandate debate continues among analysts.

"They have just about Interstate in the U.S. covered," Marshall said. "In Canada, they're building out the [Trans-Canada Highway] right now."


Related News

View more

Sign Up for Electricity Forum’s Newsletter

Stay informed with our FREE Newsletter — get the latest news, breakthrough technologies, and expert insights, delivered straight to your inbox.

Electricity Today T&D Magazine Subscribe for FREE

Stay informed with the latest T&D policies and technologies.
  • Timely insights from industry experts
  • Practical solutions T&D engineers
  • Free access to every issue

Download the 2025 Electrical Training Catalog

Explore 50+ live, expert-led electrical training courses –

  • Interactive
  • Flexible
  • CEU-cerified