US Power Grid Cyberattacks target utilities and nuclear plants, probing SCADA, ICS, and business networks at sites like Wolf Creek; suspected Russian actors, malware, and spear-phishing trigger DHS and FBI alerts on critical infrastructure resilience.
Key Points
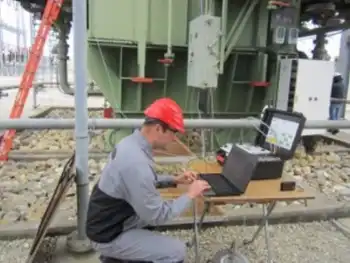
Intrusions on energy networks probing ICS and SCADA, seeking persistence and elevating risks to critical infrastructure.
✅ Wolf Creek nuclear plant targeted; no operational systems breached
✅ Attackers leveraged stolen credentials, malware, and spear-phishing
✅ DHS and FBI issued alerts; utilities enhance cyber resilience
Hackers working for a foreign government recently breached at least a dozen US power plants, including the Wolf Creek nuclear facility in Kansas, according to current and former US officials, sparking concerns the attackers were searching for vulnerabilities in the electrical grid.
The rivals could be positioning themselves to eventually disrupt the nation’s power supply, warned the officials, who noted that a general alert, prompting a renewed focus on protecting the U.S. power grid, was distributed to utilities a week ago. Adding to those concerns, hackers recently infiltrated an unidentified company that makes control systems for equipment used in the power industry, an attack that officials believe may be related.
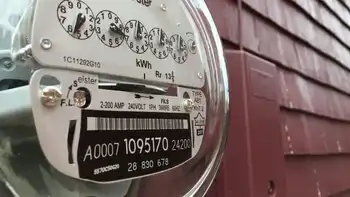
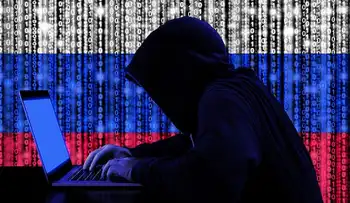
The chief suspect is Russia, according to three people familiar with the continuing effort to eject the hackers from the computer networks. One of those networks belongs to an ageing nuclear generating facility known as Wolf Creek -- owned by Westar Energy Inc, Great Plains Energy Inc, and Kansas Electric Power Cooperative Inc -- on a lake shore near Burlington, Kansas.
The possibility of a Russia connection is particularly worrying, former and current official s say, because Russian hackers have previously taken down parts of the electrical grid in Ukraine and appear to be testing increasingly advanced tools, including cyber weapons to disrupt power grids, to disrupt power supplies.
The hacks come as international tensions have flared over US intelligence agencies’ conclusion that Russia tried to influence the 2016 presidential election, and amid U.S. government condemnation of Russian power-grid hacking in recent advisories. The US, which has several continuing investigations into Russia’s activities, is known to possess digital weapons capable of disrupting the electricity grids of rival nations.
“We don’t pay attention to such anonymous fakes,” Kremlin spokesman Dmitry Peskov said, in response to a request to comment on alleged Russian involvement.
It was unclear whether President Donald Trump was planning to address the cyber attacks at his meeting on Friday with Russian President Vladimir Putin. In an earlier speech in Warsaw, Trump called out Russia’s “destabilising activities” and urged the country to join “the community of responsible nations.”
The Department of Homeland Security and Federal Bureau of Investigation said they are aware of a potential intrusion in the energy sector. The alert issued to utilities cited activities by hackers since May.
“There is no indication of a threat to public safety, as any potential impact appears to be limited to administrative and business networks,” the government agencies said in a joint statement.
The Department of Energy also said the impact appears limited to administrative and business networks and said it was working with utilities and grid operators to enhance security and resilience.
“Regardless of whether malicious actors attempt to exploit business networks or operational systems, we take any reports of malicious cyber activity potentially targeting our nation’s energy infrastructure seriously and respond accordingly,” the department said in an emailed statement.
Representatives of the National Security Council, the Director of National Intelligence and the Nuclear Regulatory Commission declined to comment. While Bloomberg News was waiting for responses from the government, the New York Times reported that hacks were targeting nuclear power stations.
The North American Electric Reliability Corp, a nonprofit that works to ensure the reliability of the continent’s power system, said it was aware of the incident and was exchanging information with the industry through a secure portal.
“At this time, there has been no bulk power system impact in North America,” the corporation said in an emailed statement.
In addition, the operational controls at Wolf Creek were not pierced, according to government officials, even as attackers accessed utility control rooms elsewhere in the U.S., according to separate reports. “There was absolutely no operational impact to Wolf Creek,” Jenny Hageman, a spokeswoman for the nuclear plant, said in a statement to Bloomberg News.
“The reason that is true is because the operational computer systems are completely separate from the corporate network.”
Determining who is behind an attack can be tricky. Government officials look at the sophistication of the tools, among other key markers, when gauging whether a foreign government is sponsoring cyber activities.
Several private security firms, including Symantec researchers, are studying data on the attacks, but none has linked the work to a particular hacking team or country.
“We don’t tie this to any known group at this point,” said Sean McBride, a lead analyst for FireEye Inc, a global cyber security firm. “It’s not to say it’s not related, but we don’t have the evidence at this point.”
US intelligence officials have long been concerned about the security of the country’s electrical grid. The recent attack, striking almost simultaneously at multiple locations, is testing the government’s ability to coordinate an effective response among several private utilities, state and local officials, and industry regulators.
Specialised teams from Homeland Security and the FBI have been scrambled to help extricate the hackers from the power stations, in some cases without informing local and state officials. Meanwhile, the US National Security Agency is working to confirm the identity of the hackers, who are said to be using computer servers in Germany, Italy, Malaysia and Turkey to cover their tracks.
Many of the power plants are conventional, but the targeting of a nuclear facility adds to the pressure. While the core of a nuclear generator is heavily protected, a sudden shutdown of the turbine can trigger safety systems. These safety devices are designed to disperse excess heat while the nuclear reaction is halted, but the safety systems themselves may be vulnerable to attack.
Homeland Security and the FBI sent out a general warning about the cyber attack to utilities and related parties on June 28, though it contained few details or the number of plants affected. The government said it was most concerned about the “persistence” of the attacks on choke points of the US power supply. That language suggests hackers are trying to establish backdoors on the plants’ systems for later use, according to a former senior DHS official who asked not to be identified.
Those backdoors can be used to insert software specifically designed to penetrate a facility’s operational controls and disrupt critical systems, according to Galina Antova, co-founder of Claroty, a New York firm that specialises in securing industrial control systems.
“We’re moving to a point where a major attack like this is very, very possible,” Antova said. “Once you’re into the control systems -- and you can get into the control systems by hacking into the plant’s regular computer network -- then the basic security mechanisms you’d expect are simply not there.”
The situation is a little different at nuclear facilities. Backup power supplies and other safeguards at nuclear sites are meant to ensure that “you can’t really cause a nuclear plant to melt down just by taking out the secondary systems that are connected to the grid,” Edwin Lyman, a nuclear expert with the Union of Concerned Scientists, said in a phone interview.
The operating systems at nuclear plants also tend to be legacy controls built decades ago and don’t have digital control systems that can be exploited by hackers. Wolf Creek, for example, began operations in 1985. “They’re relatively impervious to that kind of attack,” Lyman said.
The alert sent out last week inadvertently identified Wolf Creek as one of the victims of the attack. An analysis of one of the tools used by the hackers had the stolen credentials of a plant employee, a senior engineer. A US official acknowledged the error was not caught until after the alert was distributed.
According to a security researcher who has seen the report, the malware that activated the engineer’s username and password was designed to be used once the hackers were already inside the plant’s computer systems.
The tool tries to connect to non-public computers, and may have been intended to identify systems related to Wolf Creek’s generation plant, a part of the facility typically more modern than the nuclear reactor control room, according to a security expert who asked to note be identified because the alert is not public.
Even if there is no indication that the hackers gained access to those control systems, the design of the malware suggests they may have at least been looking for ways to do so, the expert said.
Stan Luke, the mayor of Burlington, the largest community near Wolf Creek, which is surrounded by corn fields and cattle pastures, said he learned about a cyber threat at the plant only recently, and then only through golfing buddies.
With a population of just 2,700, Burlington boasts a community pool with three water slides and a high school football stadium that would be the envy of any junior college. Luke said those amenities lead back to the tax dollars poured into the community by Wolf Creek, Coffey County’s largest employer with some 1,000 workers, 600 of whom live in the county.
E&E News first reported on digital attacks targeting US nuclear plants, adding it was code-named Nuclear 17. A senior US official told Bloomberg that there was a bigger breach of conventional plants, which could affect multiple regions.
Industry experts and US officials say the attack is being taken seriously, in part because of recent events in Ukraine. Antova said that the Ukrainian power grid has been disrupted at least twice, first in 2015, and then in a more automated attack last year, suggesting the hackers are testing methods.
Scott Aaronson, executive director for security and business continuity at the Edison Electric Institute, an industry trade group, said utilities, grid operators and federal officials were already dissecting the attack on Ukraine’s electric sector to apply lessons in North America before the US government issued the latest warning to “energy and critical manufacturing sectors”. The current threat is unrelated to recently publicised ransomware incidents or the CrashOverride malware, Mr Aaronson said in an emailed statement.
Neither attack in Ukraine caused long-term damage. But with each escalation, the hackers may be gauging the world’s willingness to push back.
“If you think about a typical war, some of the acts that have been taken against critical infrastructure in Ukraine and even in the US, those would be considered crossing red lines,” Antova said.
Related News