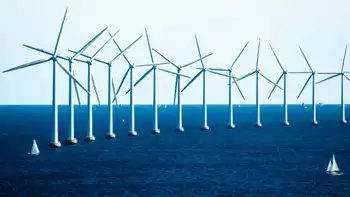
Wind facilities reach million megawatt-hour milestone

By Business Wire


Protective Relay Training - Basic

Our customized live online or in‑person group training can be delivered to your staff at your location.

  • Live Online
  • 12 hours Instructor-led
  • Group Training Available
Regular Price:
$699
Coupon Price:
$599
Reserve Your Seat Today
Puget Sound Energy (PSE) announced that its Hopkins Ridge and Wild Horse wind facilities have both reached a milestone, with each facility now having produced more than 1 million megawatt hours (MWh) of clean, renewable electricity since entering service in 2005 and 2006 respectively.

“Wind energy is now a proven performer for meeting our customers’ growing demand,” said Kimberly Harris, executive vice president and chief resource officer for PSE. “Not long ago, wind power was only a concept. Today, it is a clean, renewable resource for helping combat climate change.”

PSE is the largest utility generator of renewable energy in the Northwest, with its two wind facilities producing enough electricity, on average, to meet the equivalent of the needs of approximately 100,000 homes. PSE owns and operates the Hopkins Ridge Wind Facility in Columbia County, Wash., and the Wild Horse Wind Facility in Kittitas County, Wash.

Hopkins Ridge, near the historic city of Dayton, began operation in November 2005 and has 87 wind turbines with the capacity to produce 150 megawatts (MW) of electricity. It reached the 1 million MWh mark of cumulative energy production on June 3, 2008. Wild Horse, located east of Ellensburg, entered service in December 2006 and has 127 wind turbines with the capacity to produce 229 MW of electricity. It reached the 1 million MWh mark on July 4, 2008. PSE is completing construction on four additional turbines at Hopkins Ridge, and recently announced plans to expand Wild Horse with an additional 26 turbines by late 2009.

“Hopkins Ridge and Wild Horse have exceeded our expectations,” Harris said. “This year, both facilities are producing about 6 percent more electricity than our meteorological and engineering studies had predicted, and have shown themselves to be reliable resources throughout the year.”

In addition to the energy they generated, the two PSE facilities have had a significant economic impact on the local communities near which they operate. Combined, the two facilities have paid more than $3.3 million in state, county and local taxes since going into operation. Each has also generated more than 20 permanent jobs in their home communities and 150 to 250 temporary jobs during construction.

The Kittitas ValleyÂ’s role in providing clean energy through wind and solar power is showcased in PSEÂ’s Renewable Energy Center, a visitor center offering a first-hand look at operating wind turbines and solar photovoltaic panels. Open to the public for the first time in April 2008, the center has already welcomed more than 6,500 visitors. The center is open from 9 a.m. to 5:30 p.m. seven days a week from April through November, excluding during severe weather.

Related News

FortisAlberta Takes Necessary Precautions to Provide Electricity Service for Alberta

FortisAlberta COVID-19 response delivers safe electricity distribution across Alberta, with remote monitoring, 24/7 support, outage alerts, dispersed crews, and business continuity measures to sustain essential services for customers and communities.


Key Points

Plan ensuring reliable electricity in Alberta through 24/7 support, remote monitoring, outage alerts, and dispersed crews.

✅ 24/7 customer support via 310-WIRE and mobile app

✅ Remote monitoring and rapid outage restoration

✅ Dispersed crews in 50 communities for faster response


As the COVID-19 pandemic continues to evolve in Alberta (and around the world), FortisAlberta is taking the necessary actions and precautions informed by utility disaster planning to protect the health and well-being of its employees and to provide electricity service to its customers. FortisAlberta serves more than half a million customers with the electricity they depend on to take care of their families and community members throughout our province.

"We recognize these are challenging times as while most Albertans are asked to stay home others continue to work in the community to provide essential services, including utility workers in Ontario demonstrating support efforts. As your electricity distribution provider, please be assured you can count on us to do what we do best – provide our customers with safe and reliable electricity service wherever and whenever they need it," says Michael Mosher, FortisAlberta President and CEO.

FortisAlberta is proud to be a part of the communities it serves and commits to keeping the lights on for its customers. The company is providing a full range of services for its customers and has instilled best practices within critical parts of its business. The company's control centre continues to remotely monitor, control, and restore, where possible, the delivery of power across the entire province, including during events such as an Alberta grid alert that stress the system. Early in March, FortisAlberta implemented its business continuity plan and the company remains fully accessible to customers 24/7 by phone at 310-WIRE (9473) or through its mobile app where customers can report outages online or view details of an outage. Customers can also sign up for outage alerts to their mobile phone and/or email address to let them know if an outage does occur.

FortisAlberta's power line employees are geographically dispersed across 50 different communities so they can quickly address any issues that may arise. The company has implemented work from home measures and isolation best practices, and is planning for potential on-site lockdowns where necessary to ensure no disruption to customers.

FortisAlberta will continue to remain in close communication with its stakeholders to provide updates to customers and with industry associations to share guidance specific to the electricity sector, including insights on the evolving U.S. grid response to COVID-19 from peer utilities. FortisAlberta will also continue to invest in and empower its communities by contributing to organizations that offer programs and services aligned with the greatest needs in the communities it serves.

With the Alberta Government's recent announcement to provide relief to eligible Albertans by deferring electricity and gas charges for up to 90 days, similar to some B.C. relief measures being implemented, FortisAlberta is committed to working with stakeholders and retail partners to ensure this option is available to customers quickly and efficiently, and to learn from initiatives like the Hydro One relief fund that support customers.


Related News

View more

US January power generation jumps 9.3% on year: EIA

US January power generation climbed to 373.2 TWh, EIA data shows, with coal edging natural gas, record wind output, record nuclear generation, rising hydro, and stable utility-scale solar amid higher Henry Hub prices.


Key Points

US January power generation hit 373.2 TWh; coal led gas, wind and nuclear set records, with solar edging higher.

✅ Coal 31.8% share; gas 29.4%; coal output 118.7 TWh, gas 109.6 TWh.

✅ Wind hit record 26.8 TWh; nuclear record 74.6 TWh.

✅ Total generation 373.2 TWh, highest January since 2014.


The US generated 373.2 TWh of power in January, up 7.9% from 345.9 TWh in December and 9.3% higher than the same month in 2017, Energy Information Administration data shows.

The monthly total was the highest amount in January since 377.3 TWh was generated in January 2014.

Coal generation totaled 118.7 TWh in January, up 11.4% from 106.58 TWh in December and up 2.8% from the year-ago month, consistent with projections of a coal-fired generation increase for the first time since 2014. It was also the highest amount generated in January since 132.4 TWh in 2015.

For the second straight month, more power was generated from coal than natural gas, as 109.6 TWh came from gas, up 3.3% from 106.14 TWh in December and up 19.9% on the year.

However, the 118.7 TWh generated from coal was down 9.6% from the five-year average for the month, due to the higher usage of gas and renewables and a rising share of non-fossil generation in the overall mix.

#google#

Coal made up 31.8% of the total US power generation in January, up from 30.8% in December but down from 33.8% in January 2017.

Gas` generation share was at 29.4% in the latest month, with momentum from record gas-fired electricity earlier in the period, down from 30.7% in December but up from 26.8% in the year-ago month.

In January, the NYMEX Henry Hub gas futures price averaged $3.16/MMBtu, up 13.9% from $2.78/MMBtu averaged in December but down 4% from $3.29/MMBtu averaged in the year-ago month.


WIND, NUCLEAR GENERATION AT RECORD HIGHS

Wind generation was at a record-high 26.8 TWh in January, up 29.3% from 22.8 TWh in December and the highest amount on record, according to EIA data going back to January 2001. Wind generated 7.2% of the nation`s power in January, as an EIA summer outlook anticipates larger wind and solar contributions, up from 6.6% in December and 6.1% in the year-ago month.

Utility-scale solar generated 3.3 TWh in January, up 1.3% from 3.1 TWh in December and up 51.6% on the year. In January, utility-scale solar generation made up 0.9% of US power generation, during a period when solar and wind supplied 10% of US electricity in early 2018, flat from December but up from 0.6% in January 2017.

Nuclear generation was also at a record-high 74.6 TWh in January, up 1.3% month on month and the highest monthly total since the EIA started tracking it in January 2001, eclipsing the previous record of 74.3 TWh set in July 2008. Nuclear generation made up 20% of the US power in January, down from 21.3% in December and 21.4% in the year-ago month.

Hydro power totaled 25.4 TWh in January, making up 6.8% of US power generation during the month, up from 6.5% in December but down from 8.2% in January 2017.


Related News

View more

Hydro One CEO's $4.5M salary won't be reduced to help cut electricity costs

Hydro One CEO Salary shapes debate on Ontario electricity costs, executive compensation, sunshine list transparency, and public disclosure rules, as officials argue pay is not driving planned hydro rate cuts for consumers.


Key Points

Hydro One CEO pay disclosed in public filings, central to debates on Ontario electricity rates and transparency.

✅ 2016 compensation: $4.5M (salary + bonuses)

✅ Excluded from Ontario's sunshine list after privatization

✅ Government says pay won't affect planned hydro rate cuts


The $4.5 million in pay received by Hydro One's CEO is not a factor in the government's plan to cut electricity costs for consumers, an Ontario cabinet minister said Thursday amid opposition concerns about the executive's compensation and wider sector pressures such as Manitoba Hydro's rising debt in other provinces.

Treasury Board President Liz Sandals made her comments on the eve of the release of the province's so-called sunshine list.

The annual disclosure of public-sector salaries over $100,000 will be released Friday, but Hydro One salaries such as that of company boss Mayo Schmidt won't be on it.Though the government still owns most of Hydro One — 30 per cent has been sold — the company is required to follow the financial disclosure rules of publicly traded companies, which means disclosing the salaries of its CEO, CFO and next three highest-paid executives, and financial results such as a Q2 profit decline in filings.

New filings show that Schmidt was paid $4.5 million in 2016 — an $850,000 salary plus bonuses — and those top five executives were paid a total of about $11.7 million. 

"Clearly that's a very large amount," said Sandals. Sandals wouldn't say whether or not she thought the pay was appropriate at a time when the government is trying to reduce system costs and cut people's hydro bills.

Mayo Schmidt, President & CEO of Hydro One Limited and Hydro One Inc. (Hydro One )

But she suggested the CEO's salary was not a factor in efforts to bring down hydro prices, even as Hydro One shares fell after a leadership shakeup in a later period. "The CEO salary is not part of the equation of will 'we be able to make the cut,"' she said. "Regardless of what those salaries are, we will make a 25-per-cent-off cut." The cut coming this summer is actually an average of 17 per cent -- the 25-per-cent figure factors in an earlier eight-per-cent rebate.

NDP Leader Andrea Horwath, who has proposed to make hydro public again in Ontario, said the executive salaries are relevant to cutting hydro costs.

"All of this is cost of operating the electricity system, it's part of the operating of Hydro One and so of course those increased salaries are going to impact the cost of our electricity," she said.

Schmidt was appointed Aug. 31, 2015, and in the last four months of that year earned $1.3 million, but the former CEO was paid $745,000 in 2014. About 3,800 workers were paid over $100,000 that year, none of whom will be on the sunshine list this year.

Progressive Conservative energy critic Todd Smith has a private member's bill that would put Hydro One salaries back on the list, amid investor concerns about Hydro One that cite too many unknowns.

"The Wynne Liberals don't want the people of Ontario to know that their rates have helped create a new millionaire's club at Hydro One," Smith said. "Hydro One is still under the majority ownership of the public, but Premier Kathleen Wynne has removed these salaries from the public's watchful eye."

The previous sunshine list showed 115,431 people were earning more than $100,000 — an increase of nearly 4,000 people despite the fact 3,774 Hydro One workers were not on the list for the first time.

Tom Mitchell, the former CEO at Ontario Power Generation who resigned last summer, topped the 2015 list at $1.59 million.


Related News

View more

'Unbelievably dangerous': NB Power sounds alarm on copper theft after vandalism, deaths

NB Power copper thefts highlight risks at high-voltage substations, with vandalism, fatalities, infrastructure damage, ratepayer costs, and law enforcement alerts tied to metal prices, stolen electricity, and safety concerns across New Brunswick and Nova Scotia.


Key Points

Substation metal thefts causing fatalities, outages, safety risks, and higher costs that impact NB ratepayers.

✅ Spike aligns with copper price near $3 per pound

✅ Fatal break-ins at high-voltage facilities in Bathurst

✅ Repairs, delays, and safety risks for crews, customers


New Brunswick's power utility is urging people to stay away from its substations, saying the valuable copper they contain is proving hard to resist for thieves.

NB Power has seen almost as many incidents of theft and vandalism to its property in April and May of this year, than in all of last year.

In the 2018-2019 fiscal year, the utility recorded 16 cases of theft and/or vandalism.

In April and May, there have already been 13 cases.

One of those was a fatal incident in Bathurst. On April 13, a 41-year-old man was found unresponsive and later died, after breaking into a substation. It was the second fatality linked to a break-in at an NB Power facility in 10 years.

The investigation is still ongoing, but NB Power believes the man was trying to steal copper.

The power utility has been ramping up its efforts -- finding alternate ways to secure its properties, and educate the public -- on the dangers of copper theft, as utilities work to adapt to climate change that can exacerbate severe weather.

“We really, really, really want to stress that if you’re hitting the wrong wire, cutting the wrong wire, breaking in to or cutting fences, a lot of very bad things can happen,” said NB Power spokesperson Marc Belliveau.

In the 2017-2018 fiscal year, there were 24 recorded cases of theft and/or vandalism.

It also comes at a financial cost for NB Power, and ratepayers -- on average, $330,000 a year. About two-thirds of that is copper. The rest is vehicle break-ins or stolen electricity.

“We’ve done analysis,” Belliveau said. “Often the number of break-ins correspond with the price spiking in copper. So, right now, copper’s about $3 a pound. If it was half of that, there might be half as many incidents.”

New Brunswick Public Safety Minister Carl Urquhart says he knows the utility and police are working to dissuade people from the dangers of the theft, and notes that debates around Site C dam stability issues reflect broader infrastructure safety concerns.

“We all know of incident after incident of major injuries and death caused by, simply by, copper,” he said.

Last November, a Dawson Settlement substation was targeted during a major, storm-related power outage in the province.

It meant NB Power had to divert crews to fix and secure the substation, delaying restoration times for some residents and underscoring efforts to improve local reliability across the grid.

Belliveau says that’s “most frustrating.”

“We’re really trying to take a more proactive approach. And certainly, we encourage people that if you know somebody who’s thinking of doing something like that, to really try and talk them out of it because it’s unbelievably dangerous to break in to a substation,” he said.

Nova Scotia Power, connected through the Maritime Link, was not able to provide details on thefts at their substations, but spokesman David Rodenhiser said "the value of the stolen copper is minor in comparison to the risk that’s created when thieves break into our high-voltage electrical substations."

It's not just risky for the people breaking in, and public opposition to projects like Site C underscores broader community safety concerns.

"It also puts the safety of the workers who maintain our substations at risk, because when thieves steal copper, the protective safety devices in the substations don’t work properly," Rodenhiser said.

Additionally, in Nova Scotia, projects like the Maritime Link have advanced regional transmission, and Nova Scotia Power’s copper components have identifying markers, which make that copper difficult to fence. Anyone who buys or sells stolen propery is at risk of criminal charges.


Related News

View more

IEA: Electricity investment surpasses oil and gas for the first time

Electricity Investment Surpasses Oil and Gas 2016, driven by renewable energy, power grids, and energy efficiency, as IEA reports lower oil and gas spending, rising solar and wind capacity, and declining coal power plant approvals.


Key Points

A 2016 milestone where electricity topped global energy investment, led by renewables, grids, and efficiency, per the IEA.

✅ IEA: electricity investment hit $718b; oil and gas fell to $650b.

✅ Renewables led with $297b; solar and wind unit costs declined.

✅ Coal plant approvals plunged; networks and storage spending rose.


Investments in electricity surpassed those in oil and gas for the first time ever in 2016 on a spending splurge on renewable energy and power grids as the fall in crude prices led to deep cuts, the International Energy Agency (IEA) said.

Total energy investment fell for the second straight year by 12 per cent to US$1.7 trillion compared with 2015, the IEA said. Oil and gas investments plunged 26 per cent to US$650 billion, down by over a quarter in 2016, and electricity generation slipped 5 per cent.

"This decline (in energy investment) is attributed to two reasons," IEA chief economist Laszlo Varro told journalists.

"The reaction of the oil and gas industry to the prolonged period of low oil prices which was a period of harsh investment cuts; and technological progress which is reducing investment costs in both renewable power and in oil and gas," he said.

Oil and gas investment is expected to rebound modestly by 3 per cent in 2017, driven by a 53 per cent upswing in U.S. shale, and spending in Russia and the Middle East, the IEA said in a report.

"The rapid ramp up of U.S. shale activities has triggered an increase of U.S. shale costs of 16 per cent in 2017 after having almost halved from 2014-16," the report said.

The global electricity sector, however, was the largest recipient of energy investment in 2016 for the first time ever, overtaking oil, gas and coal combined, the report said.

"Robust investments in renewable energy and increased spending in electricity networks, which supports the outlook that low-emissions sources will cover most demand growth, made electricity the biggest area of capital investments," Varro said.

Electricity investment worldwide was US$718 billion, lifted by higher spending in power grids which offset the fall in power generation investments.

"Investment in new renewables-based power capacity, at US$297 billion, remained the largest area of electricity spending, despite falling back by 3 per cent as clean energy investment in developing nations slipped, the report said."

Although renewables investments was 3 per cent lower than five years ago, capacity additions were 50 per cent higher and expected output from this capacity about 35 per cent higher, thanks to the fall in unit costs and technology improvements in solar PV and wind generation, the IEA said.


COAL INVESTMENT IS COMING TO AN END

Investments in coal-fired electricity plants fell sharply. Sanctioning of new coal power plants fell to the lowest level in nearly 15 years, reflecting concerns about local air pollution, and emergence of overcapacity and competition from renewables, with renewables poised to eclipse coal in global power generation, notably in China. Coal investments, however, grew in India.

"Coal investment is coming to an end. At the very least, it is coming to a pause," Varro said.

The IEA report said energy efficiency investments continued to expand in 2016, reaching US$231 billion, with most of it going to the building sector globally.

Electric vehicles sales rose 38 per cent in 2016 to 750,000 vehicles at $6 billion, and represented 10 per cent of all transport efficiency spending. Some US$6 billion was spent globally on electronic vehicle charging stations, the IEA said.

Spending on electricity networks and storage continued the steady rise of the past five years, as surging electricity demand puts power systems under strain, reaching an all-time high of US$277 billion in 2016, with 30 per cent of the expansion driven by China’s spending in its distribution system, the report said.

China led the world in energy investments with 21 per cent of global total share, the report said, driven by low-carbon electricity supply and networks projects.

Although oil and gas investments fell in the United States in 2016, its total energy investments rose 16 per cent, even as Americans use less electricity in recent years, on the back of spending in renewables projects, the IEA report said.


Related News

View more

Solar + Wind = 10% of US Electricity Generation in 1st Half of 2018

US Electricity Generation H1 2018 saw wind and solar gains but hydro declines, as natural gas led the grid mix and coal fell; renewables' share, GWh, emissions, and capacity additions shaped the power sector.


Key Points

It is the H1 2018 US power mix, where natural gas led, coal declined, and wind and solar grew while hydro fell.

✅ Natural gas reached 32% of generation, highest share

✅ Coal fell; renewables roughly tied nuclear at ~20%

✅ Wind and solar up; hydro output down vs 2017


To complement our revival of US electricity capacity reports, here’s a revival of our reports on US electricity generation.

As with the fresh new capacity report, things are not looking too bright when it comes to electricity generation. There’s still a lot of grey — in the bar charts below, in the skies near fossil fuel power plants, and in the human and planetary outlook based on how slowly we are cutting fossil fuel electricity generation.

As you can see in the charts above, wind and solar energy generation increased notably from the first half of 2017 to the first half of 2018, and the EIA expected larger summer solar and wind generation in subsequent months, reinforcing that momentum.

A large positive when it comes to the environment and human health is that coal generation dropped a great deal year over year — by even more than renewables increased, though the EIA later noted an increase in coal-fired generation in a subsequent year, complicating the trend. However, on the down side, natural gas soared as it became the #1 source of electricity generation in the United States (32% of US electricity). Furthermore, coal was still solidly in the #2 position (27% of US electricity). Renewables and nuclear were essentially in a tie at 19.8% of generation, with renewables just a tad above nuclear.

Actually, combined with an increase in nuclear power generation, natural gas electricity production increased so much that the renewable energy share of electricity generation actually dropped in the first half of 2018 versus the first half of 2017, even amid declining electricity use in some periods. It was 19.8% this year and 20% last year.

Again, solar and wind saw a significant growth in its market share, from 9% to 9.9%, but hydro brought the whole category down due to a decrease from 9% to 8%.

The visuals above are probably the best way to examine it all. The H1 2018 chart was still dominated by fossil fuels, which together accounted for approximately 60% of electricity generation, even though by 2021 non-fossil sources supplied about 40% of U.S. electricity, highlighting the longer-term shift. In H1 2017, the figure was 59.7%. Furthermore, if you switch to the “Change H1 2018 vs H1 2017 (GWh)” chart, you can watch a giant grey bar representing natural gas take over the top of the chart. It almost looks like it’s part of the border of the chart. The biggest glimmer of positivity in that chart is seeing the decline in coal at the bottom.

What will the second half of the year bring? Well, the gigantic US electricity generation market shifts slowly, even as monthly figures can swing, as January generation jumped 9.3% year over year according to the EIA, reminding us about volatility. There is so much base capacity, and power plants last so long, that it takes a special kind of magic to create a rapid transition to renewable energy. As you know from reading this quarter’s US renewable energy capacity report, only 43% of new US power capacity in the first half of the year was from renewables. The majority of it was from natural gas. Along with other portions of the calculation, that means that electricity generation from natural gas is likely to increase more than electricity generation from renewables.

Jump into the numbers below and let us know if you have any more thoughts.


Related News

View more

Sign Up for Electricity Forum’s Newsletter

Stay informed with our FREE Newsletter — get the latest news, breakthrough technologies, and expert insights, delivered straight to your inbox.

Electricity Today T&D Magazine Subscribe for FREE

Stay informed with the latest T&D policies and technologies.
  • Timely insights from industry experts
  • Practical solutions T&D engineers
  • Free access to every issue

Live Online & In-person Group Training

Advantages To Instructor-Led Training – Instructor-Led Course, Customized Training, Multiple Locations, Economical, CEU Credits, Course Discounts.

Request For Quotation

Whether you would prefer Live Online or In-Person instruction, our electrical training courses can be tailored to meet your company's specific requirements and delivered to your employees in one location or at various locations.