Canadian EV Manufacturing is accelerating with GM, Ford, and Project Arrow, integrating cross-border supply chains, battery production, rare-earths like lithium and cobalt, autonomous tech, and home charging to drive clean mobility and decarbonization.
Key Points
Canadian EV manufacturing spans electric and autonomous vehicles, domestic batteries, and integrated US-Canada trade.
✅ GM and Ford retool plants for EVs and autonomous production
✅ Project Arrow showcases Canadian zero-emission supply capabilities
✅ Lithium, cobalt, and battery hubs target cross-border resilience
The storied North American automotive industry, the ultimate showcase of Canada’s high-tensile trade ties with the United States and emerging Canada-U.S. collaboration on EVs momentum, is about to navigate a dramatic hairpin turn.
But as the Big Three veer into the all-electric, autonomous era, some Canadians want to seize the moment and take the wheel.
“There’s a long shadow between the promise and the execution, but all the pieces are there,” says Flavio Volpe, president of the Automotive Parts Manufacturers’ Association.
“We went from a marriage on the rocks to one that both partners are committed to. It could be the best second chapter ever.”
Volpe is referring specifically to GM, which announced late last month an ambitious plan to convert its entire portfolio of vehicles to an all-electric platform by 2035.
But that decision is just part of a cascading transformation across the industry, marking an EV inflection point with existential ramifications for one of the most tightly integrated cross-border manufacturing and supply-chain relationships in the world.
China is already working hard to become the “source of a new way” to power vehicles, President Joe Biden warned last week.
“We just have to step up.”
Canada has both the resources and expertise to do the same, says Volpe, whose ambitious Project Arrow concept — a homegrown zero-emissions vehicle named for the 1950s-era Avro interceptor jet — is designed to showcase exactly that, as recent EV assembly deals in Canada underscore.
“We’re going to prove to the market, we’re going to prove to the (manufacturers) around the planet, that everything that goes into your zero-emission vehicle can be made or sourced here in Canada,” he says.
“If somebody wants to bring what we did over the line and make 100,000 of them a year, I’ll hand it to them.”
GM earned the ire of Canadian auto workers in 2018 by announcing the closure of its assembly plant in Oshawa, Ont. It later resurrected the facility with a $170-million investment to retool it for autonomous vehicles.
“It was, ‘You closed Oshawa, how dare you?’ And I was one of the ‘How dare you’ people,” Volpe says.
“Well, now that they’ve reopened Oshawa, you sit there and you open your eyes to the commitment that General Motors made.”
Ford, too, has entered the fray, promising $1.8 billion to retool its sprawling landmark facility in Oakville, Ont., to build EVs.
It’s a leap of faith of sorts, considering what market experts say is ongoing consumer doubt about EVs and EV supply shortages that drive wait times.
“Range anxiety” — the persistent fear of a depleted battery at the side of the road — remains a major concern, even though it’s less of a problem than most people think.
Consulting firm Deloitte Canada, which has been tracking automotive consumer trends for more than a decade, found three-quarters of future EV buyers it surveyed planned to charge their vehicles at home overnight.
“The difference between what is a perceived issue in a consumer’s mind and what is an actual issue is actually quite negligible,” Ryan Robinson, Deloitte’s automotive research leader, says in an interview.
“It’s still an issue, full stop, and that’s something that the industry is going to have to contend with.”
So, too, is price, especially with the end of the COVID-19 pandemic still a long way off. Deloitte’s latest survey, released last month, found 45 per cent of future buyers in Canada hope to spend less than $35,000 — a tall order when most base electric-vehicle models hover between $40,000 and $45,000.
“You put all of that together and there’s still, despite the electric-car revolution hype, some major challenges that a lot of stakeholders that touch the automotive industry face,” Robinson says.
“It’s not just government, it’s not just automakers, but there are a variety of stakeholders that have a role to play in making sure that Canadians are ready to make the transition over to electric mobility.”
With protectionism no longer a dirty word in the United States and Biden promising to prioritize American workers and suppliers, the Canadian government’s job remains the same as it ever was: making sure the U.S. understands Canada’s mission-critical role in its own economic priorities.
“We’re both going to be better off on both sides of the border, as we have been in the past, if we orient ourselves toward this global competition as one force,” says Gerald Butts, vice-chairman of the political-risk consultancy Eurasia Group and a former principal secretary to Prime Minister Justin Trudeau.
“It served us extraordinarily well in the past … and I have no reason to believe it won’t serve us well in the future.”
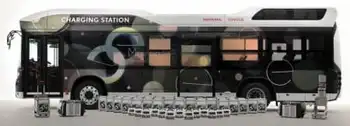
Last month, GM announced a billion-dollar plan to build its new all-electric BrightDrop EV600 van in Ingersoll, Ont., at Canada’s first large-scale EV manufacturing plant for delivery vehicles.
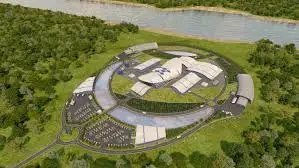
That investment, Volpe says, assumes Canada will take the steps necessary to help build a homegrown battery industry — with projects such as a new Niagara-region battery plant pointing the way — drawing on the country’s rare-earth resources like lithium and cobalt that are waiting to be extracted in northern Ontario, Quebec and elsewhere.
Given that the EV industry is still in his infancy, the free market alone won’t be enough to ensure those resources can be extracted and developed, he says.
“General Motors made a billion-dollar bet on Canada because it’s going to assume that the Canadian government — this one or the next one — is going to commit” to building that business.
Such an investment would pay dividends well beyond the auto sector, considering the federal Liberal government’s commitment to lowering greenhouse gas-emissions, including a 2035 EV mandate, and meeting targets set out in the Paris climate accord.
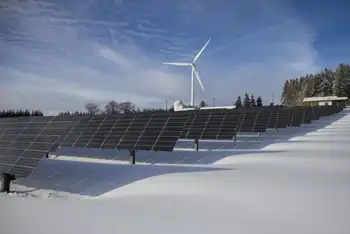
“If you make investments in renewable energy and utility storage using battery technology, you can build an industry at scale that the auto industry can borrow,” Volpe says.
Major manufacturing, retail and office facilities would be able to use that technology to help “shave the peak” off Canada’s GHG emissions and achieve those targets, all the while paving the way for a self-sufficient electric-vehicle industry.
“You’d be investing in the exact same technology you’d use in a car.”
There’s one problem, says Robinson: the lithium-ion batteries on roads right now might not be where the industry ultimately lands.
“We’re not done with with battery technology,” Robinson says. “What you don’t want to do is invest in a technology that is that is rapidly evolving, and could potentially become obsolete going forward.”
Fuel cells — energy-efficient, hydrogen-powered units that work like batteries, but without the need for constant recharging — continue to be part of the conversation, he adds.
“The amount of investment is huge, and you want to be sure that you’re making the right decision, so you don’t find yourself behind the curve just as all that capacity is coming online.”
Related News