Nova Scotia Power Rate Increase Settlement faces UARB scrutiny as regulators weigh electricity rates, fuel costs, storm rider provisions, Bill 212 limits, and Muskrat Falls impacts on ratepayers and affordability for residential and industrial customers.
Key Points
A deal proposing 13.8% electricity hikes for 2023-2024, before the UARB, covering fuel costs, a storm rider, and Bill 212.
✅ UARB review may set different rates than the settlement
✅ Fuel cost prepayment and hedging incentives questioned
✅ Storm rider shifts climate risk onto ratepayers
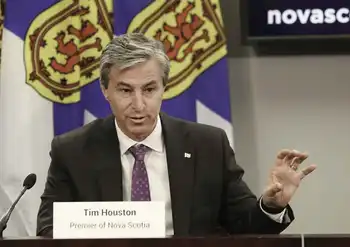
Nova Scotia Premier Tim Houston is calling on provincial regulators to reject a settlement agreement between Nova Scotia Power and customer groups that would see electricity rates rise by nearly 14% electricity rate hike over the next two years.
"It is our shared responsibility to protect ratepayers and I can't state strongly enough how concerned I am that the agreement before you does not do that," Houston wrote in a letter to the Nova Scotia Utility and Review Board late Monday.
Houston urged the three-member panel to "set the agreement aside and reach its own conclusion on the aforementioned application."
"I do not believe, based on what I know, that the proposed agreement is in the best interest of ratepayers," he said.
The letter does not spell out what his Progressive Conservative government would do if the board accepts the settlement reached last week between Nova Scotia Power and lawyers representing residential, small business and large industrial customer classes.
Other groups also endorsed the deal, although Nova Scotia Power's biggest customer — Port Hawkesbury Paper — did not sign on.
'We're protecting the ratepayers'
Natural Resources Minister Tory Rushton said the province was not part of the negotiations leading up to the settlement.
"As a government or department we had no intel on those conversations that were taking place," he said Tuesday. "So, we saw the information the same as the public did late last week, and right now we're protecting the ratepayers of Nova Scotia, even though the province cannot order Nova Scotia Power to lower rates under current law. We want to make sure that that voice is still heard at the UARB level."
Rushton said he didn't want to presuppose what the UARB will say.
"But I think the premier's been very loud and clear and I believe I have been, too. The ratepayers are at the top of our mind. We have different tools at our [disposal] and we'll certainly do what we can and need to [do] to protect those ratepayers."
The settlement agreement
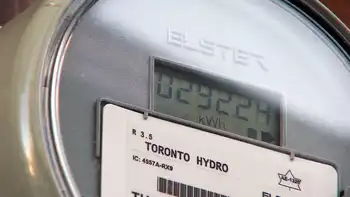
If approved by regulators, rates would rise by 6.9 per cent in 2023 and 6.9 per cent in 2024 — almost the same amount on the table when hearings before the review board ended in September.
The Houston government later intervened with legislation, known as Bill 212, that capped rates to cover non-fuel costs by 1.8 per cent. It did not cap rates to cover fuel costs or energy efficiency programs.
In a statement announcing the agreement, Nova Scotia Power president Peter Gregg claimed the settlement adhered "to the direction provided by the provincial government through Bill 212."
Consumer advocate Bill Mahody, representing residential customers, told CBC News the proposed 13.8 per cent increase was "a reasonable rate increase given the revenue requirement that was testified to at the hearing."
Settlement 'remarkably' similar to NSP application
The premier disagrees, noting that the settlement and rate application that triggered the rate cap are "remarkably consistent."
He objects to the increased amount of fuel costs rolled into rates next year before the annual true up of actual fuel costs, which are automatically passed on to ratepayers.
"If Nova Scotia Power is effectively paid in advance, what motive do they have to hedge and mitigate the adjustment eventually required," Houston asked in his letter.
He also objected to the inclusion of a storm rider in rates to cover extreme weather, which he said pushed the risk of climate change on to ratepayers.
Premier second-guesses Muskrat Falls approval
Houston also second-guessed the board for approving Nova Scotia Power's participation in the Muskrat Falls hydro project in Labrador.
"The fact that Nova Scotians have paid over $500 million for this project with minimal benefit, and no one has been held accountable, is wrong," he said. "It was this board of the day that approved the contracts and entered the final project into rates."
Ratepayers are committed to paying $1.7 billion for the Maritime Link to bring the green source of electricity into the province, while rate mitigation talks in Newfoundland lack public details for their customers.
Although the Maritime Link was built on time and on budget by an affiliated company, only a fraction of Muskrat Falls hydro has been delivered because of ongoing problems in Newfoundland, including an 18% electricity rate hike deemed unacceptable by the province's consumer advocate.
"I find it remarkable that those contracts did not include different risk sharing mechanisms; they should have had provisions for issues in oversight of project management. Nevertheless, it was approved, and is causing significant harm to ratepayers in the form of increased rates."
Houston notes that because of non-delivery from Muskrat Falls, Nova Scotia Power has been forced to buy much more expensive coal to burn to generate electricity.
Opposition reaction
Opposition parties in Nova Scotia reacted to Houston's letter.
NDP Leader Claudia Chender dismissed it as bluster.
"It exposes his Bill 212 as not really helping Nova Scotians in the way that he said it would," she said. "Nothing in the settlement agreement contravenes that bill. But it seems that he's upset that he's been found out. And so here we are with another intervention in an independent regulatory body."
Liberal Leader Zach Churchill said the government should intervene to help ratepayers directly.
"We just think that it makes more sense to do that directly by supporting ratepayers through heating assistance, lump-sum electricity credits, rebate programs and expanding the eligibility for that or to provide funding directly to ratepayers instead of intervening in the energy market in this way," he said.
The premier's office said that no one was available when asked about an interview on Tuesday.
"The letter speaks for itself," the office responded.
Nova Scotia Power issued a statement Tuesday. It did not directly address Houston's claims.
"The settlement agreement is now with the NS Utility and Review Board," the utility said.
"The UARB process is designed to ensure customers are represented with strong advocates and independent oversight. The UARB will determine whether the settlement results in just and reasonable rates and is in the public interest."
Related News