Utilities say grid can handle hybrids

By Globe and Mail


NFPA 70e Training

Our customized live online or in‑person group training can be delivered to your staff at your location.

  • Live Online
  • 6 hours Instructor-led
  • Group Training Available
Regular Price:
$199
Coupon Price:
$149
Reserve Your Seat Today
Which draws more juice from the electric grid, a big-screen plasma television or recharging a plug-in hybrid car?

The answer — a plasma television — is what is easing the minds of utility company executives across the U.S. as they plan for what is likely to be a conversion of much of the country's vehicle fleet from gasoline to electricity in the coming years.

Plasma TVs, industry officials say, consume about four times the electricity as recharging a plug-in hybrid. Yet utilities have managed to cope with the increased loads as thousands of new televisions came on line.

So as long as the changeover from internal combustion engines to electric vehicles is somewhat gradual, they should be able to handle it in the same way, Mark Duvall, program manager for electric transportation, power delivery and distribution for the Electric Power Research Institute, said.

"We've already added to the grid the equivalent of several years' production of plug-in hybrids," Duvall said at a conference on electric vehicles in San Jose. "The utilities, they stuck with it. They said, 'All right, that's what's happening. This is where the loads are going, and we're going to do this."'

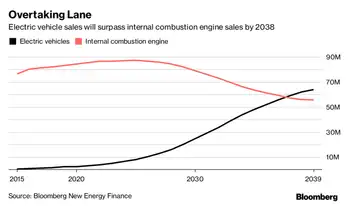
Auto makers, such as General Motors Corp. and Toyota Motor Corp., are planning to bring rechargeable vehicles to the market as early as 2010. But speakers at the Plug-In 2008 conference say it will take much longer for them to arrive in mass numbers, due in part to a current lack of large-battery manufacturing capacity. Auto and battery companies still are working on the lithium-ion battery technology needed for the cars, and on how to link the battery packs to the vehicles.

"We see the vehicle penetration levels coming at a rate that's manageable," said Efrain Ornelas, environmental technical supervisor with Pacific Gas and Electric Co. in San Francisco. "It's not like tomorrow the flood gates are going to open and 100,000 vehicles are going to come into San Francisco or something like that."

Instead, the vehicles will show up by the thousands throughout Northern California, he predicted. PG&E will be able to track their charging patterns and plan accordingly for the future, he said.

Utility officials say they already are coping with increased demand, especially during peak-use periods in the afternoon and early evening. But the rest of the day, most utilities have excess generating capacity that could be used to recharge cars.

But the preparation doesn't mean electric vehicles will be accommodated without problems and good planning, the officials say.

Since most electric cars will likely be charged during off-peak electric use times, utilities should have no problem generating enough electricity. But since people with the means to buy electric cars likely will live in the same areas, utilities worry about stress on their distribution systems, Ornelas said.

That means consumers will face a lot of choices about when and where they charge up their cars and how much they want to pay for the electricity.

The choice for consumers will come because utilities likely will raise rates to charge cars during peak use times, generally from around noon to 8 p.m., and lower them for charging during low-use hours, industry officials say.

In California, utilities already are installing meters that track use by time of day. PG&E charges 30 cents per kilowatt hour to charge an electric vehicle during peak hours, he said, but charges only five cents from midnight to 7 p.m.

Duvall said utilities still have to be wary that high gasoline prices could push sales of rechargeable electric vehicles well into the millions by 2020, because that could stress the system. Other possible problems include electric vehicles getting larger and requiring far more electricity for recharging, and demands from people that their vehicles be recharged quickly, drawing more electricity during peak times.

Also, companies such as the Campbell-based Coulomb Technologies, are starting to develop recharging stations for sale to parking lot operators, office buildings and cities, which will draw more electricity.

There's also talk of the cars storing electricity and sending it back to the power companies during peak times, but officials say that's a long way off.

Industry officials say they can manage the fleet changeover as the cars and the utilities each have computers in place to manage when the cars are recharged.

"From our perspective I think it's something that's really manageable," said Ornelas.

Related News

The Netherlands Outpaces Canada in Solar Power Generation

Netherlands vs Canada Solar Power compares per capita capacity, renewable energy policies, photovoltaics adoption, rooftop installations, grid integration, and incentives like feed-in tariffs and BIPV, highlighting efficiency, costs, and public engagement.


Key Points

Concise comparison of per capita capacity, policies, technology, and engagement in Dutch and Canadian solar adoption.

✅ Dutch per capita PV capacity exceeds Canada's by wide margin.

✅ Strong incentives: net metering, feed-in tariffs, rooftop focus.

✅ Climate, grid density, and awareness drive higher yields.


When it comes to harnessing solar power, the Netherlands stands as a shining example of efficient and widespread adoption, far surpassing Canada in solar energy generation per capita. Despite Canada's vast landmass and abundance of sunlight, the Netherlands has managed to outpace its North American counterpart, which some experts call a solar power laggard in solar energy production. This article explores the factors behind the Netherlands' success in solar power generation and compares it to Canada's approach.

Solar Power Capacity and Policy Support

The Netherlands has rapidly expanded its solar power capacity in recent years, driven by a combination of favorable policies, technological advancements, and public support. According to recent data, the Netherlands boasts a significantly higher per capita solar power capacity compared to Canada, where demand for solar electricity lags relative to deployment in many regions, leveraging its smaller geographical size and dense population centers to maximize solar panel installations on rooftops and in urban areas.

In contrast, Canada's solar energy development has been slower, despite having vast areas of suitable land for solar farms. Challenges such as regulatory hurdles, varying provincial policies, and the high initial costs of solar installations have contributed to a more gradual adoption of solar power across the country. However, provinces like Ontario have seen significant growth in solar installations due to supportive government incentives and favorable feed-in tariff programs, though growth projections were scaled back after Ontario scrapped a key program.

Innovation and Technological Advancements

The Netherlands has also benefited from ongoing innovations in solar technology and efficiency improvements. Dutch companies and research institutions have been at the forefront of developing new solar panel technologies, improving efficiency rates, and exploring innovative applications such as building-integrated photovoltaics (BIPV). These advancements have helped drive down the cost of solar energy and increase its competitiveness with traditional fossil fuels.

In contrast, while Canada has made strides in solar technology research and development, commercialization and widespread adoption have been more restrained due to factors like market fragmentation and the country's reliance on other energy sources such as hydroelectricity.

Public Awareness and Community Engagement

Public awareness and community engagement play a crucial role in the Netherlands' success in solar power adoption. The Dutch government has actively promoted renewable energy through public campaigns, educational programs, and financial incentives for homeowners and businesses to install solar panels. This proactive approach has fostered a culture of energy conservation and sustainability among the Dutch population.

In Canada, while there is growing public support for renewable energy, varying levels of awareness and engagement across different provinces have impacted the pace of solar energy adoption. Provinces like British Columbia and Alberta have seen increasing interest in solar power, driven by environmental concerns, technological advancements, and economic benefits, as the country is set to hit 5 GW of installed capacity in the near term.

Climate and Geographic Considerations

Climate and geographic considerations also influence the disparity in solar power generation between the Netherlands and Canada. The Netherlands, despite its northern latitude, benefits from relatively mild winters and a higher average annual sunlight exposure compared to most regions of Canada. This favorable climate has facilitated higher solar energy yields and made solar power a more viable option for electricity generation.

In contrast, Canada's diverse climate and geography present unique challenges for solar energy deployment. Northern regions experience extended periods of darkness during winter months, limiting the effectiveness of solar panels in those areas. Despite these challenges, advancements in energy storage technologies and hybrid solar-diesel systems are making solar power increasingly feasible in remote and off-grid communities across Canada, even as Alberta faces expansion challenges related to grid integration and policy.

Future Prospects and Challenges

Looking ahead, both the Netherlands and Canada face opportunities and challenges in expanding their respective solar power capacities. In the Netherlands, continued investments in solar technology, grid infrastructure upgrades, and policy support will be crucial for maintaining momentum in renewable energy development.

In Canada, enhancing regulatory consistency, scaling up solar installations in urban and rural areas, and leveraging emerging technologies will be essential for narrowing the gap with global leaders in solar energy generation and for seizing opportunities in the global electricity market as the energy transition accelerates.

In conclusion, while the Netherlands currently generates more solar power per capita than Canada, with the Prairie Provinces poised to lead growth in the Canadian market, both countries have unique strengths and challenges in their pursuit of a sustainable energy future. By learning from each other's successes and leveraging technological advancements, both nations can further accelerate the adoption of solar power and contribute to global efforts to combat climate change.


Related News

View more

E.ON to Commission 2500 Digital Transformer Stations

E.ON Digital Transformer Stations modernize distribution grids with smart grid monitoring, voltage control, and remote switching, enabling bidirectional power flow, renewables integration, and rapid fault isolation from centralized grid control centres.


Key Points

Remotely monitored grid nodes enhancing smart grid stability and speedier fault response.

✅ Real-time voltage and current data along feeders and laterals

✅ Remote switching cuts outage duration and truck rolls

✅ Supports renewables and bidirectional power flows


E.ON plans to commission 2500 digital transformer stations in the service areas of its four German distribution grid operators - Avacon, Bayernwerk, E.DIS and Hansewerk - by the end of 2019. Starting this year, E.ON will solely install digital transformer stations in Germany, aligning with 2019 grid edge trends seen across the sector. This way, the digital grid is quite naturally being integrated into E.ON's distribution grids.

With these transformer stations as the centrepiece of the smart grid, it is possible to monitor and control using synchrophasors in the power grid from the grid control centre. This helps to maintain a more balanced utilisation of the grid and, with increasing complexity, ensures continued security of supply.

Until now, the current and voltage parameters required for safe grid operation could usually only be determined at the beginning of a power line, where there is usually a grid substation in place. Controlling current flow and voltage in the downstream system was physically impossible.

In the future, grids will have to function in both directions: they will bring electricity to the customer while at the same time collecting and transmitting more and more green electricity via HVDC technology where appropriate. This requires physical data to be made available along the entire route. To ensure security of supply, voltage fluctuations must be kept within narrowly defined limits and the current flow must not exceed the specified value, while reducing line losses with superconducting cables remains an important consideration. To manage this challenge, it is necessary to install digital technology.

The possibility of remotely controlling grids also reduces downtimes in the event of faults and supports a smarter electricity infrastructure approach. With the new technology, our grid operators can quickly and easily access the stations of the affected line. The grid control centres can thus limit and eliminate faults on individual line sections within a very short space of time.


Related News

View more

New York Faces Soaring Energy Bills

New York faces soaring energy bills as utilities seek record rate hikes, aging grid infrastructure demands upgrades, and federal renewable policies shift. Consumers struggle with affordability, late payments, and rising costs of delivery and energy supply across the state.


Why is New York Facing Soaring Energy Bills?

New York faces soaring energy bills because utilities are raising rates to cover the costs of grid upgrades, inflation, and policy-driven changes in energy supply.

✅ Utilities seek double-digit rate hikes across the state

✅ Aging infrastructure and storm repairs increase delivery costs

✅ Federal policies and gas dependence push energy prices higher

New Yorkers are bracing for another wave of energy bill increases as utilities seek record-high rate hikes and policy changes ripple through the state’s power system. Electric bills in New York are the highest they’ve been in over a decade, and more than a million households are now at least two months behind on payments, a sign of pandemic energy insecurity that continues to strain budgets, owing utilities nearly $2 billion.

Record numbers of households have had their electricity or gas shut off this year — more than 61,000 in May alone — despite pandemic shut-off suspensions that had offered temporary relief, the highest the Public Utility Law Project (PULP) has ever recorded. “This August was the group’s busiest month ever,” said Laurie Wheelock, PULP’s executive director, citing a surge in calls to its hotline. “The top concern on people’s minds: rate hikes.”

Utilities across the state are pushing for significant price increases, citing aging infrastructure, the need for climate adaptation, and higher operating costs, as California regulators face calls for action amid rising bills. “We used to see single-digit rate hikes and now we see double-digit rate hikes,” said Jessica Azulay, executive director of the Alliance for a Green Economy. “That’s a new normal that is unacceptable.”

Several utilities have requested delivery rate increases of 25 percent or more, with some proposals as high as 39 percent. Upstate utilities NYSEG and RG&E are seeking to raise electric and gas bills by about $33 a month, although regulators are unlikely to approve the full amount.

The companies argue the hikes are needed “to pay for rebuilding an aging grid and expanding its capacity to meet residents’ and businesses’ service demands,” including storm repairs. They also claim the plan would create more than 1,000 jobs.

James Denn, a spokesperson for the Public Service Commission (PSC), said much of the cost pressure stems from “inflation, higher interest rates, supply chain disruptions, the global push to upgrade electrical infrastructure, and, most recently, the rising risk and uncertainty from tariffs,” trends reflected in U.S. electricity price data over the past two years.

While some have blamed New York’s clean-energy transition, a PSC report found that state climate policies account for only 5 to 9.5 percent of the average household’s electric bill, or approximately $10 to $12 per month. The bulk of the increases still come from traditional spending on infrastructure, storm resilience, and system expansion.

On the supply side, costs are rising too. President Donald Trump’s recent policies have threatened renewable-energy investment nationwide, even as states’ renewable ambitions carry significant costs, potentially adding to New York’s woes. His July “megabill” phases out a 30 percent federal tax credit for solar and wind unless projects begin construction by mid-2026. Industry experts warn that the changes could make renewables “more expensive to build” and “increase reliance on gas.”

“It just means more expensive power,” said Marguerite Wells of the Alliance for Clean Energy New York.

The state estimates Trump’s policy shifts could cost New York $60 billion in lost renewable investment. With fewer clean-energy projects moving forward, gas — which already supplies roughly half of the state’s electricity — will remain the dominant source, tying energy prices to volatile global markets and the kinds of price drivers seen in California in recent years.

Governor Kathy Hochul has called affordability “our greatest short-term challenge,” while consumer advocates are demanding reforms to reduce utility profits and overhaul “rate design,” and to strengthen protections such as the emergency disconnection moratorium that applies during declared emergencies.

“There is definitely a groundswell of concern,” Wheelock said. “We go to meetings and we’re getting questions about rate design, like, ‘What is the revenue decoupling mechanism?’ Never had that question before.”


Related Articles


View more

Offshore wind is set to become a $1 trillion business

Offshore wind power accelerates low-carbon electrification, leveraging floating turbines, high capacity factors, HVDC transmission, and hydrogen production to decarbonize grids, cut CO2, and deliver competitive, reliable renewable energy near demand centers.


Key Points

Offshore wind power uses offshore turbines to deliver low-carbon electricity with high capacity factors and falling costs.

✅ Sea-based wind farms with 40-50% capacity factors

✅ Floating turbines unlock deep-water, far-shore resources

✅ Enables hydrogen production and strengthens grid reliability


The need for affordable low-carbon technologies is greater than ever

Global energy-related CO2 emissions reached a historic high in 2018, driven by an increase in coal use in the power sector. Despite impressive gains for renewables, fossil fuels still account for nearly two-thirds of electricity generation, the same share as 20 years ago. There are signs of a shift, with increasing pledges to decarbonise economies and tackle air pollution, and with World Bank support helping developing countries scale wind, but action needs to accelerate to meet sustainable energy goals. As electrification of the global energy system continues, the need for clean and affordable low-carbon technologies to produce this electricity is more pressing than ever. This World Energy Outlook special report offers a deep dive on a technology that today has a total capacity of 23 GW (80% of it in Europe) and accounts for only 0.3% of global electricity generation, but has the potential to become a mainstay of the world's power supply. The report provides the most comprehensive analysis to date of the global outlook for offshore wind, its contributions to electricity systems and its role in clean energy transitions.


The offshore wind market has been gaining momentum

The global offshore wind market grew nearly 30% per year between 2010 and 2018, benefitting from rapid technology improvements. Over the next five years, about 150 new offshore wind projects are scheduled to be completed around the world, pointing to an increasing role for offshore wind in power supplies. Europe has fostered the technology's development, led by the UK offshore wind sector alongside Germany and Denmark. The United Kingdom and Germany currently have the largest offshore wind capacity in operation, while Denmark produced 15% of its electricity from offshore wind in 2018. China added more capacity than any other country in 2018.


The untapped potential of offshore wind is vast

The best offshore wind sites could supply more than the total amount of electricity consumed worldwide today. And that would involve tapping only the sites close to shores. The IEA initiated a new geospatial analysis for this report to assess offshore wind technical potential country by country. The analysis was based on the latest global weather data on wind speed and quality while factoring in the newest turbine designs. Offshore wind's technical potential is 36 000 TWh per year for installations in water less than 60 metres deep and within 60 km from shore. Global electricity demand is currently 23 000 TWh. Moving further from shore and into deeper waters, floating turbines could unlock enough potential to meet the world's total electricity demand 11 times over in 2040. Our new geospatial analysis indicates that offshore wind alone could meet several times electricity demand in a number of countries, including in Europe, the United States and Japan. The industry is adapting various floating foundation technologies that have already been proven in the oil and gas sector. The first projects are under development and look to prove the feasibility and cost-effectiveness of floating offshore wind technologies.


Offshore wind's attributes are very promising for power systems

New offshore wind projects have capacity factors of 40-50%, as larger turbines and other technology improvements are helping to make the most of available wind resources. At these levels, offshore wind matches the capacity factors of gas- and coal-fired power plants in some regions – though offshore wind is not available at all times. Its capacity factors exceed those of onshore wind and are about double those of solar PV. Offshore wind output varies according to the strength of the wind, but its hourly variability is lower than that of solar PV. Offshore wind typically fluctuates within a narrower band, up to 20% from hour to hour, than solar PV, which varies up to 40%.

Offshore wind's high capacity factors and lower variability make its system value comparable to baseload technologies, placing it in a category of its own – a variable baseload technology. Offshore wind can generate electricity during all hours of the day and tends to produce more electricity in winter months in Europe, the United States and China, as well as during the monsoon season in India. These characteristics mean that offshore wind's system value is generally higher than that of its onshore counterpart and more stable over time than that of solar PV. Offshore wind also contributes to electricity security, with its high availability and seasonality patterns it is able to make a stronger contribution to system needs than other variable renewables. In doing so, offshore wind contributes to reducing CO2 and air pollutant emissions while also lowering the need for investment in dispatchable power plants. Offshore wind also has the advantage of avoiding many land use and social acceptance issues that other variable renewables are facing.


Offshore wind is on track to be a competitive source of electricity

Offshore wind is set to be competitive with fossil fuels within the next decade, as well as with other renewables including solar PV. The cost of offshore wind is declining and is set to fall further. Financing costs account for 35% to 50% of overall generation cost, and supportive policy frameworks are now enabling projects to secure low cost financing in Europe, with zero-subsidy tenders being awarded. Technology costs are also falling. The levelised cost of electricity produced by offshore wind is projected to decline by nearly 60% by 2040. Combined with its relatively high value to the system, this will make offshore wind one of the most competitive sources of electricity. In Europe, recent auctions indicate that offshore wind will soon beat new natural gas-fired capacity on cost and be on a par with solar PV and onshore wind. In China, offshore wind is set to become competitive with new coal-fired capacity around 2030 and be on par with solar PV and onshore wind. In the United States, recent project proposals indicate that offshore wind will soon be an affordable option, even as the 1 GW timeline continues to evolve, with potential to serve demand centres along the country's east coast.

Innovation is delivering deep cost reductions in offshore wind, and transmission costs will become increasingly important. The average upfront cost to build a 1 gigawatt offshore wind project, including transmission, was over $4 billion in 2018, but the cost is set to drop by more than 40% over the next decade. This overall decline is driven by a 60% reduction in the costs of turbines, foundations and their installation. Transmission accounts for around one-quarter of total offshore wind costs today, but its share in total costs is set to increase to about one-half as new projects move further from shore. Innovation in transmission, for example through work to expand the limits of direct current technologies, will be essential to support new projects without raising their overall costs.


Offshore wind is set to become a $1 trillion business

Offshore wind power capacity is set to increase by at least 15-fold worldwide by 2040, becoming a $1 trillion business. Under current investment plans and policies, the global offshore wind market is set to expand by 13% per year, reflecting its growth despite Covid-19 in recent years, passing 20 GW of additions per year by 2030. This will require capital spending of $840 billion over the next two decades, almost matching that for natural gas-fired or coal-fired capacity. Achieving global climate and sustainability goals would require faster growth: capacity additions would need to approach 40 GW per year in the 2030s, pushing cumulative investment to over $1.2 trillion. 

The promising outlook for offshore wind is underpinned by policy support in an increasing number of regions. Several European North Seas countries – including the United Kingdom, Germany, the Netherlands and Denmark – have policy targets supporting offshore wind. Although a relative newcomer to the technology, China is quickly building up its offshore wind industry, aiming to develop a project pipeline of 10 GW by 2020. In the United States, state-level targets and federal incentives are set to kick-start the U.S. offshore wind surge in the coming years. Additionally, policy targets are in place and projects under development in Korea, Japan, Chinese Taipei and Viet Nam.

 The synergies between offshore wind and offshore oil and gas activities provide new market opportunities. Since offshore energy operations share technologies and elements of their supply chains, oil and gas companies started investing in offshore wind projects many years ago. We estimate that about 40% of the full lifetime costs of an offshore wind project, including construction and maintenance, have significant synergies with the offshore oil and gas sector. That translates into a market opportunity of $400 billion or more in Europe and China over the next two decades. The construction of foundations and subsea structures offers potential crossover business, as do practices related to the maintenance and inspection of platforms. In addition to these opportunities, offshore oil and gas platforms require electricity that is often supplied by gas turbines or diesel engines, but that could be provided by nearby wind farms, thereby reducing CO2 emissions, air pollutants and costs.


Offshore wind can accelerate clean energy transitions

Offshore wind can help drive energy transitions by decarbonising electricity and by producing low-carbon fuels. Over the next two decades, its expansion could avoid between 5 billion and 7 billion tonnes of CO2 emissions from the power sector globally, while also reducing air pollution and enhancing energy security by reducing reliance on imported fuels. The European Union is poised to continue leading the wind energy at sea in Europe industry in support of its climate goals: its offshore wind capacity is set to increase by at least fourfold by 2030. This growth puts offshore wind on track to become the European Union's largest source of electricity in the 2040s. Beyond electricity, offshore wind's high capacity factors and falling costs makes it a good match to produce low-carbon hydrogen, a versatile product that could help decarbonise the buildings sector and some of the hardest to abate activities in industry and transport. For example, a 1 gigawatt offshore wind project could produce enough low-carbon hydrogen to heat about 250 000 homes. Rising demand for low-carbon hydrogen could also dramatically increase the market potential for offshore wind. Europe is looking to develop offshore "hubs" for producing electricity and clean hydrogen from offshore wind.


It's not all smooth sailing

Offshore wind faces several challenges that could slow its growth in established and emerging markets, but policy makers and regulators can clear the path ahead. Developing efficient supply chains is crucial for the offshore wind industry to deliver low-cost projects. Doing so is likely to call for multibillion-dollar investments in ever-larger support vessels and construction equipment. Such investment is especially difficult in the face of uncertainty. Governments can facilitate investment of this kind by establishing a long-term vision for offshore wind and by drawing on U.K. policy lessons to define the measures to be taken to help make that vision a reality. Long-term clarity would also enable effective system integration of offshore wind, including system planning to ensure reliability during periods of low wind availability.

The success of offshore wind depends on developing onshore grid infrastructure. Whether the responsibility for developing offshore transmission lies with project developers or transmission system operators, regulations should encourage efficient planning and design practices that support the long-term vision for offshore wind. Those regulations should recognise that the development of onshore grid infrastructure is essential to the efficient integration of power production from offshore wind. Without appropriate grid reinforcements and expansion, there is a risk of large amounts of offshore wind power going unused, and opportunities for further expansion could be stifled. Development could also be slowed by marine planning practices, regulations for awarding development rights and public acceptance issues.

The future of offshore wind looks bright but hinges on the right policies

The outlook for offshore wind is very positive as efforts to decarbonise and reduce local pollution accelerate. While offshore wind provides just 0.3% of global electricity supply today, it has vast potential around the world and an important role to play in the broader energy system. Offshore wind can drive down CO2 emissions and air pollutants from electricity generation. It can also do so in other sectors through the production of clean hydrogen and related fuels. The high system value of offshore wind offers advantages that make a strong case for its role alongside other renewables and low-carbon technologies. Government policies will continue to play a critical role in the future of offshore wind and  the overall pace of clean energy transitions around the world.


Related News

View more

Cheap at Last, Batteries Are Making a Solar Dream Come True

Solar Plus Storage is accelerating across utilities and microgrids, pairing rooftop solar with lithium-ion batteries to enhance grid resilience, reduce peak costs, prevent blackouts, and leverage tax credits amid falling prices and decarbonization goals.


Key Points

Solar Plus Storage combines solar generation with batteries to shift load, boost reliability, and cut energy costs.

✅ Cuts peak demand charges and enhances blackout resilience

✅ Falling battery and solar costs drive nationwide utility adoption

✅ Enables microgrids and grid services like frequency regulation


Todd Karin was prepared when California’s largest utility shut off power to millions of people to avoid the risk of wildfires last month. He’s got rooftop solar panels connected to a single Tesla Powerwall in his rural home near Fairfield, California. “We had backup power the whole time,” Karin says. “We ran the fridge and watched movies.”

Californians worried about an insecure energy future are increasingly looking to this kind of solution. Karin, a 31-year-old postdoctoral fellow at Lawrence Berkeley National Laboratory, spent just under $4,000 for his battery by taking advantage of tax credits. He's also saving money by discharging the battery on weekday evenings, when energy is more expensive during peak demand periods. He expects to save around $1,500 over the 10 years the battery is under warranty.

The economics don’t yet work for every household, but the green-power combo of solar panels plus batteries is popping up on a much bigger scale in some unexpected places. Owners of a rice processing plant in Arkansas are building a system to generate 26 megawatts of solar power and store another 40 MW. The plant will cut its power bill by a third, and owners say they will pass the savings to local rice growers. New York’s JFK Airport is installing solar plus storage to reduce its power load by 10 percent, while Pittsburgh International Airport is building a 20-MW solar and natural gas microgrid to keep it independent from the local utility. Officials at both airports are worried about recent power shutdowns due to weather and overload-related blackouts.

And residents of the tiny northern Missouri town of Green City (pop. 608) are getting 2.5 MW of solar plus four hours of battery storage from the state’s public utility next year. The solar power won’t go directly to townspeople, but instead will back up the town’s substation, reducing the risk of a potential shutdown. It’s part of a $68 million project to improve the reliability of remote substations far from electric generating stations.

“It’s a pretty big deal for us,” says Chad Raley, who manages technology and renewables at Ameren, a Missouri utility that is building three rural solar-plus-storage projects to better manage the flow of electricity across the local grid. “It gives us so much flexibility with renewable generation. We can’t control the sun or clouds or wind, but we can have battery storage.”

The first solar-plus-storage installations started about a decade ago on a small scale in sunny states like California, Hawaii, and Arizona. Now they’re spreading across the country, driven by falling prices of both solar panels and lithium-ion batteries the size of a shipping container imported from both China and South Korea, with wind, solar, and batteries making up most of the utility-scale pipeline nationwide. These countries have ramped up production efficiencies and lowered labor costs, leaving many US manufacturers in the dust. In fact, the price of building a comparable solar-plus-storage generating facility is now cheaper than operating a coal-fired power plant, industry officials say. In certain circumstances, the cost is equal to some natural gas plants.

“This is not just a California, New York, Massachusetts thing,” says Kelly Speakes-Backman, CEO of the Energy Storage Association, an industry group in Washington. She says more than 30 states have renewable storage on the grid. Utilities have proposed and states have approved 7 gigawatts to be installed by 2030, and most new storage will be paired with solar across the US.

Speakes-Backman estimates the unit cost of electricity produced from a solar-plus-storage system will drop 10 to 15 percent each year through 2024, supporting record growth in solar and storage investments. “If you have the option of putting out a polluting or non-polluting generating source at the same price, what are you going to pick?” says Speakes-Backman.

She notes that PJM, a large Mid-Atlantic wholesale grid operator, announced it will deploy battery storage to help smooth out fluctuating power from two wind farms it operates. “When the grid fluctuates, storage can react to it quickly and can level out the supply,” she says. In the Midwest, grid-level battery storage is also being used to absorb extra wind power. Batteries hold onto the wind and put it back onto the grid when people need it.

While the solar-plus-storage trend isn’t yet putting a huge dent in our fossil fuel use, according to Paul Denholm, an energy analyst at the National Renewable Energy Laboratory in Golden, Colorado, it is a good beginning and has the side effect of cutting air pollution. By 2021, solar and other renewable energy sources will overtake coal as a source of energy, and the US is moving toward 30% electricity from wind and solar, according to a new report by the Institute for Energy Economics and Financial Analysis, a nonprofit think tank based in Cleveland.

That’s a glimmer of hope in a somewhat dreary week of news on carbon emissions. A new United Nations report released this week finds that the planet is on track to warm by 3.9 degrees Celsius (7 Fahrenheit) by 2100 unless drastic cuts are made by phasing out gas-powered cars, eliminating new coal-fired power plants, and changing how we grow and manage land, and scientists are working to improve solar and wind power to limit climate change as well.

Energy-related greenhouse gas emissions in the US rose 2.7 percent in 2018 after several years of decline. The Trump administration has rolled back climate policies from the Obama years, including withdrawing from the Paris climate accords.

There may be hope from green power initiatives outside the Beltway, though, and from federal proposals like a tenfold increase in US solar that could remake the electricity system. Arizona plans to boost solar-plus-storage from today’s 6 MW to a whopping 850 MW by 2025, more than the entire capacity of large-scale batteries in the US today. And some folks might be cheering the closing of the West’s biggest coal-fired power plant, the 2.25-gigawatt Navajo Generating Station, in Arizona, which had spewed soot and carbon dioxide over the region for 45 years until last week. The closure might help the planet and clear the hazy smog over the Grand Canyon.


Related News

View more

Operating record for Bruce Power as Covid-19 support Council announced

Bruce Power Life-Extension Programme advances Ontario nuclear capacity through CANDU Major Component Replacement, reliable operation milestones, supply chain retooling for COVID-19 recovery, PPE production, ventilator projects, and medical isotope supply security.


Key Points

A program to refurbish CANDU reactors, extend asset life, and mobilize Ontario nuclear supply chain and isotopes.

✅ Extends CANDU units via Major Component Replacement

✅ Supports COVID-19 recovery with PPE and ventilator projects

✅ Boosts Ontario energy reliability and medical isotopes


Canada’s Bruce Power said on 1 May that unit 1 at the Bruce nuclear power plant had set a record of 624 consecutive days of reliable operation – the longest since it was returned to service in 2012.

It exceeded Bruce 8’s run of 623 consecutive days between May 2016 and February 2018. Bruce 1, a Candu reactor, was put into service in 1977. It was shut down and mothballed by the former Ontario Hydro in 1997, and was refurbished and returned to service in 2012 by Bruce Power.

Bruce units 3 and 4 were restarted in 2003 and 2004. They are part of Bruce Power’s Life-Extension Programme, and future planning such as Bruce C project exploration continues across the fleet, with units 3 and 4 to undergo Major Component Replacement (MCR) Projects from 2023-28, adding about 30 years of life to the reactors.

The refurbishment of Bruce 6 has begun and will be followed by MCR Unit 3 which is scheduled to begin in 2023. Nuclear power accounts for more than 60% of Ontario’s supply, with Bruce Power providing more than 30%   of the province’s electricity.

Set up of Covid recovery council
On 30 April, Bruce Power announced the establishment of the Bruce Power Retooling and Economic Recovery Council to leverage the province’s nuclear supply chain to support Ontario’s fight against Covid-19 and to help aid economic recovery.

Bruce Power’s life extension programme is Canada’s second largest infrastructure project and largest private sector infrastructure programme. It is creating 22,000 direct and indirect jobs, delivering economic benefits that are expected to contribute $4 billion to Ontario’s GDP and $8-$11 billion to Canada’s gross domestic product (GDP), Bruce Power said.

“With 90% of the investment in manufactured goods and services coming from 480 companies in Ontario and other provinces, including recent manufacturing contracts with key suppliers, we can harness these capabilities in the fight against Covid-19, and help drive our economic recovery,” the company said.

“An innovative and dynamic nuclear supply chain is more important than ever in meeting this new challenge while successfully implementing our mission of providing clean, reliable, flexible, low-cost nuclear energy and a global supply of medical isotopes,” said Bruce Power president and CEO Mike Rencheck. “We are mobilising a great team with our extended supply chain, which spans the province, to assist in the fight against Covid-19 and to help drive our economic recovery in the future.”

Greg Rickford, the Minister of Energy, Mines, Northern Development, and Minister of Indigenous Affairs, said the launch of the council is consistent with Ontario’s focus to fight Covid-19 as a top priority and a look ahead to economic recovery, and initiatives like Pickering life extensions supporting long-term system reliability.

The creation of the Council was announced during a live event on Bruce Power's Facebook page, in which Rencheck was joined by Associate Minister of Energy Bill Walker and Rocco Rossi, the president and CEO of the Ontario Chamber of Commerce.

Walker reiterated the Government of Ontario’s commitment to nuclear power over the long term and to the life extension programme, including the Pickering B refurbishment as part of this strategy.

The Council, which will be formed for the duration of the pandemic and will include of all of Bruce Power’s Ontario-based suppliers, will focus on the continued retooling of the supply chain to meet front-line Covid-19 needs to contribute to the province’s economy recovery in the short, medium and long term.

New uses for nuclear medical applications will be explored, including isotopes for the sterilisation of medical equipment and long-term supply security.

The supply chain will be leveraged to support the health care sector through the rapid production of medical Personal Protection Equipment for front line-workers and large-scale PPE donations to communities as well as participation in pilot projects to make ventilators within the Bruce Power supply chain or help identify technology to better utilise existing ventilators;

“Buy Local” tools and approaches will be emphasised to ensure small businesses are utilised fully in communities where nuclear suppliers are located.

The production of hand sanitiser and other cleaning products will be facilitated for distribution to communities.


Related News

View more

Sign Up for Electricity Forum’s Newsletter

Stay informed with our FREE Newsletter — get the latest news, breakthrough technologies, and expert insights, delivered straight to your inbox.

Electricity Today T&D Magazine Subscribe for FREE

Stay informed with the latest T&D policies and technologies.
  • Timely insights from industry experts
  • Practical solutions T&D engineers
  • Free access to every issue

Live Online & In-person Group Training

Advantages To Instructor-Led Training – Instructor-Led Course, Customized Training, Multiple Locations, Economical, CEU Credits, Course Discounts.

Request For Quotation

Whether you would prefer Live Online or In-Person instruction, our electrical training courses can be tailored to meet your company's specific requirements and delivered to your employees in one location or at various locations.